By Marlene Boersch, Mercantile Consulting Venture Inc.
October 2020
The harvest for peas and lentils has now wound down, so this is a good time to assess how the Canadian crops fit into the global outlook for pulses.
Peas
Let’s first take stock of the Canadian crop, because the outcome of the Canadian pea crop is quite determinant within the global pea market. This is because we estimate that this year, Canadian peas will represent about 36% of production within the world’s major pea producers, and Canada should be able to do about 27% of all pea exports among the major ex- porters.
Unfortunately, the 2020 production estimates for Canadian peas still vary. The Statistics Canada (StatCan) production estimates showed a confusingly wide range of 636,000 tonnes between their August 21 estimate of 5 million (M) tonnes and their September 14 estimate of 4.36 M tonnes (a 13% change). Mercantile has been using a 4.73 M tonne estimate for peas and we continue to use this number.
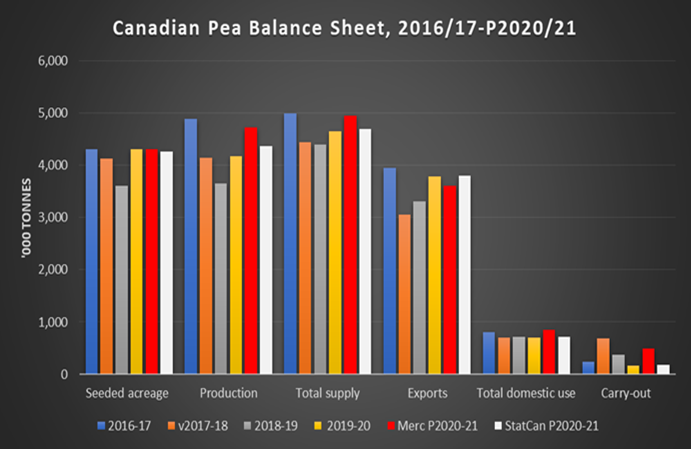
Carry-in stocks were quite small this year thanks to very good export shipments during April, May, and June. StatCan is showing carry-in stocks of 233,000 tonnes, down from 648,000 tonnes two years ago. Our calculation shows an even smaller number at 160,000 tonnes. This means that, in spite of better yields, the supply of 4.95 M tonnes is only 6% higher than last year’s. Our export projection is a relatively cautious 3.6 M tonnes (more on that later), but we note that Agriculture and Agri-Food Canada (AAFC) raised their pea export projection for 2020/21 to 3.8 M tonnes from 3.4 M tonnes just recently. The AAFC carry-out was thus reduced to a tight 255,000 tonnes from their August number of 450,000 tonnes.
Importantly, breaking the balance sheet down by type of pea emphasizes that, because of the shift in acreage between yellow and green peas, yellow peas are definitely tighter than green peas, which will reduce or eliminate the premium of greens over yellows this year.
Within the global production picture, Black Sea producers (especially Russia and Ukraine), France, and the United States (U.S.) are important. While Canada contributes between 28-36% of peas, Russia and Ukraine combined contribute 16-30%, France 5-6%, the U.S. 6-8%, and Australia 2-4%. For this crop year, we calculate that pea production globally by all major producers combined increased by a moderate 4%.
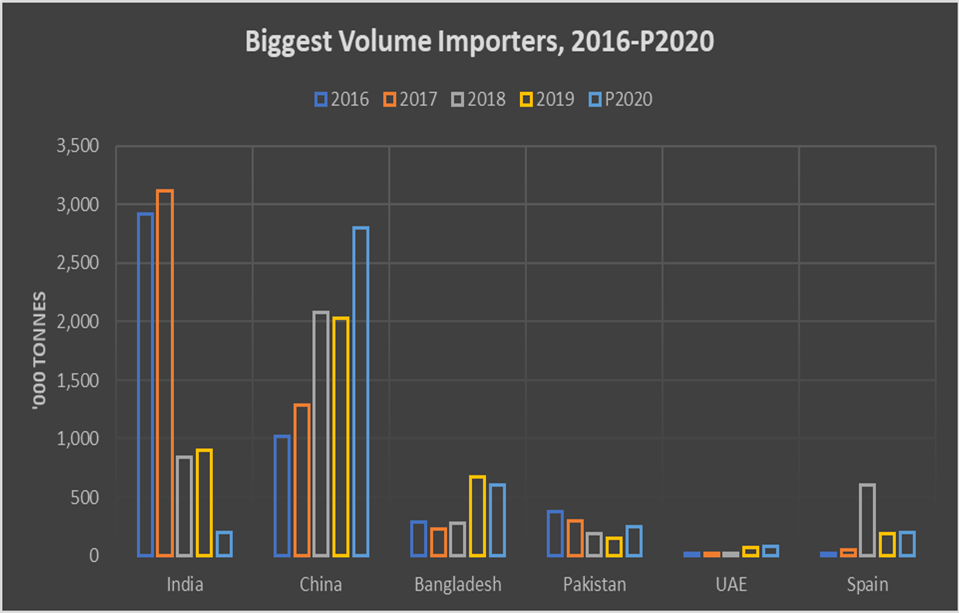
On the global demand side, the biggest volume players are India (depending on import regulations), China, Bangladesh, Pakistan, United Arab Emirates (UAE), and Spain. Imports by India have imploded due to import restrictions, and for the coming year, we are estimating zero pea imports by India for 2020/21 in our calculations for now.
Meanwhile, pea imports by China have grown from 150,000 tonnes in 2008 to 2.1 M tonnes in 2019 (all origins). China will clearly be the decisive import factor this coming year, especially for Canada, because a full 60% of all Canadian pea exports in 2019/20 went to China.
A big demand driver in China over the past one and a half years has been the compound feed market for both swine and aquafeed. Looking at prevailing market values for feed ingredients, we can see that pea protein is very cheap relative to soybean protein, so that peas remain very attractive to that sector. For example, soybean values have appreciated by $1 per bushel (bu) USD over the past two months, while yellow pea values on the prairies are down by 15¢/bu.
Additional layers of demand in China come from starch extraction (vermicelli noodles increasing capacity), pea protein extraction (increasing capacity), and from the food industry (greens and splits). We definitely expect demand by China for Canadian peas to continue to increase, but it does leave Canada somewhat vulnerable due to the big share in our overall demand for peas.
Linking our supply and demand numbers, global pea ending stocks look to increase by 290,000 tonnes to approximately 930,000 tonnes this crop year over last year, but that is minimal within the global picture. Indeed, export swings in the feed markets have the potential to be much bigger than that.
We also note that over the first seven weeks of the crop year, 1.3 M tonnes of peas had already been delivered into the handling system, which comprises 27% of this year’s production. The post-harvest vessel line-up for peas has also been unusually strong, so that we can already see that exports this crop year will be front-end loaded, which tends to be good for price developments. The extra export capacity at the West Coast due to the G3 terminal coming on stream this year should be helpful to maximizing bulk exports this year as well. Mercantile expects tight pea markets for this crop year.
Lentils
Canadian lentil acres and yields are both up over last years, so production is up by about 28% to 3 M tonnes. This looks like a scary development, however, lentil ending stocks at the end of July were minimal (50-60,000 tonnes), so that supply at 3.1 M tonnes is about the same as last year’s. We are using a lentil export projection of 2.4 M tonnes, which would leave Canadian ending stocks at 311,000 tonnes, a fairly moderate 11% stock- use ratio. Splitting the balance sheet by type of lentil shows that green lentils are even tighter than reds, and prevailing bids are reflecting this already.

Within the global context, Canadian lentils provide about 48% of global production (within the major producers). Primarily because of the increase in Canadian production this year, we estimate global lentil production at around 6.2 M tonnes to be up by 14% over the previous year. However, ending stocks in producing countries were depleted, and this year’s 6.2 M tonne production still is much smaller than the 7 M tonnes produced in 2016/17. There are, however, some stocks in some destination countries due to stockpiling early into COVID-19.

On the global demand side for lentils, India and Turkey are the biggest buyers, followed by Pakistan, Colombia, Algeria, and Morocco. The top three buy primarily red lentils, while the latter three buy green lentils. We expect demand by the major buyers to reach 1.58 M tonnes compared to 1.3 M tonnes last year.
On red lentils, we will have more competition by Australia late October onward, while competition by the U.S. for green lentil destinations will be reduced because of lower supplies in the U.S. (approximately 375,000 tonnes this year compared to 445,000 tonnes last year). India will again be very determinant for Canadian exports, because India purchased 32% of all Canadian lentils last crop year. Mercantile is using a conservative 600,000 tonnes of 2020/21 exports to India. Last year we shipped 907,000 tonnes.
Green lentils will be generally tight. If India buys any green lentils at all (replacement for pigeon peas), then Canada is likely to run out of green lentil stocks towards the end of the crop year. Small greens have become a fairly specialized market but will be tight as well. There will be more competition for red lentil markets by Australian lentils October forward, but an 11% stock-use ratio is still constructive. Should India buy more than the 600,000 tonnes we are assuming, then even the red lentil stock-use ratio could drop below 10%.
Marlene Boersch is an operating partner in Mercantile Consulting Venture Inc. More information can be found at www.mercantileventure.com.