Determination of optimal plant population targets and subsequent seeding rates is one of the first, and arguably most important, agronomic decisions when establishing any crop. Although complicated by interactions of management and environment, plant density can have a substantial influence on disease risk, weed competition, standability, maturity, and final yield. Recommendations for dry bean seeding under irrigation and wide-row production vary across different growing regions in Western Canada and suggest targets of 95,000 to 100,000 (Alberta Pulse Growers, 2022) and 90,000 to 120,000 (Manitoba Pulse and Soybean Growers, 2022) live plants per acre (ac-1). Research from North Dakota State University (NDSU) aligns with recommendations from Manitoba Pulse and Soybean Growers found that black bean yields were maximized by planting at rates targeting 90,000 to 120,000 live plants ac-1, regardless of row width (NDSU, 2019).
A field-scale demonstration established on a farm field near Riverhurst, SK in 2017 compared narrow-row with wide-row dry bean production practices, included a targeted plant population of 115,000 plants ac-1 for the wide-row system (22 inch spacing). However, because the planter seeding rate was set based on manufacturer manual settings, the actual plant population averaged 142,600 plants ac-1 which was 20% higher than the targeted density. Despite having established an uncharacteristically high plant stand, both yield and net return increased with increasing plant density.
The objective of this Pulse Replicated On-Farm Independent Trial (PROFIT) was to compare the response of irrigated, narrow-row black beans to varying seeding rates. This PROFIT project aimed to examine crop performance of a single cultivar of black bean (CDC Blackstrap) under typical field management practices and to understand the interaction between seeding rate and plant population in narrow-row, irrigated black bean during the 2022 growing season.
Key Findings
- Plant population had a significant positive correlation to dry bean yield
- Decreased interrow spacing did not impact final yield as the increase in plant population was a more important yield factor
- Plant height increased with dry bean plant population
- There was no clear relationship between pod clearance and dry plant population
- Further field investigation is needed to evaluate optimal plant populations and seeding rate recommendations in narrow-row, irrigated black bean
Materials and Methods
Site Description
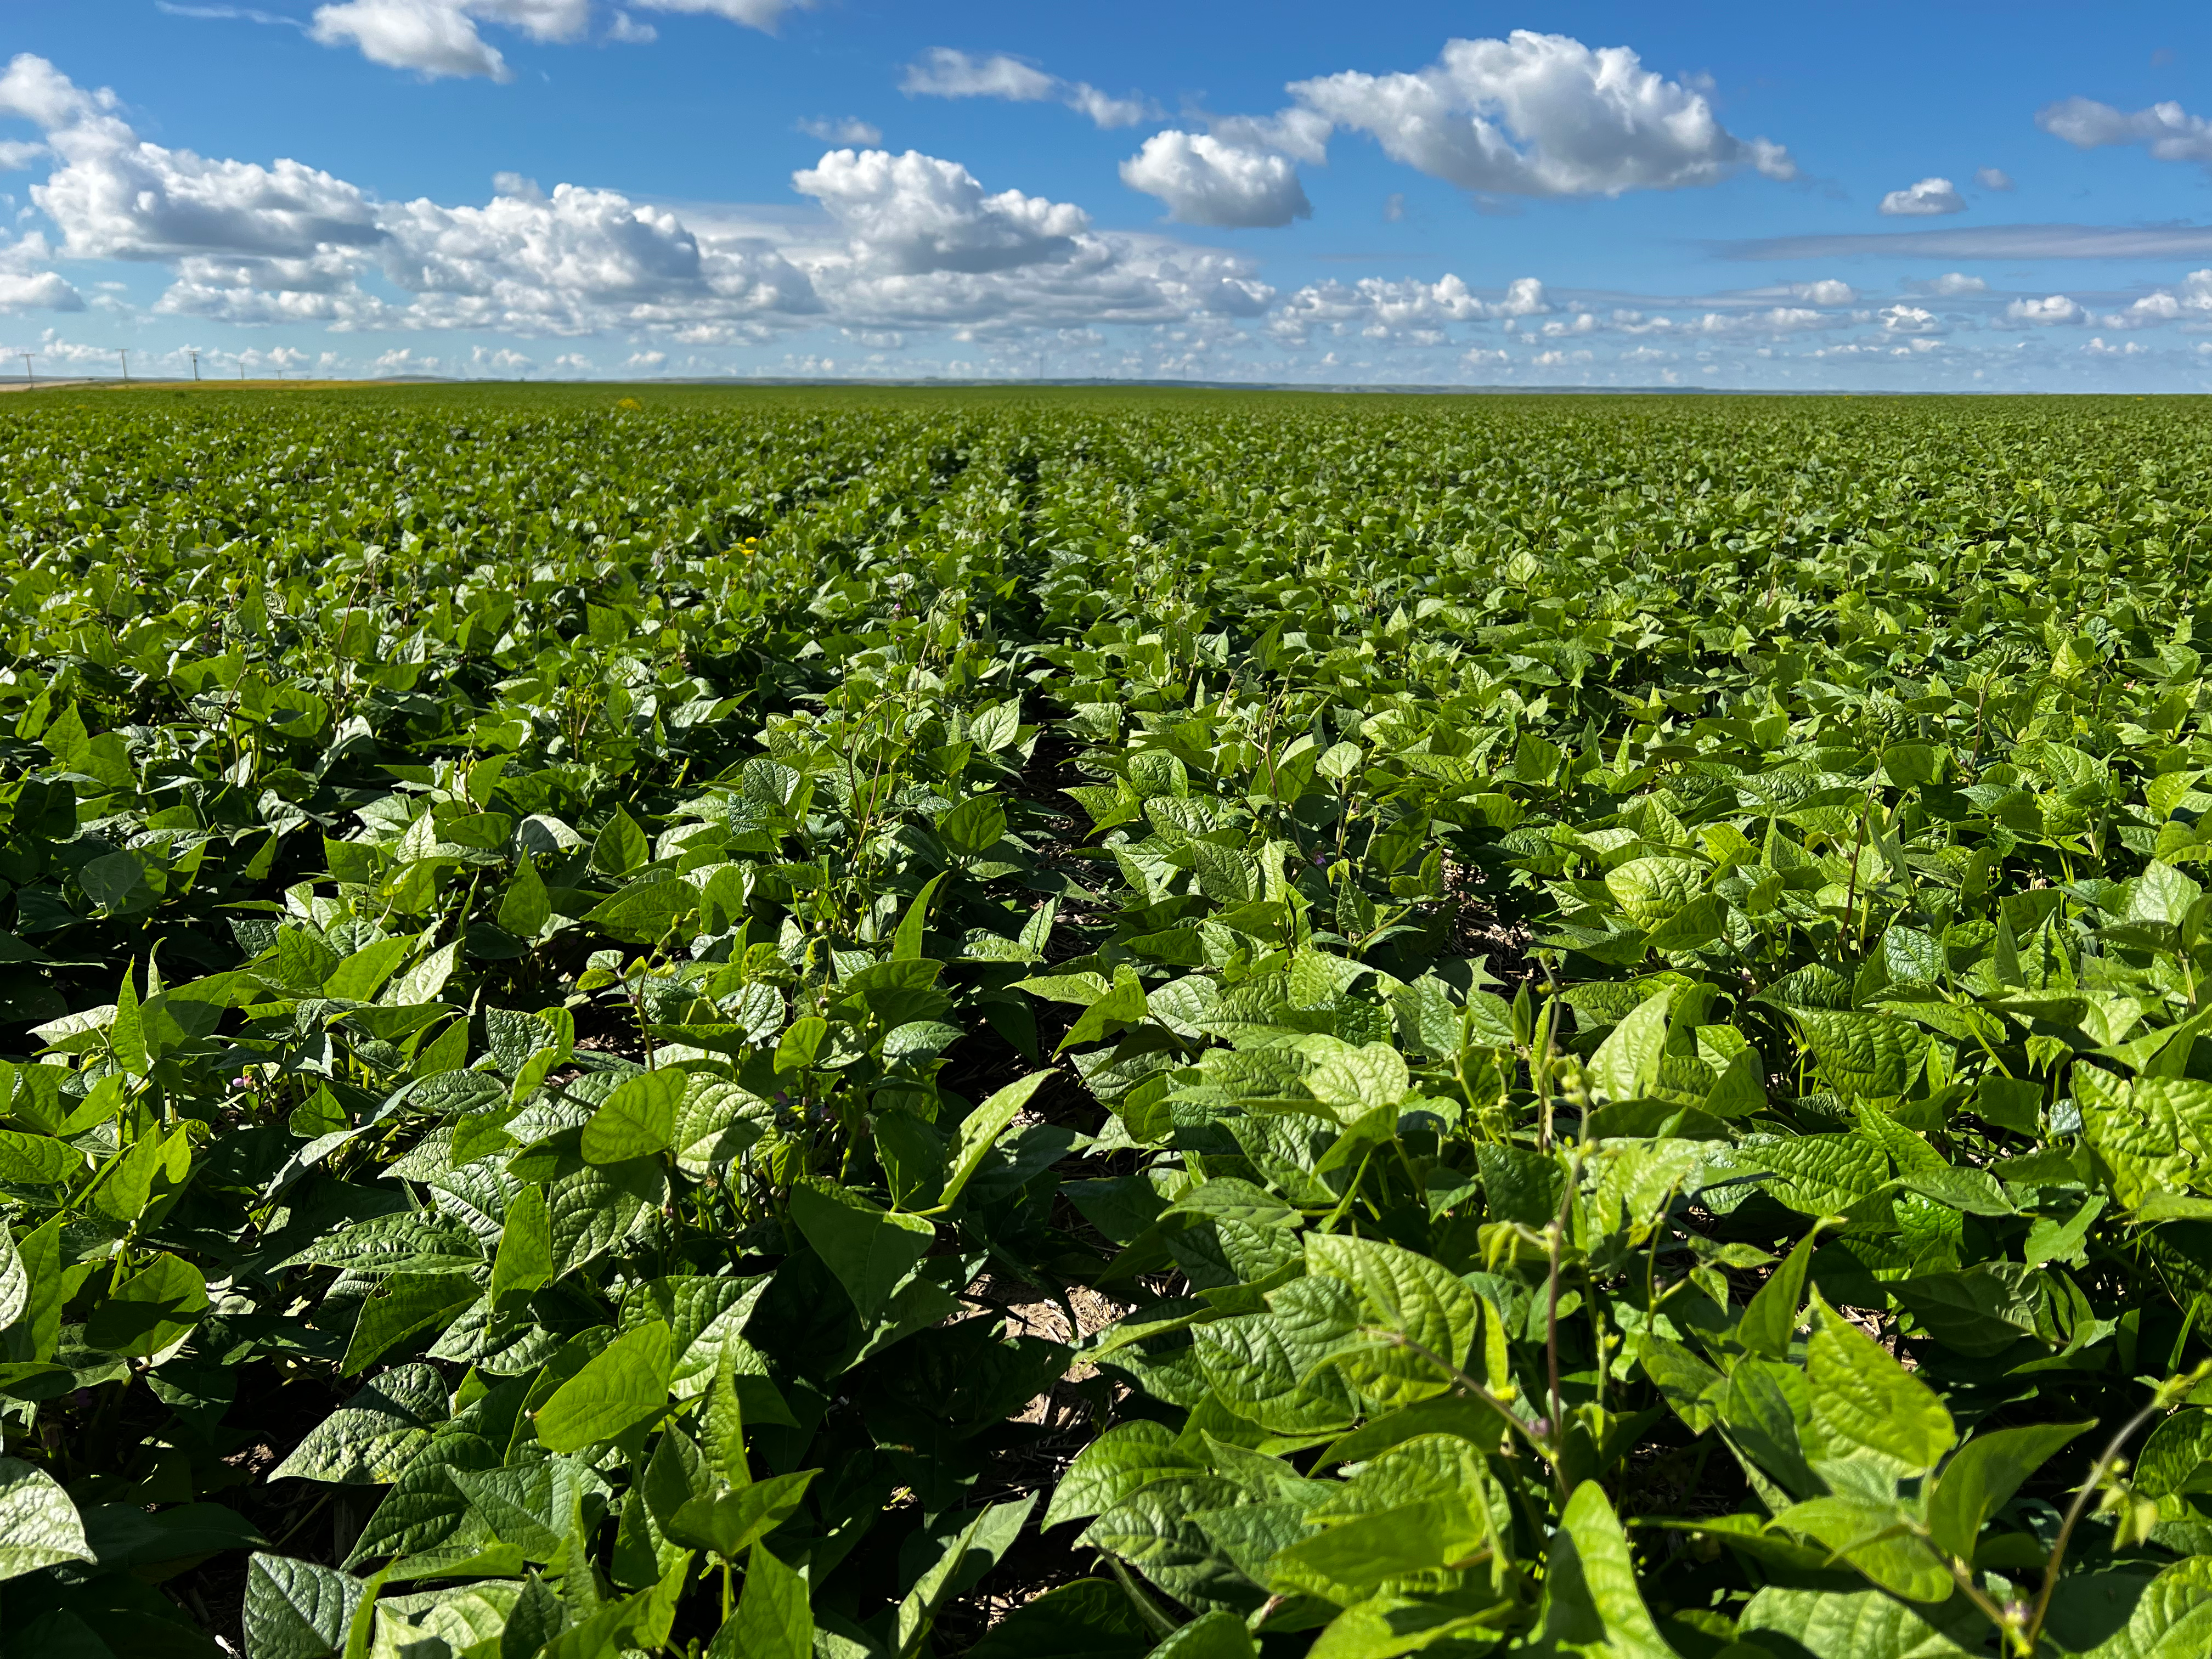
This trial was established in an irrigated farm field using narrow- row (15 inch) spacing near Riverhurst, SK in the RM of Maple Bush, No. 224. The soil at this site was classified as being dominated by Valor Orthic Brown soils, with Haverhill Orthic Brown soils on mid and upper slopes, and Valor Eluviated Brown soils on some lower slopes, with primarily loam surface soil texture (Saskatchewan Soil Information System Working Group, 2018). Rotation and management history at this site demonstrated sound agronomic practices including considerations of crop rotation, previous pest pressure, and herbicide carryover.

Treatment Description and Layout
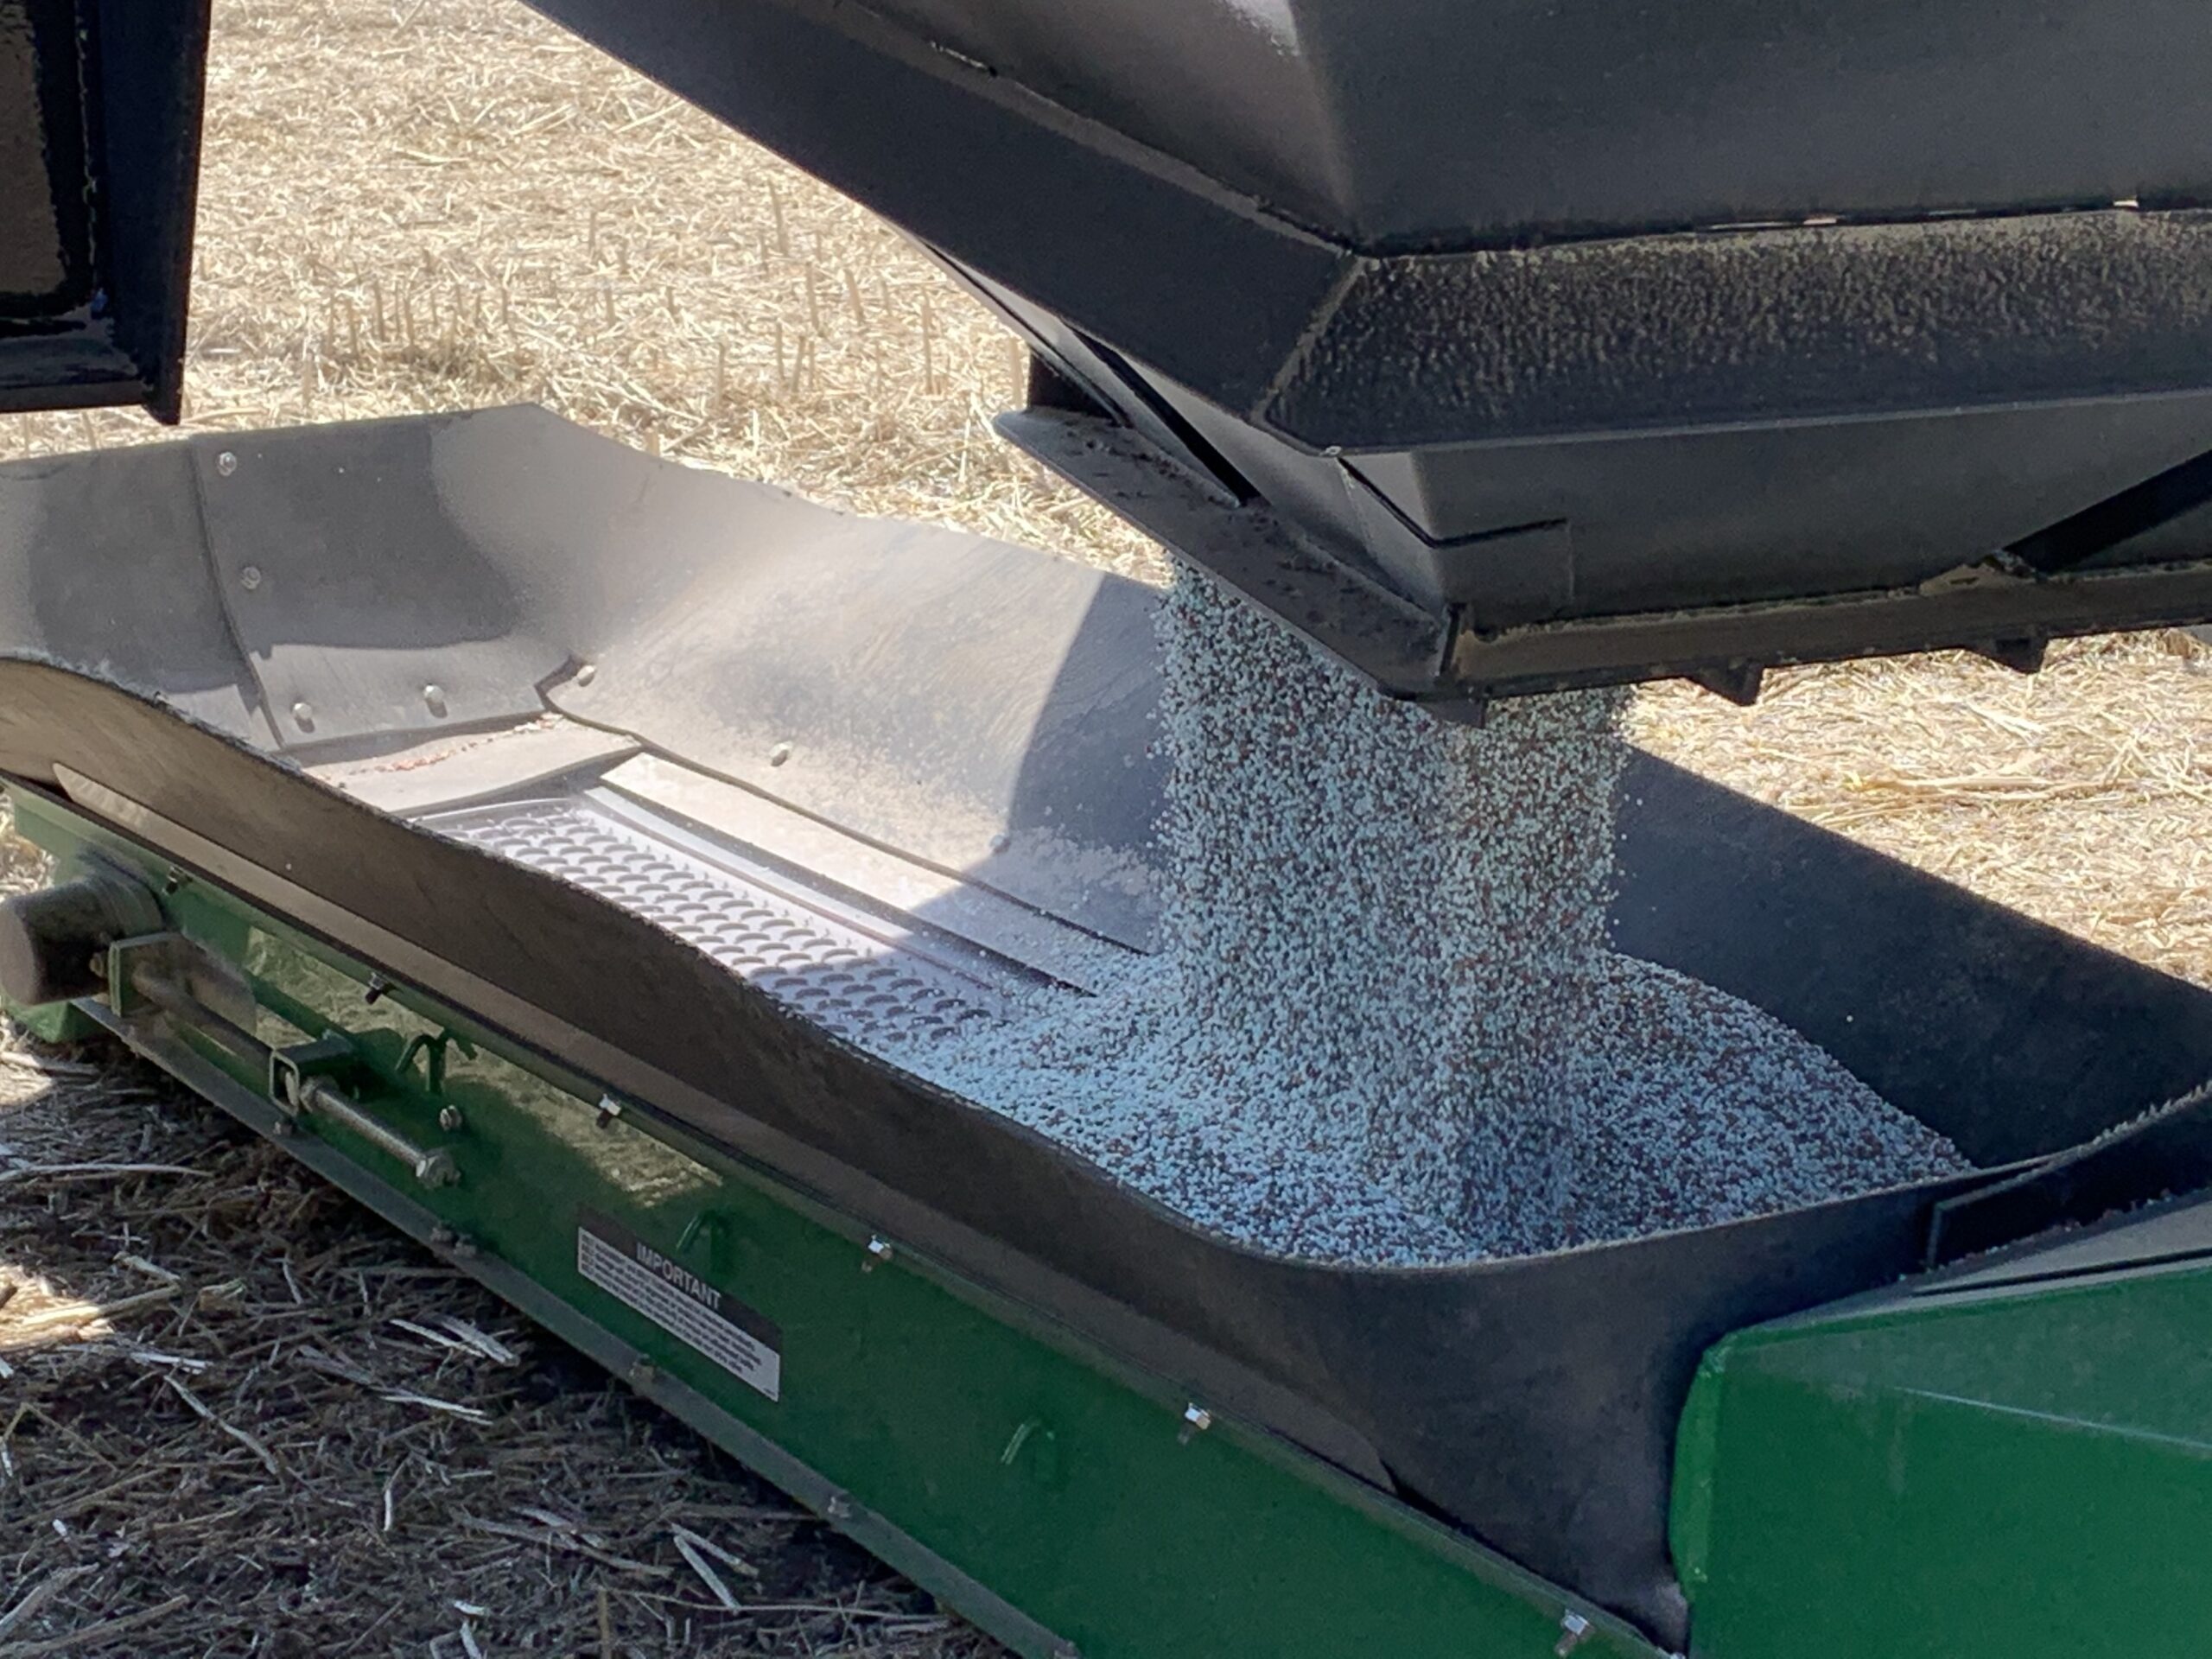
Seed for this trial was sourced from locally-grown certified CDC Blackstrap seed (E3 Ag Ventures) that was harvested in a moisture range estimated at approximately 13% during the 2021 season. Seed analysis indicated that the seed lot had a germination of 91%, 80% vigor, and a thousand kernel weight (TKW) of 231.9 grams. Seeding rate was the only management variable and all other fertility, inoculant, weed, disease, and other pest or harvest management operations were held constant and in accordance with good agronomic practices. Speed and depth of seeding was also consistent across seeding rate treatments. Treatments were seeded on May 23, 2022, and harvested 102 days after seeding on September 2, 2022.
Seeding rates were intended to be based on calculations utilizing TKW, germination, and expected seedling survivability values to target low, medium, and high live plant populations of 90, 120, and 150 thousand live plants ac-1. However, the actual seeding rate calculation erroneously failed to account for germination values or any potential for seedling mortality and instead the target treatments became targets for actual seeds planted opposed to live plants, based on TKW only and 100% survivability.

As such, the low treatments were seeded at 57.5 lbs ac-1, the medium treatments seeded at 76.6 lbs ac-1, and the high treatment at 95.9 lbs ac-1. Although these physical seeding rates were insufficient to achieve their respective targeted live plant population, this scenario still allowed for the opportunity evaluate actual survivability of black beans in the field and back-calculate an expected seed survivability value as well as evaluate the impact of actual plant density on crop growth and yield even if overall plant population was lower across treatments.
This trial was established as a field-scale randomized strip trial with triple replication. Treatment strips were scaled to accommodate the field, equipment, and seeding preferences of the co-operating grower (Figure 2).
Results
Seedling Mortality
Across all seeding rates and replicates, average seedling mortality was 24.8% but ranged from 12.9% to as high as 49.7%. Although there did not appear to be a strong correlation between seedling mortality and seeding rate with similar mean percent mortality at the low (57.5 lbs ac-1) and mid (76.6 lbs ac-1) seeding rates, mortality was elevated at the highest seeding rate (95.9 lbs ac-1).
These data would suggest that, once germination is accounted for, the minimum survivability of this seed lot was 84.2% and decreased to an average of 71.6% under the highest seeding rate. These survivability estimates are generally lower than industry recommendations which suggests a 90–95% survival rate. Reductions in expected survivability during the current site year may be at least partially explained by low seed moisture at the time of the seed lot’s harvest, leaving it more prone to seed coat breakage with each handling step. Furthermore, environmental conditions in the spring of 2022 were relatively cool which led to generally sluggish emergence in the Saskatchewan dry bean crops.
With only a single site year of information, it is premature to make drastic adjustments to dry bean survivability assumptions across an entire farm, but it does merit further investigation. Future field scale investigations of dry bean responses to plant population need to account for seed and seedling mortality to better match the seeding rate to targeted live plant population.
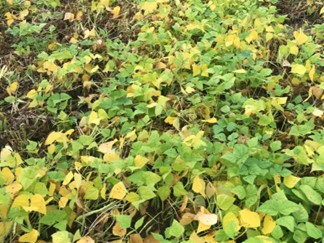
Growth and Development

Neither seeding rate treatment nor final plant population had an apparent effect on crop development or relative maturity, with all treatment replicates developing at the same rate (Figure 3). Although there was a statistically significant positive relationship between dry bean plant height and plant population (P=0.02), plant population had no impact on pod clearance (P=0.51) (values are considered statistically significant when P<0.05). The lowest seeding rate treatment which resulted in a mean final plant population of 72,600 live plants ac-1 had a lower mean pod clearance by a measure of 1.9 cm compared to medium and high seeding rate treatments where the mean final plant populations exceeded 90,000 live plants ac-1; however, these measurements were variable across treatments and replicates.
These data indicate that dry bean biomass can be manipulated by plant population as higher plant densities mean more plants along a row and less interrow spacing which encourages plants to grow taller in pursuit of greater canopy exposure. However, results from this trial indicate that pod clearance remains largely unaffected by plant population, suggesting that pod clearance is influenced by genetics to a greater extent than by agronomic practice.
Interrow spacing ranged from 10.3 cm (4.0 inch) to 16.9 cm (6.6 inch) across all treatments (Table 1). Unsurprisingly, distance between plants along a row had a strong statistical negative correlation to final plant population (P= 0.002, R2=0.32) as more plants filled the space along a row with higher plant populations. At these populations, interrow competition did not appear to be an issue as yield was continuing to increase as interrow space decreased.
Table 1. Summary of interrow spacing, plant height, and pod clearance compared to treatment and final live plant population
| Treatment Description | Treatment Replicate1 | Actual Plant Population | Interrow Spacing | Plant Height | Pod Clearance |
| (plants ac-1) | (cm) | ||||
| Low | 1 | 75,504 | 16.9 | 32.7 | 3.9 |
| 2 | 72,600 | 12.4 | 29.7 | 5.0 | |
| 3 | 69,696 | 16.2 | 32.0 | 4.0 | |
| Mean | 72,600 | 15.2 | 31.4 | 4.3 | |
| Std. Dev | 2904 | 2.4 | 1.6 | 0.6 | |
| Medium | 1 | 95,832 | 11.3 | 26.4 | 6.1 |
| 2 | 95,832 | 12.4 | 44.3 | 5.3 | |
| 3 | 104,544 | 11.0 | 33.6 | 6.7 | |
| Mean | 98,736 | 11.6 | 34.8 | 6.0 | |
| Std. Dev | 5030 | 0.7 | 9.0 | 0.7 | |
| High | 1 | 75,504 | 11.7 | 35.4 | 6.7 |
| 2 | 110,352 | 10.3 | 39.9 | 6.6 | |
| 3 | 95,832 | 11.4 | 38.8 | 6.1 | |
| Mean | 93,896 | 11.1 | 38.0 | 6.5 | |
| Std. Dev | 17,504 | 0.7 | 2.4 | 0.4 | |
1Data is a mean of three measurements within each treatment replication
Yield

Mean dry bean yield across all treatment replicates was 41.4 bu ac-1. Unfortunately, the highest mean plant population that was achieved across any treatment replicate was 110,352 live plants ac-1 which fell below the medium and high target ranges. This limits interpretation of data to a lower range of plant populations and prevents speculation on whether a higher plant target than industry standard (approximately 120,000 plants ac-1) is agronomically or economically advantageous.
However, it is apparent that plant population had a strongly significant and positive relationship to dry bean yield with yield increasing in response to higher plant densities (P=0.04, Figure 4). This linear yield response to plant population does not allow for the conclusion of optimal dry bean plant populations but does suggest that dry bean yield is improved when the number of live plants ac-1 is above 90,000. The lowest yield (36 bu ac-1) was measured in the first replicate of the low treatment and had a final plant population of only 72,600 plants ac-1. In comparison, the highest yield (45 bu ac-1) was achieved in the second highest treatment replicate which had 23,232 additional plants ac-1 for a final mean plant population of 95,832 plants ac-1.
Conclusions
Regional dry bean seeding rate recommendations for black beans grown under Saskatchewan irrigation is an important management consideration. Achieving optimal dry bean plant populations may potentially contributed to black bean yield improvements and help inform agronomic decisions important to sustaining economical dry bean production.
Although results from this field trial are not sufficient to inform an optimal plant stand target or a specific seeding rate recommendation, they do reinforce the general range of minimum plant population targets (90-95,000 live plants ac-1) recommended by Alberta Pulse Growers and Manitoba Pulse and Soybean Growers are reasonable for black bean under narrow-row irrigation conditions in Saskatchewan. As there was a strongly significant positive linear relationship between dry bean plant population and dry bean yield further investigation, under different environmental conditions and seed sources, is warranted to understand the impact of higher plant populations on dry bean yield.
Acknowledgments
Saskatchewan Pulse Growers gratefully acknowledges E3 Ag Ventures for their involvement in PROFIT and their cooperation with this field- scale trial. A special thanks is also extended to Alloy Ag for seeding of this dry bean trial.