By Alexis Adams, MSc, PAg
Introduction
Field peas, which are the most widely grown pulse crop in Saskatchewan, provide soil and rotational benefits and an option for crop diversification. Maximizing yield and reducing costs through efficient fertilizer use is key for growers to grow peas profitably. As well, with increasing global demand for plant protein, grain companies are beginning to offer premiums for high protein peas. Improving pea protein levels will help farmers capture protein premiums and further improve profitability. To better understand how fertilizer impacts pea yield and protein, a study was conducted across several sites in Saskatchewan exploring the yield and protein response of yellow peas to varying nitrogen, phosphorus, and sulfur fertilizer rates and combinations.
Key Messages
- Field peas had a significant yield response to phosphorus application at 73% of sites where soil phosphorus was considered low (below 15 ppm Olsen-P)
- The optimal rate both for yield and economic return was between 35-45 pounds (lb) phosphorus (P2O5) per acre (ac), providing a 13% yield increase over the treatment with 0 lb P2O5/ac at responsive sites
- Phosphorus fertilizer increased protein slightly by 0.4% between 18 lb P2O5/ac and 71 lb P2O5/ac, the lowest and highest phosphorus rates in the research
- Sulfur fertilization had no significant impact on yield or protein when averaged across all locations and years. Sulfur fertilization improved yield at only 1 of 12 site-years, or 8% of the time, and improved protein at only 2 of 12 site-years, or 17% of the time
- Treatments with additional nitrogen as urea or ESN, side banded or floated in crop, had no impact on average yield or protein. At the site level, extra nitrogen increased yield at 1/12 site-years and decreased yield at 3/12 site-years, with no response 75% of the time. A decrease in protein was as likely as an increase in protein with additional nitrogen as protein increased at 17% of site-years and also decreased at 17% of site-years
- Recommendations from this research include the application of 35-45 lb P2O5/ac to maximize yield and economic return in most situations, especially where soil phosphorus is low. A slight improvement in protein levels may be seen from application of phosphorus fertilizer. The application of nitrogen or sulfur fertilizer is only recommended where nitrogen or sulfur deficiency is expected, or nodulation has failed
Research Methodology
Research took place in the 2019 and 2020 growing seasons at Agri-ARM research sites in Swift Current, Outlook, Scott, Indian Head, Yorkton, and Melfort. Thirteen fertilizer treatments were compared in the research to determine pea yield and protein response to five different rates of phosphorus, four different rates of sulfur, and three different nitrogen fertilization strategies (Table 1). In these treatments, the phosphorus source was monoammonium phosphate (MAP; 11-52-0) and the sulfur source was ammonium sulfate (AS; 21-0-0-24). The nitrogen source was urea (46-0-0) in treatments 10 and 11, and polymer coated urea (ESN) in treatments 12 and 13. All fertilizer was side banded at seeding with the exception of treatment 11, where the extra urea was broadcasted in-crop. Treatment 1 was the unfertilized control in which no fertilizer was applied. Treatments 2-6 assessed the impact of phosphorus on pea yield and protein with rates of 0, 18, 36, 53, and 71 lb P2O5/ac or 0, 20, 40, 60, and 80 kilograms (kg) of P2O5 per hectare (ha). In the phosphorus-focused treatments, a flat rate of 9 pounds of sulfur per acre was used, and the nitrogen was only that provided from the MAP and AS. A small amount of supplemental urea nitrogen was added in treatments 2 and 3 to bring the rate up to that of treatment 3 (Table 1). Treatments 4 and 7-9 assessed sulfur response with rates of 0, 4, 9, and 13 lb S/ac (0, 5, 10, and 15 kg S/ ha). For the sulfur treatments, the phosphorus rate was consistently 36 pounds of phosphorus per acre and again applied nitrogen was only that provided from the MAP and AS. Treatment 4 doubled as the 36 lb P/ac and 9 lb S/ac treatment. Treatments 10-12 assessed pea protein and yield response to an additional 36 lb N/ac (40 kg N/ha) with varied placement and timing of that nitrogen. In treatment 10 the additional nitrogen was side banded urea with the MAP and AS, and in treatment 12, the additional nitrogen was in the form of ESN, also side banded. In treatment 11 an additional 36 lb/ac of nitrogen above the nitrogen supplied in the MAP and AS at seeding was broadcasted in-season prior to first flower and canopy closure, around 4-5 weeks after emergence. In the nitrogen response treatments, phosphorus rate was 36 lb/ac and S rate was 9 lb/ ac. Treatment 13 was an ultra-high fertility treatment using the highest rate of nitrogen, phosphorus, and sulfur in the other treatment groups (36 lb N/ac as MAP, AS, and ESN, 71 lb P/ac, and 13 lb S/ac).
Table 1. Field Pea Fertilizer Treatment Descriptions
| Treatment # | Treatment Target | Fertility Rate (lb N-P2O5-K2O-S/ac) | Fertility Rate (kg-N-P2O5-K2O-S/ha) |
|---|---|---|---|
| 1 | No fertilizer | 0-0-0-0 | 0-0-0-0 |
| 2 | P rate 0 lb/ac (0 P) | 15-0-0-9 | 17-0-0-10 |
| 3 | P rate 18 lb/ac (18 P) | 15-18-0-9 | 17-20-0-10 |
| 4 | P rate 36 lb/ac, S rate 9 lb/ac (36 P, 9 S) | 15-36-0-9 | 17-40-0-10 |
| 5 | P rate 53 lb/ac (53 P) | 19-53-0-9 | 21-60-0-10 |
| 6 | P rate 71 lb/ac (71 P) | 23-71-0-9 | 26-80-0-10 |
| 7 | S rate 0 lb/ac (0 S) | 15-36-0-0 | 17-40-0-0 |
| 8 | S rate 4 lb/ac (4 S) | 15-36-0-4 | 17-40-0-5 |
| 9 | S rate 13 lb/ac (13 S) | 20-36-0-13 | 22-40-0-15 |
| 10 | Extra N, 36 lb/ac as MAP/AS/urea at seeding | 36-36-0-9 | 40-40-0-10 |
| 11 | Extra N, 36 lb/ac urea broadcast in crop prior to flowering | 15-36-0-9 (+ 36 N in-crop) | 17.2-40-0-10 (+ 40 N in-crop) |
| 12 | Extra N, 36 lb/ac as MAP/AS/ESN at seeding | 36-36-0-9 | 40-40-0-10 |
| 13 | Ultra-high fertility with N as MAP/AS/ESN | 36-71-0-13 | 40-80-0-15 |
At each location the peas were seeded with a no-till drill into cereal stubble between the second and third week of May. The variety was CDC Spectrum, with a seeding rate target of 9 plants per square foot (ft2) or 100 seeds per metre squared (m2). Crop protection used included a seed treatment, pre- and post- emergent herbicides, and foliar fungicides where disease risk warranted application. Pre-harvest applications varied by site and peas were straight-cut at each site. Yield was adjusted to 16% moisture and corrected for dockage. Seed protein was determined using NIR instruments. Soil tests were collected prior to research to determine soil properties and residual nutrient levels (Table 2).
Table 2. Soil Test Results for 12 Location-Years (Values for NO3-N and S are for 0-60 cm depth unless otherwise indicated. Values for all other attributes are for the 0-15 cm depth)
| Location-Year | pH | S.O.M. (%) | NO3-N (lb/ac) | Olsen-P (ppm) | S (lb/ac) |
|---|---|---|---|---|---|
| Indian Head – 2019 | 7.7 | 4.7 | 24 | 4 | 53 |
| Indian Head – 2020 | 8.0 | 4.1 | 28 | 3 | 30 |
| Melfort – 2019 | 6.0 | 9.6 | 33 Z | 9 | 76 Z |
| Melfort – 2020 | 6.0 | 11.7 | 52 Z | 9 | 38 Z |
| Outlook – 2019 | 8.1 | 2.3 | 19 | 5 | 53 Z |
| Outlook – 2020 | 7.6 | 2.4 | 59 | 24 | >162 Z |
| Scott – 2019 | 5.9 | 3.5 | 42 | 12 | 103 |
| Scott – 2020 | 6.4 | 4.0 | 34 | 12 | 99 |
| Swift Current – 2019 | 6.5 | 2.6 | 180 | 8 | 42 |
| Swift Current – 2020 | 7.3 | 2.9 | 19 Z | 9 | 8 Z |
| Yorkton – 2019 | 7.0 | 6.5 | 39 | 9 | 111 |
| Yorkton – 2020 | 7.7 | 4.3 | 51 | 7 | 30 Z |
Z Values are for the 0-30 cm soil depth for this attribute
Impact of Nitrogen, Phosphorus, and Sulfur on Pea Yield
Across all site-years, yield response to the fertility treatments was highly significant (p≤0.001; Table 3), ranging from 59.7 bushels per acre (bu/ac) (4,016 kg/ha) in the unfertilized control to 67.5 bu/ac (4,539 kg/ha) in the 53 phosphorus treatment (Figure 1). Fertilizer application significantly improved yield by 9%, or 6 bu/ac (378 kg/ha), when comparing the unfertilized control to the combined average of the treatments where fertilizer was applied. These results indicate a pea yield benefit with fertilizer application.
Table 3. Statistics for Yield Averaged Across Site-Years
| Source | Pr > F |
|---|---|
| Fertility (F) | <0.001 |
| Check vs Fertilized | <0.001 |
| Normal vs Extra N | 0.202 |
| P Rate – lin | <0.001 |
| P Rate – quad | 0.004 |
| S Rate – lin | 0.422 |
| S Rate – quad | 0.812 |
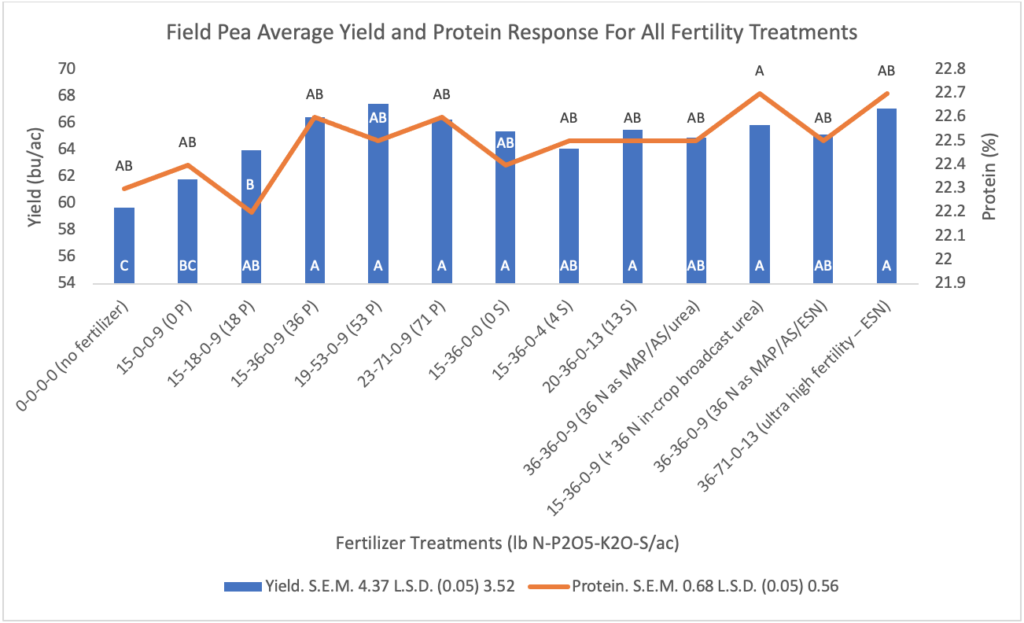
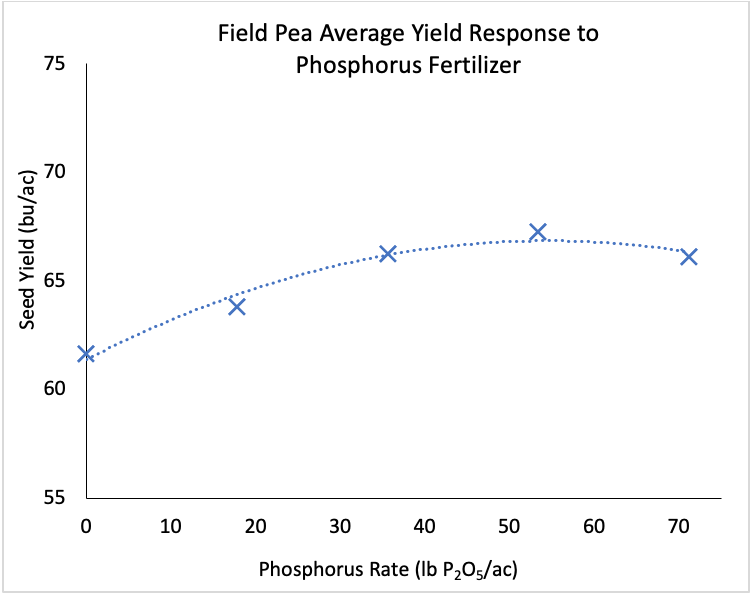
Amongst the phosphorus rate treatments, yields ranged from 61.8 bu/ ac (4,155 kg/ha) in the 0 phosphorus treatment to 67.5 bu/ac (4,536 kg/ha) in the 53 phosphorus treatment. Yield response to phosphorus was quadratic (Figure 2) meaning that yield leveled off between the 36 and 53 treatments, with no added yield benefit beyond around 35-45 lb P2O5/ac (40-50 kg P2O5/ha). Yield benefit at the optimal phosphorus rate provided an average yield increase of 13% or 6 bu/ac over the 0 phosphorus treatment. Initial soil tests showed 9 of 12 sites were very low in soil phosphorus, below 10 parts per million (ppm) Olsen P, and another 2 sites were marginally low (below 15 ppm Olsen P; Table 2). Of the low phosphorus location-years, 7 of 11 had a significant yield response to additional phosphorus, with 8 of 11 having at least a slightly significant response. The results from the phosphorus rate experiments indicate one could expect a yield response to phosphorus in low phosphorus soil (less than 15 ppm Olsen-P) 73% of the time, and that an average 13% yield increase could be achieved with application of about 35-45 lb P/ac.
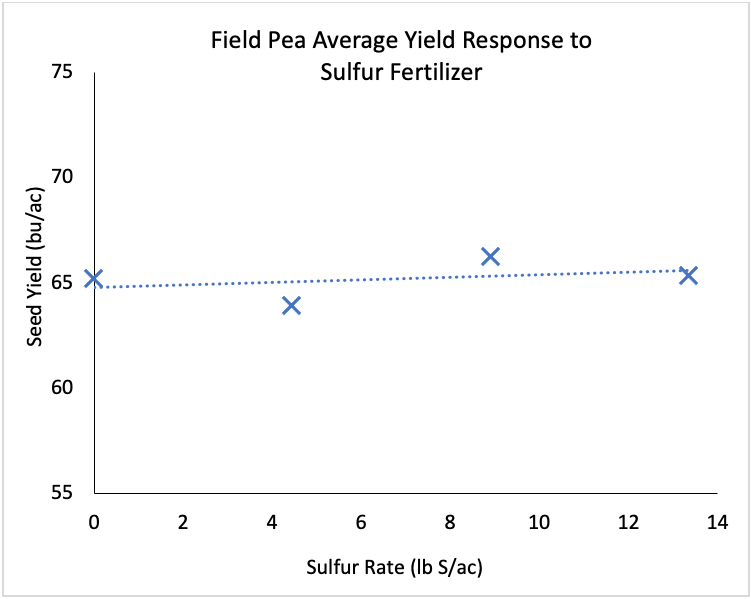
Sulfur application did not impact average pea yield (Figure 3). Soil test results for sulfur varied widely from 8 lb S/ac (Swift Current 2020) to over 162 lb S/ac (Outlook 2020) with a mean of 73 lb S/ac (Table 2). Sulfur deficiency was only expected at Swift Current in 2020, however, no response to sulfur was detected at this site. There was a significant response in only 1 of 12 site-years, Yorkton in 2019, which showed a linear increase of 7 bu/ac or 9% from the 0-13 sulfur treatment. Despite the observed response, soil sulfur was high at Yorkton in 2019 at 111 ppm. Other research has also found that pea yield did not commonly respond to sulfur and has found little connection between yield response and soil sulfur levels. Sulfur is a difficult nutrient to test for as soil sulfur content can often vary widely across a field. Sampling from one sulfur hotspot can spike a whole composite sample, making the field appear to be high in sulfur overall. From these results, there is a 1/12 or 8% chance of seeing a yield response in peas from sulfur application, and soil test results will not be a likely predictor of response.
Average yield for the additional nitrogen treatments (treatments 10-12) were not significantly different from the comparison treatment (same levels of phosphorus and sulfur) without added nitrogen (treatment 4). Average yield for the additional nitrogen treatments was 65.3 bu/ ac (4,393 kg/ha) and yield for the comparison treatment was 66.4 bu/ac (4,468 kg/ha). Looking at specific locations, 8 of 12 site-years showed no yield response to the extra nitrogen and 3 of 12 site-years showed a significant negative response (Indian Head 2019, -2.5 bu/ac (170 kg/ ha), Outlook 2020, -3.0 bu/ac (202 kg/ha), and Scott 2019, -4.5 bu/ac (303 kg/ha)). Only 1 of 12 sites responded positively to extra nitrogen (Swift Current 2020, 3.4 bu/ac (229 kg/ha)). Soil test levels of nitrate nitrogen (NO3-N) was not a solid indicator of pea yield response to additional nitrogen. From these results one could expect a 67% chance of no yield response to additional nitrogen, a 25% chance of a negative yield response, and only an 8% chance of a positive yield response.
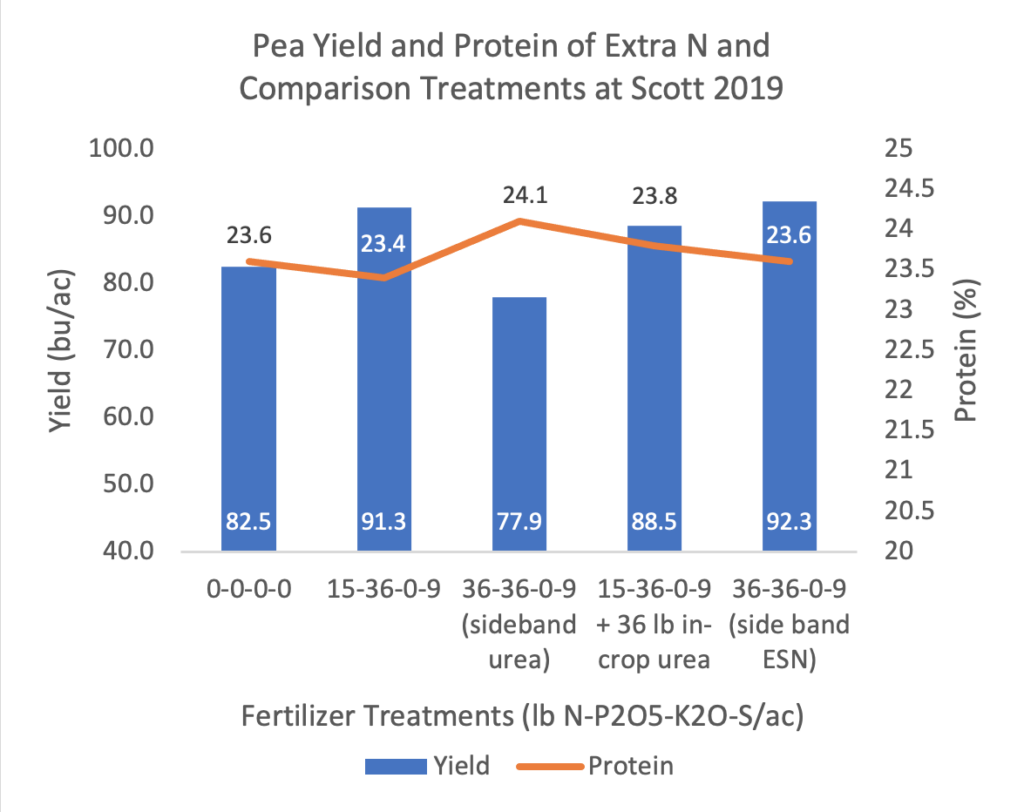
There was no yield difference between the nitrogen fertilization strategies (treatments 10-12) at most site-years. An interesting story emerged, however, at Scott in 2019, where average yield with extra nitrogen was reduced by -4.5 bu/ac, compared to no extra nitrogen (treatment 4). When individual nitrogen treatments were evaluated, the yield was most dramatically reduced in the treatment with additional side banded urea (treatment 10) but not in the broadcast and side band ESN treatments (treatments 11 and 12) (Figure 4). The difference between these treatments is the timing of nitrogen availability. The side banded urea provides nitrogen to the plant immediately, whereas side banded ESN releases nitrogen more gradually throughout the growing season. In-crop broadcast urea does not provide nitrogen until the plant is moving into the reproductive stage. Immediate availability of extra nitrogen had a significant negative impact on yield at Scott in 2019 perhaps impeding nodulation and limiting yield. While not observed at all site-years, results from Scott in 2019 indicate that nitrogen available at seeding may inhibit yield development more than nitrogen available further into the growing season.
Impact of Nitrogen, Phosphorus, and Sulfur on Pea Protein
Differences in protein between the 13 treatments were statistically significant (p≤0.047) (Table 4) but the range between the treatments with the highest and lowest protein levels was only 0.5% (Figure 1). Treatment 11, which had extra nitrogen floated in-crop was numerically highest in protein (22.7%) and treatment 3, which had the lowest rate of phosphorus (18 P) had the numerically lowest protein (22.2%). These two treatments were the only treatments that were significantly different from each other. These results indicate that fertilizer may have a small impact on pea protein levels.
Table 4. Statistics for Protein Averaged Across Site-Years
| Source | Pr > F |
|---|---|
| Fertility (F) | 0.047 |
| Check vs Fertilized | 0.065 |
| Normal vs Extra N | 0.959 |
| P Rate – lin | 0.033 |
| P Rate – quad | 0.731 |
| S Rate – lin | 0.549 |
| S Rate – quad | 0.259 |
Fertilizer application as a whole did not improve protein development as there was no significant difference in protein between the unfertilized control (22.3%) and the average of the fertilized treatments (22.5%). At the site level, there was a significant increase in protein between fertilized and unfertilized at 2 of 12 sites, by 0.5 to 0.8% and a 0.4% decrease in protein with fertilizer application at 1 of 12 sites. In this research, protein was not changed with fertilizer application 75% of the time, and a decrease in protein was almost as likely as an increase. Any improvement with fertilizer was under 1%, which may not be enough to secure a high protein premium.
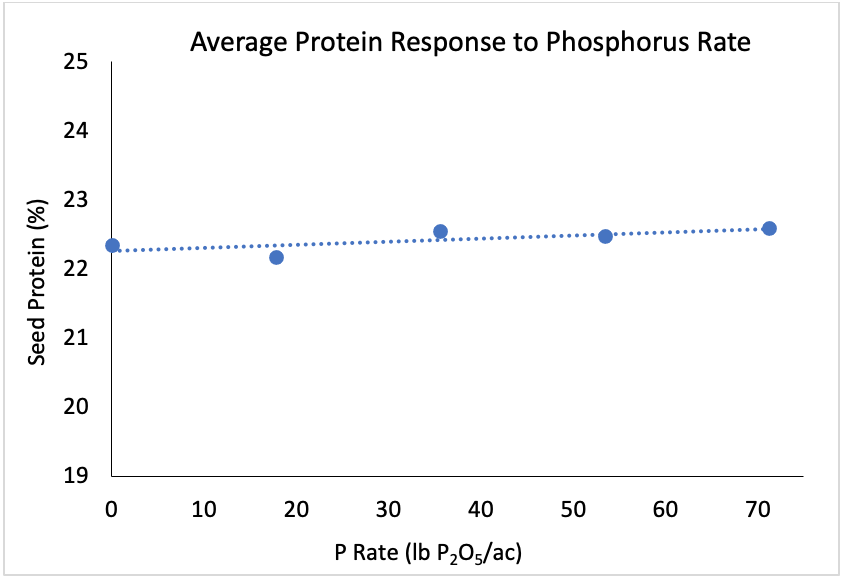
Protein increased with an increased phosphorus rate from 22.2% in the 18 phosphorus treatment, to 22.6% in the 71 phosphorus treatment (Figure 5). This linear relationship was slight and could be due to improved root and plant health from the added phosphorus, as yield also increased with increased rate. At the site level, 3 of 12 location-years had a significant protein response to phosphorus. At Outlook in 2019, protein was lowest in the 36 lb P2O5/ac treatment (19.3%) and highest in the 71 lb P2O5/ac treatment (22.1%). Contrary to Outlook, at Yorkton in 2020 protein was highest in the 36 lb P2O5/ac treatment (17.5%) and lowest in the 71 lb P2O5/ac treatment (16.5%). The Swift Current site showed a linear response to phosphorus in 2019, increasing from 24.1% to 25.1% from the 0-71 phosphorus treatment. Based on the results, increased phosphorus rate should lead to slightly increased protein levels. Because protein increase from phosphorus is slight, however, applying fertilizer rates above 35-45 lb P/ac, the yield optimizing rate in this research, would not be profitable.
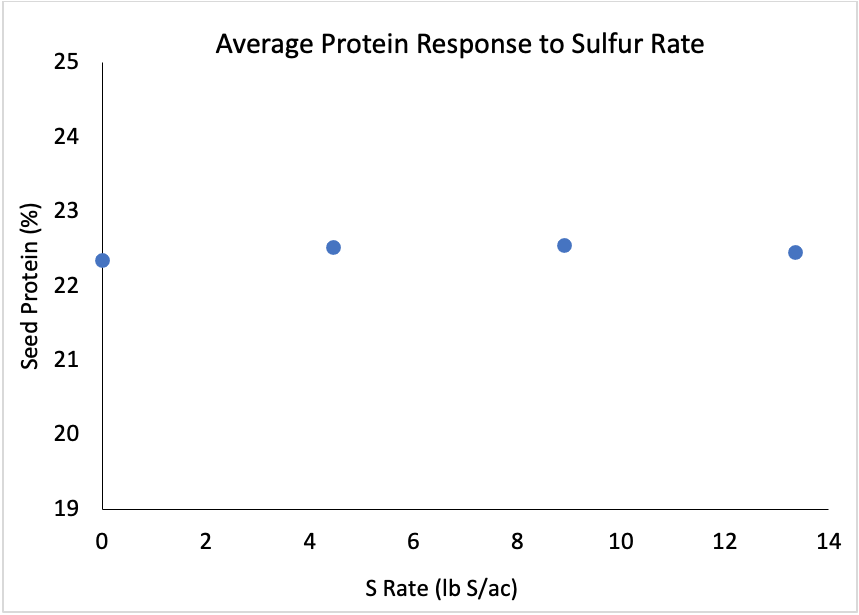
There was no difference in protein for the different sulfur treatments averaged across site-years (Figure 6). Protein responded to sulfur fertilization at 3 of 12 site years. At Indian Head in 2020, protein increased linearly by 1.1% from the 0-13 sulfur treatments. At Scott 2019, protein responded quadratically to sulfur but only with a 0.2% difference in protein among treatments (23.8% at 0 and 13 sulfur and 23.6% with 4 sulfur). At Swift Current in 2020, protein increased by 0.8% from the 0-13 sulfur treatments. Swift Current in 2020 was the only site low in soil sulfur (8 lb/ac), which may explain the protein response, however, there was no significant yield response to sulfur. Sulfur fertilization is not a solid strategy for protein improvement in peas based on this research, as the chance of improving pea protein levels by 0.8% to 1.1 % with sulfur application at up to 13 lb S/ac is only 17%.
The treatments with additional nitrogen did not significantly increase average pea protein levels across all site-years in comparison to the treatments receiving normal nitrogen. When comparing all 13 treatments, however, treatment 11 (in-crop broadcast nitrogen) was numerically highest in protein, indicating a potential benefit of later season availability of nitrogen. There was no protein response at 8 of 12 site years, with 2 of 12 responding positively (Melfort 2020, increase of 0.6%; Scott 2019, increase of 0.4%) and 2 of 12 responding negatively (Scott 2020, decrease of 0.4%; Yorkton 2019, decrease of 1.0%) to the extra nitrogen treatments. The only site-year where both yield and protein were impacted by the extra nitrogen treatments was Scott in 2019 (Figure 4). At this site-year, the treatment with the highest protein was the treatment with urea side banded at seeding. This treatment was also the lowest yielding thus, the high protein levels may have been a concentration effect due to lower plant production. In the research, pea protein levels responded to additional nitrogen only 33% of the time, with as great a chance of a drop in protein as an increase. Additional nitrogen is unlikely to produce a positive protein response in field peas, however, of all the extra nitrogen treatments, broadcasting nitrogen in-crop showed the greatest potential for improving pea protein.
Economic Analysis of Phosphorus Fertilizer
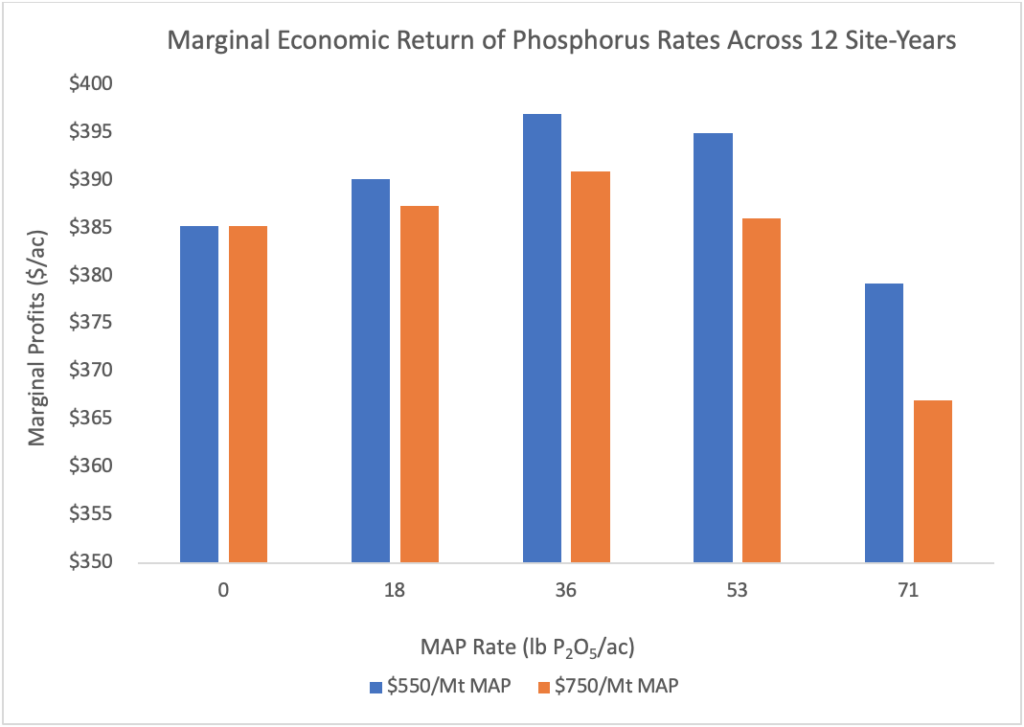
Marginal economic returns were calculated for phosphorus application, using $6.25/bu as the price for yellow peas and $550 per tonne (T) and $750/T as prices for the MAP fertilizer (Figure 7). The 36 phosphorus treatment was the most economical phosphorus rate when averaged across all locations for both fertilizer prices. Broken down by location, the most economical rate ranged between 0-53 lb P2O5/ac. At 3 of 6 locations, 18 lb P2O5/ac was the most profitable rate. Fertilizer price did not change the most profitable fertilizer rate at any of the sites except Melfort, which had the greatest yield variability and did not have a statistical yield response to phosphorus application. These results indicate that farmers will likely not see a financial benefit of fertilizer rates higher than 36 lb P/ac, regardless of fertilizer prices, due to the cost of fertilizer and marginal yield benefit from that fertilizer application.
Discussion
Developing strategies to improve yield and protein in field peas will allow farmers to improve profitability and continue growing peas, while increasing crop diversification and benefitting soil health and subsequent crops in the rotation. This research explored the potential for nitrogen, phosphorus, and sulfur to improve pea yield and protein and found that addition of phosphorus fertilizer to be the best strategy. Application of up to 13 lb S/ac only improved yield 8% of the time and protein 17% of the time. Extra nitrogen only elicited a yield or protein response 33% of the time, with as much likelihood of a decrease as an increase for both yield and protein. Of the extra nitrogen treatments, the in-crop broadcast treatment showed the greatest potential for increasing protein. Phosphorus application was the only fertility treatment that impacted yield or protein significantly in the research. At the sites with low phosphorus soils (less than 15 ppm Olsen-P), yield increased 73% of the time, by 13% on average, with the greatest yield response at 35-45 lb P/ac. The phosphorus rate with the greatest economic return was the 36 phosphorus rate. As well, phosphorus rate also increased protein, although only by 0.4% from the 18 to the 71 phosphorus rates. From this research, nitrogen and sulfur appeared to have little impact on protein or yield. The application of phosphorus fertilizer at 35-45 lb/ac, however, improved yield and maximized economic return. Protein development was more difficult to increase through fertility management, however, as with yield, phosphorus seemed to have the greatest impact.
From these findings, along with previous research findings, the main recommendation for optimizing yield and protein in Saskatchewan field peas through fertility management is the application of 35-45 lb P2O5/ ac (40-50 kg P2O5/ha). This rate of phosphorus provides the greatest likelihood of optimizing yield response on low phosphorus soils and a potential improvement in protein levels. Higher rates of phosphorus may provide a benefit where a grower is aiming to build soil phosphorus over the long-term or where yields greater than 50 bu/ac (3,500 kg/ ha) are often attained. Lower rates of phosphorus will likely be adequate where soil phosphorus levels are already high (above 20 ppm Olsen-P). Application of sulfur is unlikely to impact pea yield or protein, however where crops have exhibited sulfur deficiency, a small amount of sulfur may provide a yield or protein benefit. Application of nitrogen above that provided in phosphorus and/or sulfur fertilizers is unlikely to provide a yield or protein benefit, regardless of timing and placement, under normal circumstances. Extra nitrogen may provide a benefit where soil nitrogen is extremely low and phosphorus or sulfur is not being applied, or where nodulation has failed.
Acknowledgements
This project was funded solely by Saskatchewan Pulse Growers. Each Agri-ARM site also receives base funding provided through the Canadian Agricultural Partnership bi-lateral agreement between the federal government and the Saskatchewan Ministry of Agriculture. We also acknowledge the strong working relationships between Agriculture and Agri-Food Canada and the following collaborating organizations: Indian Head Agriculture Research Foundation, Wheatland Conservation Area, Irrigation Crop Diversification Corporation, Northeast Agriculture Research Foundation, and Western Applied Research Corporation. Thanks also goes to those that provided crop protection products in kind.
