By Chuck Penner, LeftField Commodity Research
February 2026
Canadian pulse markets have faced a number of headwinds in recent months. Trade issues have hindered export movement at the same time as Canadian farmers produced the biggest pulse crop in ten years. Roadblocks to trade were the last thing the markets needed in 2025/26.
Both China and India imposed tariffs on Canadian peas in 2025, with the 100% Chinese tariffs in March causing much larger problems than the 30% Indian tariffs in November. Besides the obvious difference in size, China’s tariffs were targeted solely at Canada which allowed other countries, mainly Russia, to continue supplying China and take Canadian market share. Meanwhile, Indian tariffs applied to peas from all countries, meaning that at least Canada was not at a competitive disadvantage.
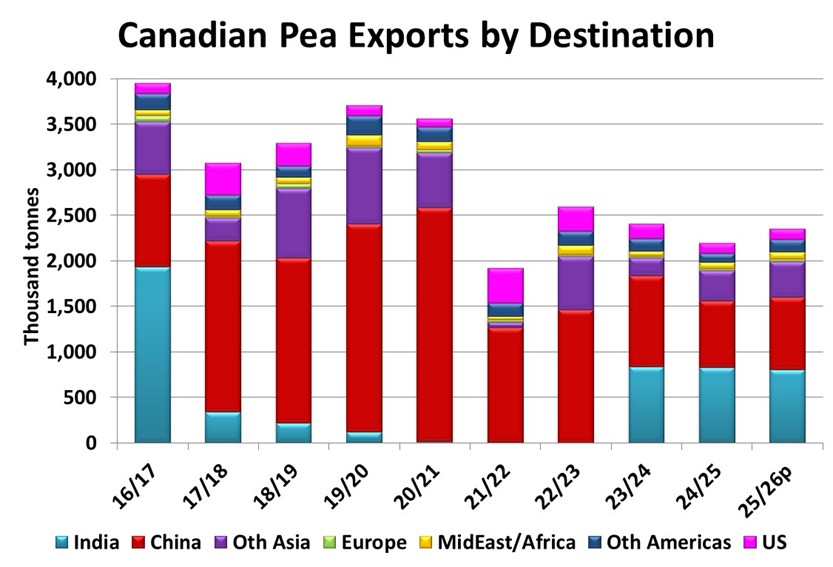
Even though China’s tariffs did not shut out Canadian peas entirely, the volume of trade dropped roughly two-thirds, which is especially a problem during the heavy shipping season right after harvest. This impact was even greater for green and maple peas, which depend more heavily on Chinese demand, but yellow pea movement was also curtailed, which limited the post-harvest price recovery.
The big question is how the market will respond now that China is dropping its tariffs on peas. There has already been a price reaction, most noticeably for maple peas, with smaller gains in yellow and green peas but the longer-term response depends on China’s purchases over the next few months.
Despite the tariffs, small amounts of Canadian peas, somewhere in the neighbourhood of 200,000 tonnes, have been exported to China so far in 2025/26. Once the tariffs drop at the beginning of March, shipping two vessels (120,000 tonnes) per month is a reasonable forecast, which would mean another 600,000 tonnes by the end of 2025/26. The 800,000 tonnes of exports to China and a similar amount to India along with increased volumes to other Asian destinations will allow a small increase in 2025/26 exports.
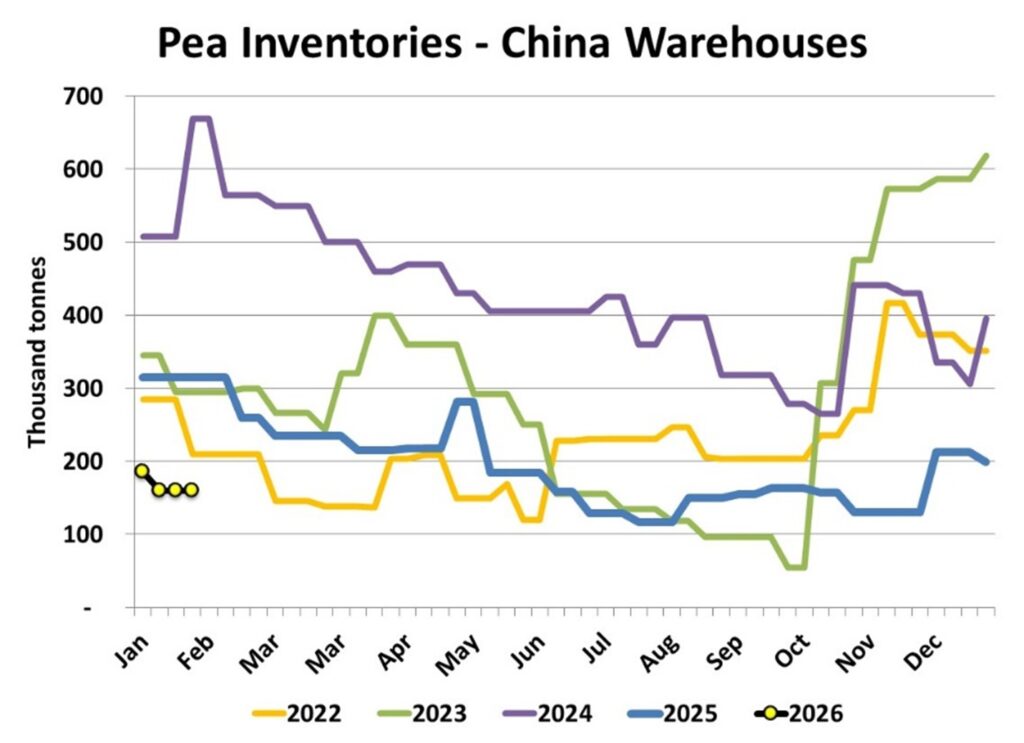
It is also possible that China could boost its imports of Canadian peas above the “reasonable forecast” mentioned above. Pea inventories reported at Chinese port warehouses in early 2026 are at multi-year lows and if buyers there decide to rebuild stocks to more typical levels using Canadian peas, import volumes would need to pick up even more in the coming months.
While increased exports to China will be positive and have already provided some price support, they will not be enough to restore balance in the Canadian pea market in just a few short months. Canadian pea supplies in 2025/26 are 1.1 million tonnes larger than last year and this projected increase in exports will not match the boost in supplies. As a result, the issue of heavy Canadian pea stocks will not be resolved by the end of 2025/26 and will continue to limit the upside potential for prices into 2026/27. The good news is that the return of China as a buyer provides some light at the end of the tunnel, even if it is a little ways off.
One of the silver linings in the Indian pea market was that its 30% import tariff caused a bump in pea prices there, rather than forcing prices lower in Canada and other exporting countries. More recently, even with steady imports from Canada and Russia, Indian prices for yellow peas are continuing to firm up which reduces the odds that India will raise tariffs further. Even so, the tariff likely put a damper on Indian import volumes, the opposite of what is needed in a heavily-supplied market.
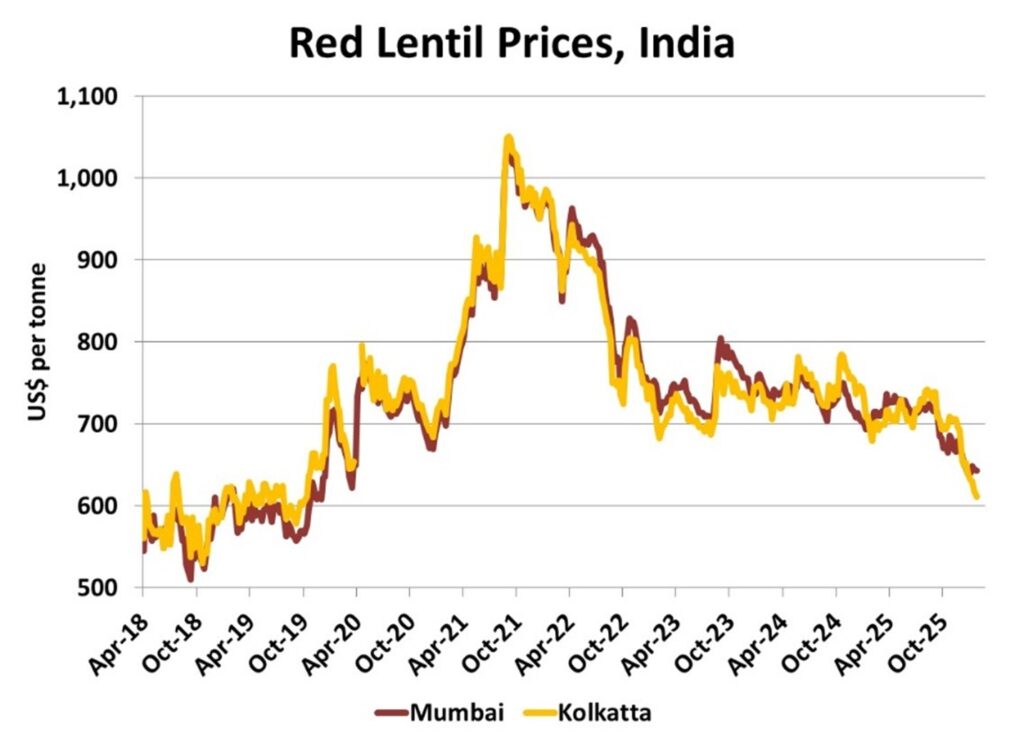
Canadian lentil exports have been flowing freely so far in 2025/26, despite a 10% Indian import tariff. The heavy movement of Canadian (and Australian) red lentils into India is raising concerns though that its import tariff could be raised. Red lentil prices in India had been stuck in a sideways pattern for the last three years but have been dropping sharply since mid-September and are now the lowest since 2019/20. The goal of India’s import tariff on peas had been to raise prices for its farmers and the drop in lentil prices could convince the Indian government to use the same approach with lentils.
Even if this cloud on the lentil horizon becomes reality, it may not have a large impact on trade volumes, but that outlook largely depends on the size of the tariff. For peas, the 30% tariff caused Indian prices to rise but imports continued to flow while Canadian prices remained steady. If India adopts a similar 30% tariff on lentil imports the impact could be similar, with Canadian lentils continuing to move to India with prices less affected.
The continued flow of Canadian lentils into India is very important for the 2025/26 outlook and beyond. Canadian lentil supplies in 2025/26 are over 4 million tonnes, which is 1.25 million more than last year and even with a strong export year, ending stocks will be very large. That is especially the case for green lentils with extremely burdensome supplies.
The Indian market is a critical piece of the demand outlook for green lentils, as it can provide an outlet for meaningful amounts of green lentils as a substitute for tur (pigeon peas). Recently, Indian tur prices have been rising and are now higher than green lentils, which could trigger more demand for green lentil imports. If so, this would be good news but would still take time to solve the oversupply issue for green lentils.
As always, pulse markets are dynamic with a certain degree of unpredictability, especially when governments decide to intervene. Farmers’ marketing plans need to be flexible and be able to adjust to quick shifts in trade policy. These events also reinforce the importance of market development and advocacy efforts by grower associations like SPG.
Chuck Penner operates LeftField Commodity Research out of Winnipeg, MB. He can be reached at info@leftfieldcr.com.