Welcome to the Saskatchewan Environmental Heatmaps, developed through a partnership between Saskatchewan Pulse Growers and Ukko Agro Inc.
These maps provide weather-based insights to support producers and agronomists across Saskatchewan, with a focus on forecasted key environmental and climate conditions. Using data from a 20 km grid of virtual weather stations with hourly inputs (sourced from IBM/The Weather Company), the system generates regularly updated maps that evaluate how recent and forecasted weather conditions influence environmental risk factors.
Environmental and climate heatmaps are provided in parallel to support broader agronomic decisions and general crop management under variable weather conditions.
Due to pulse crops maturing and pre-harvest interval restrictions, the window for fungicide application is generally past. Maps will focus only on climate for the remainder of the season.
Click each image to view full-screen.
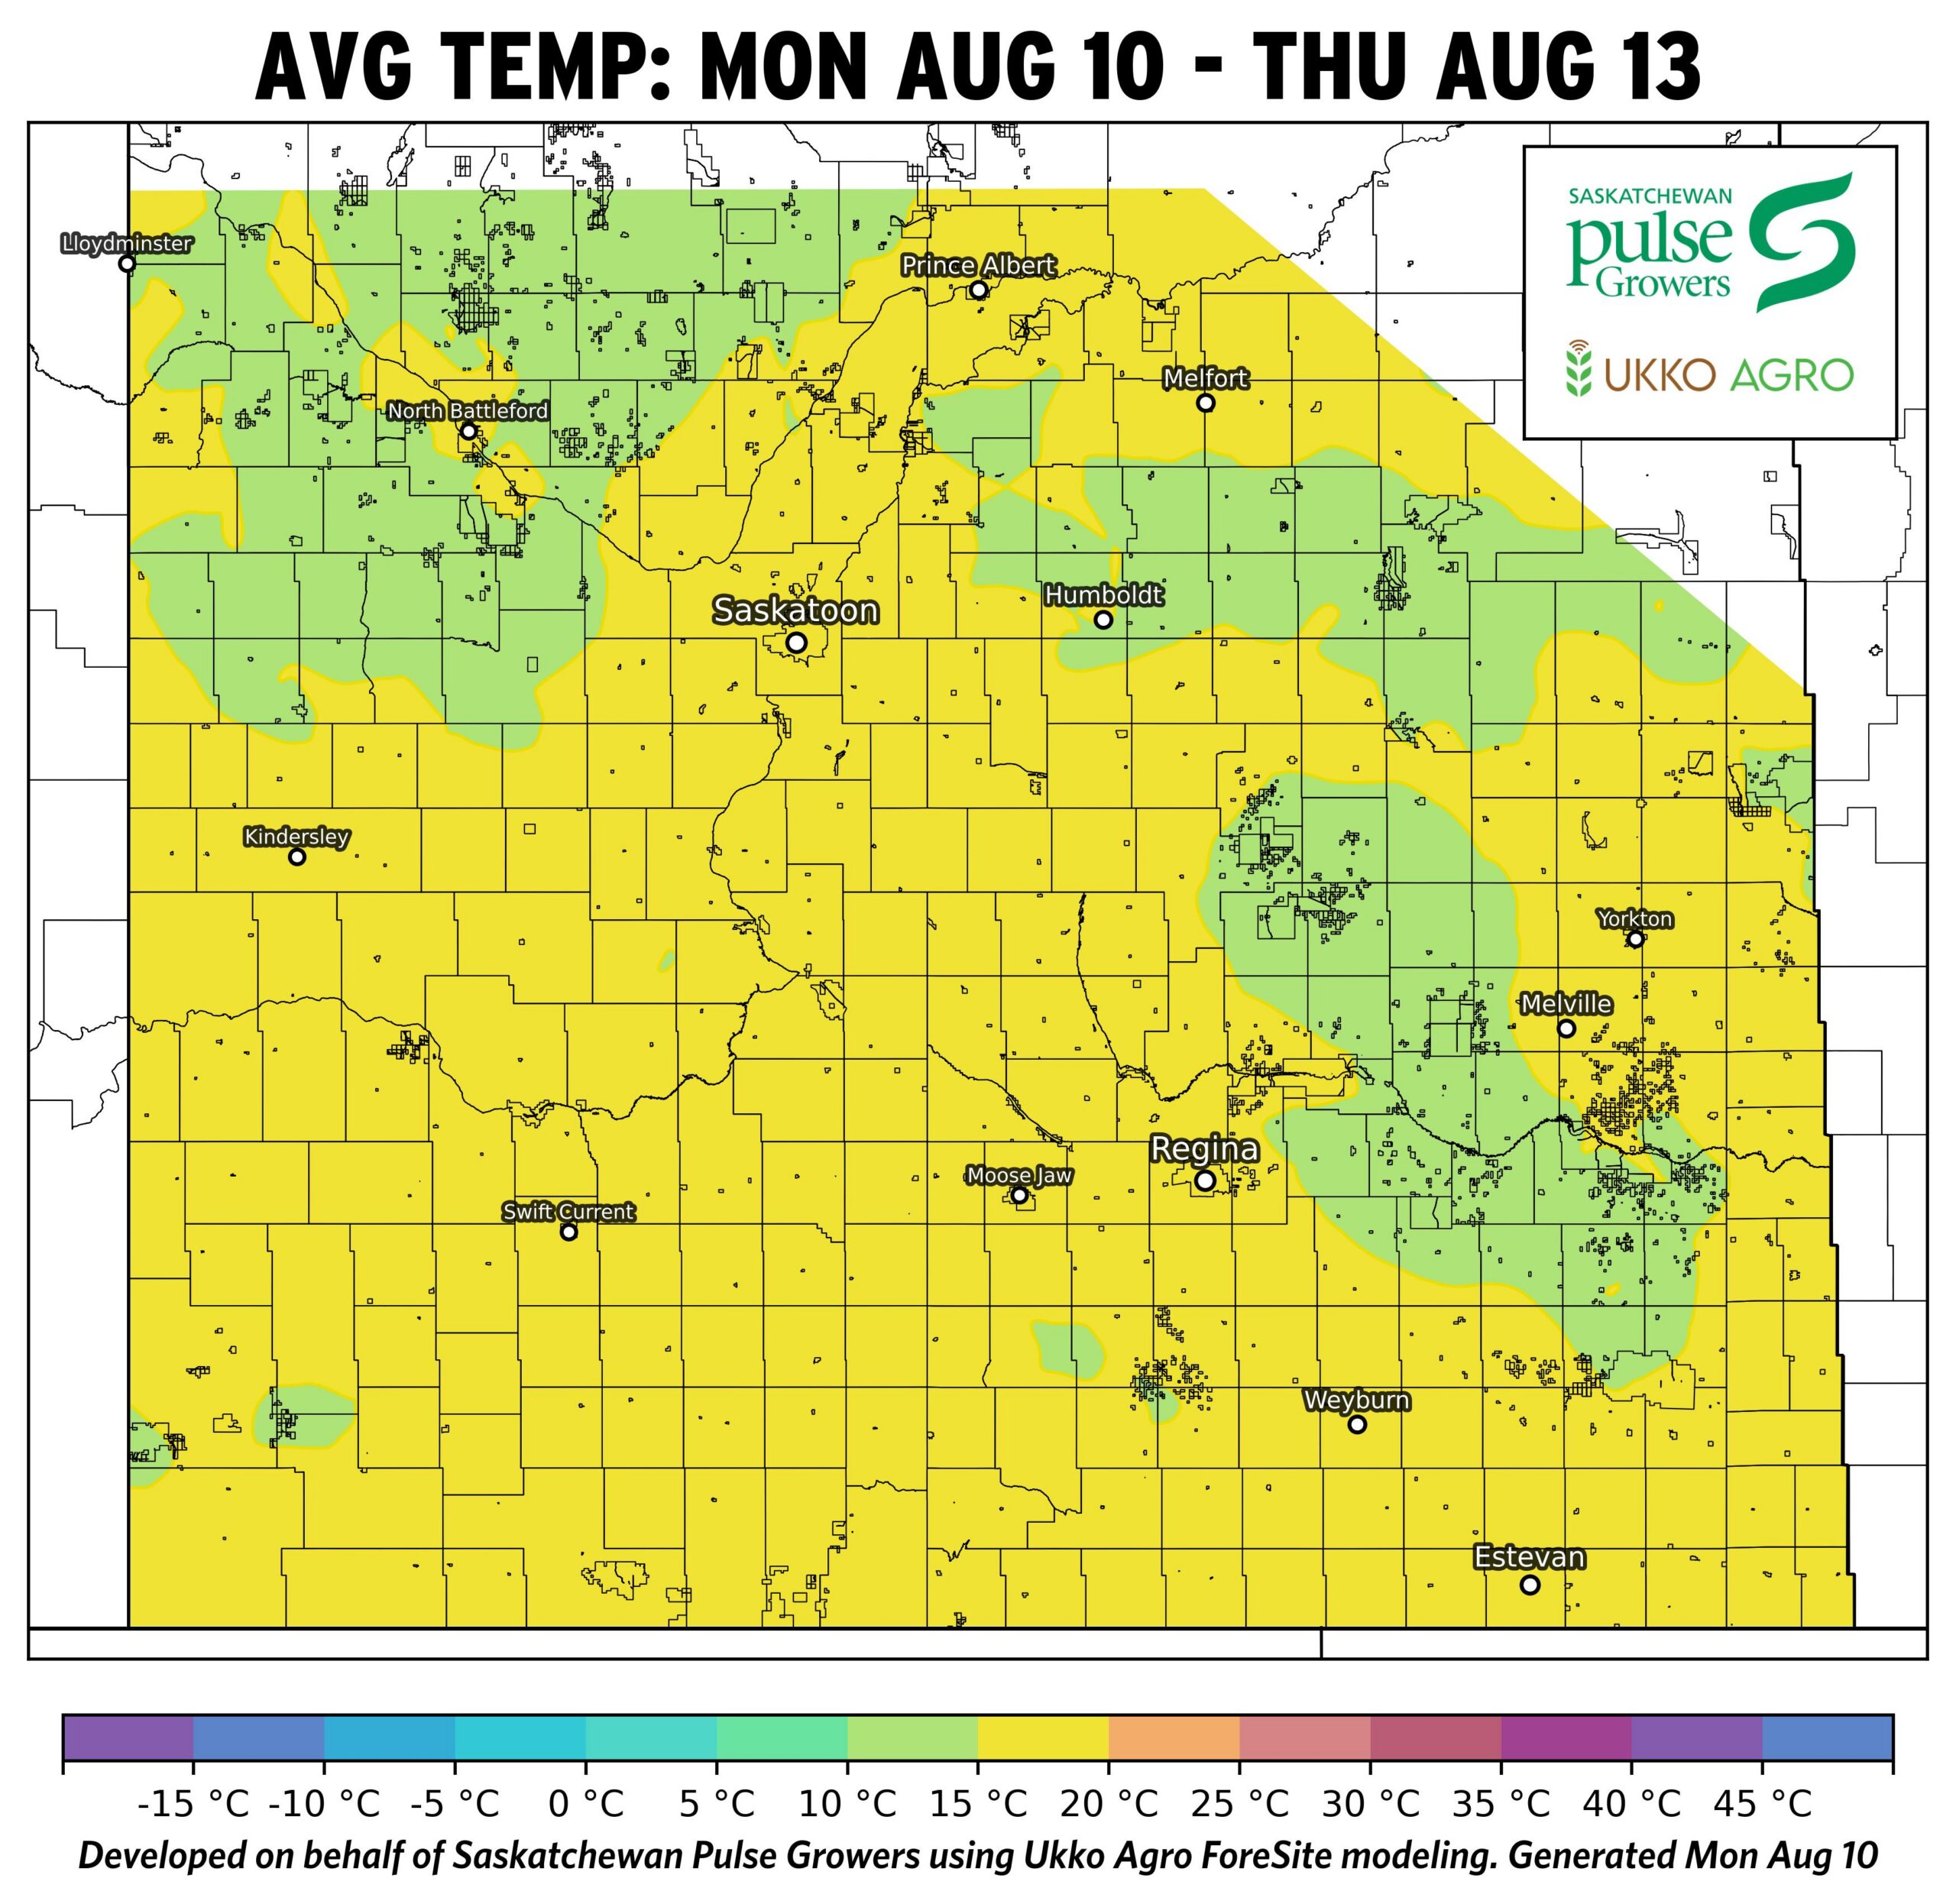
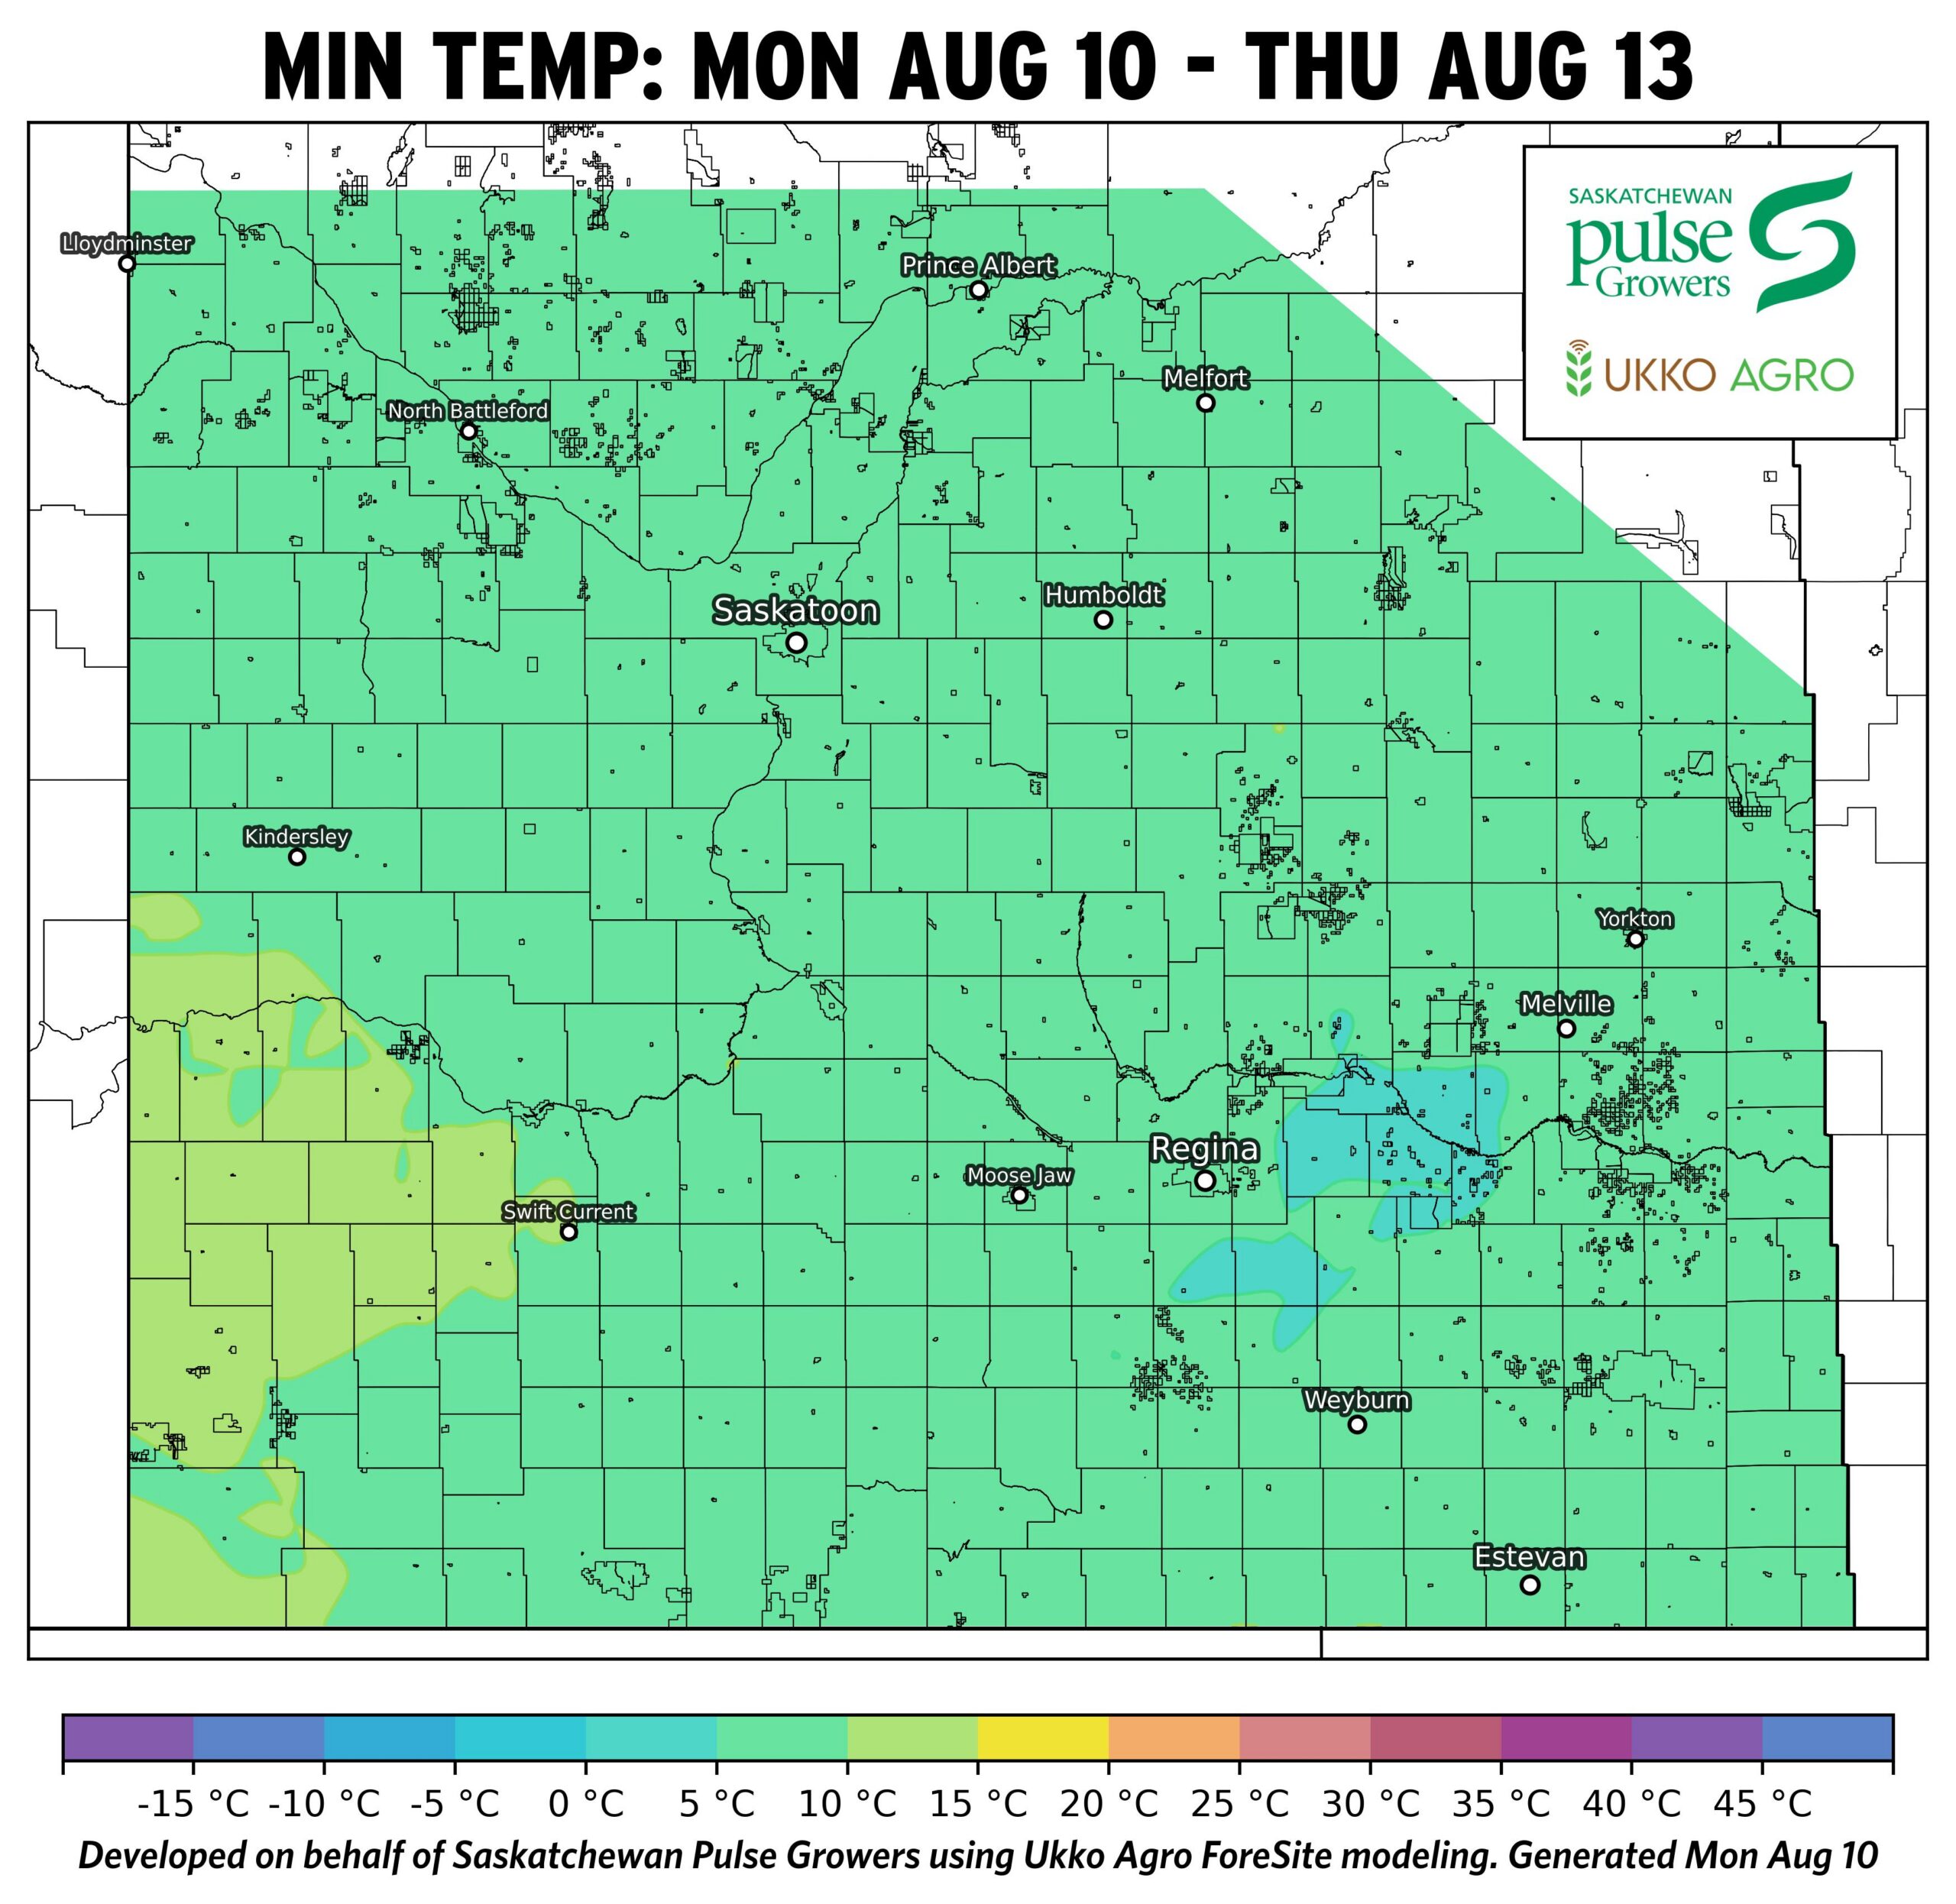
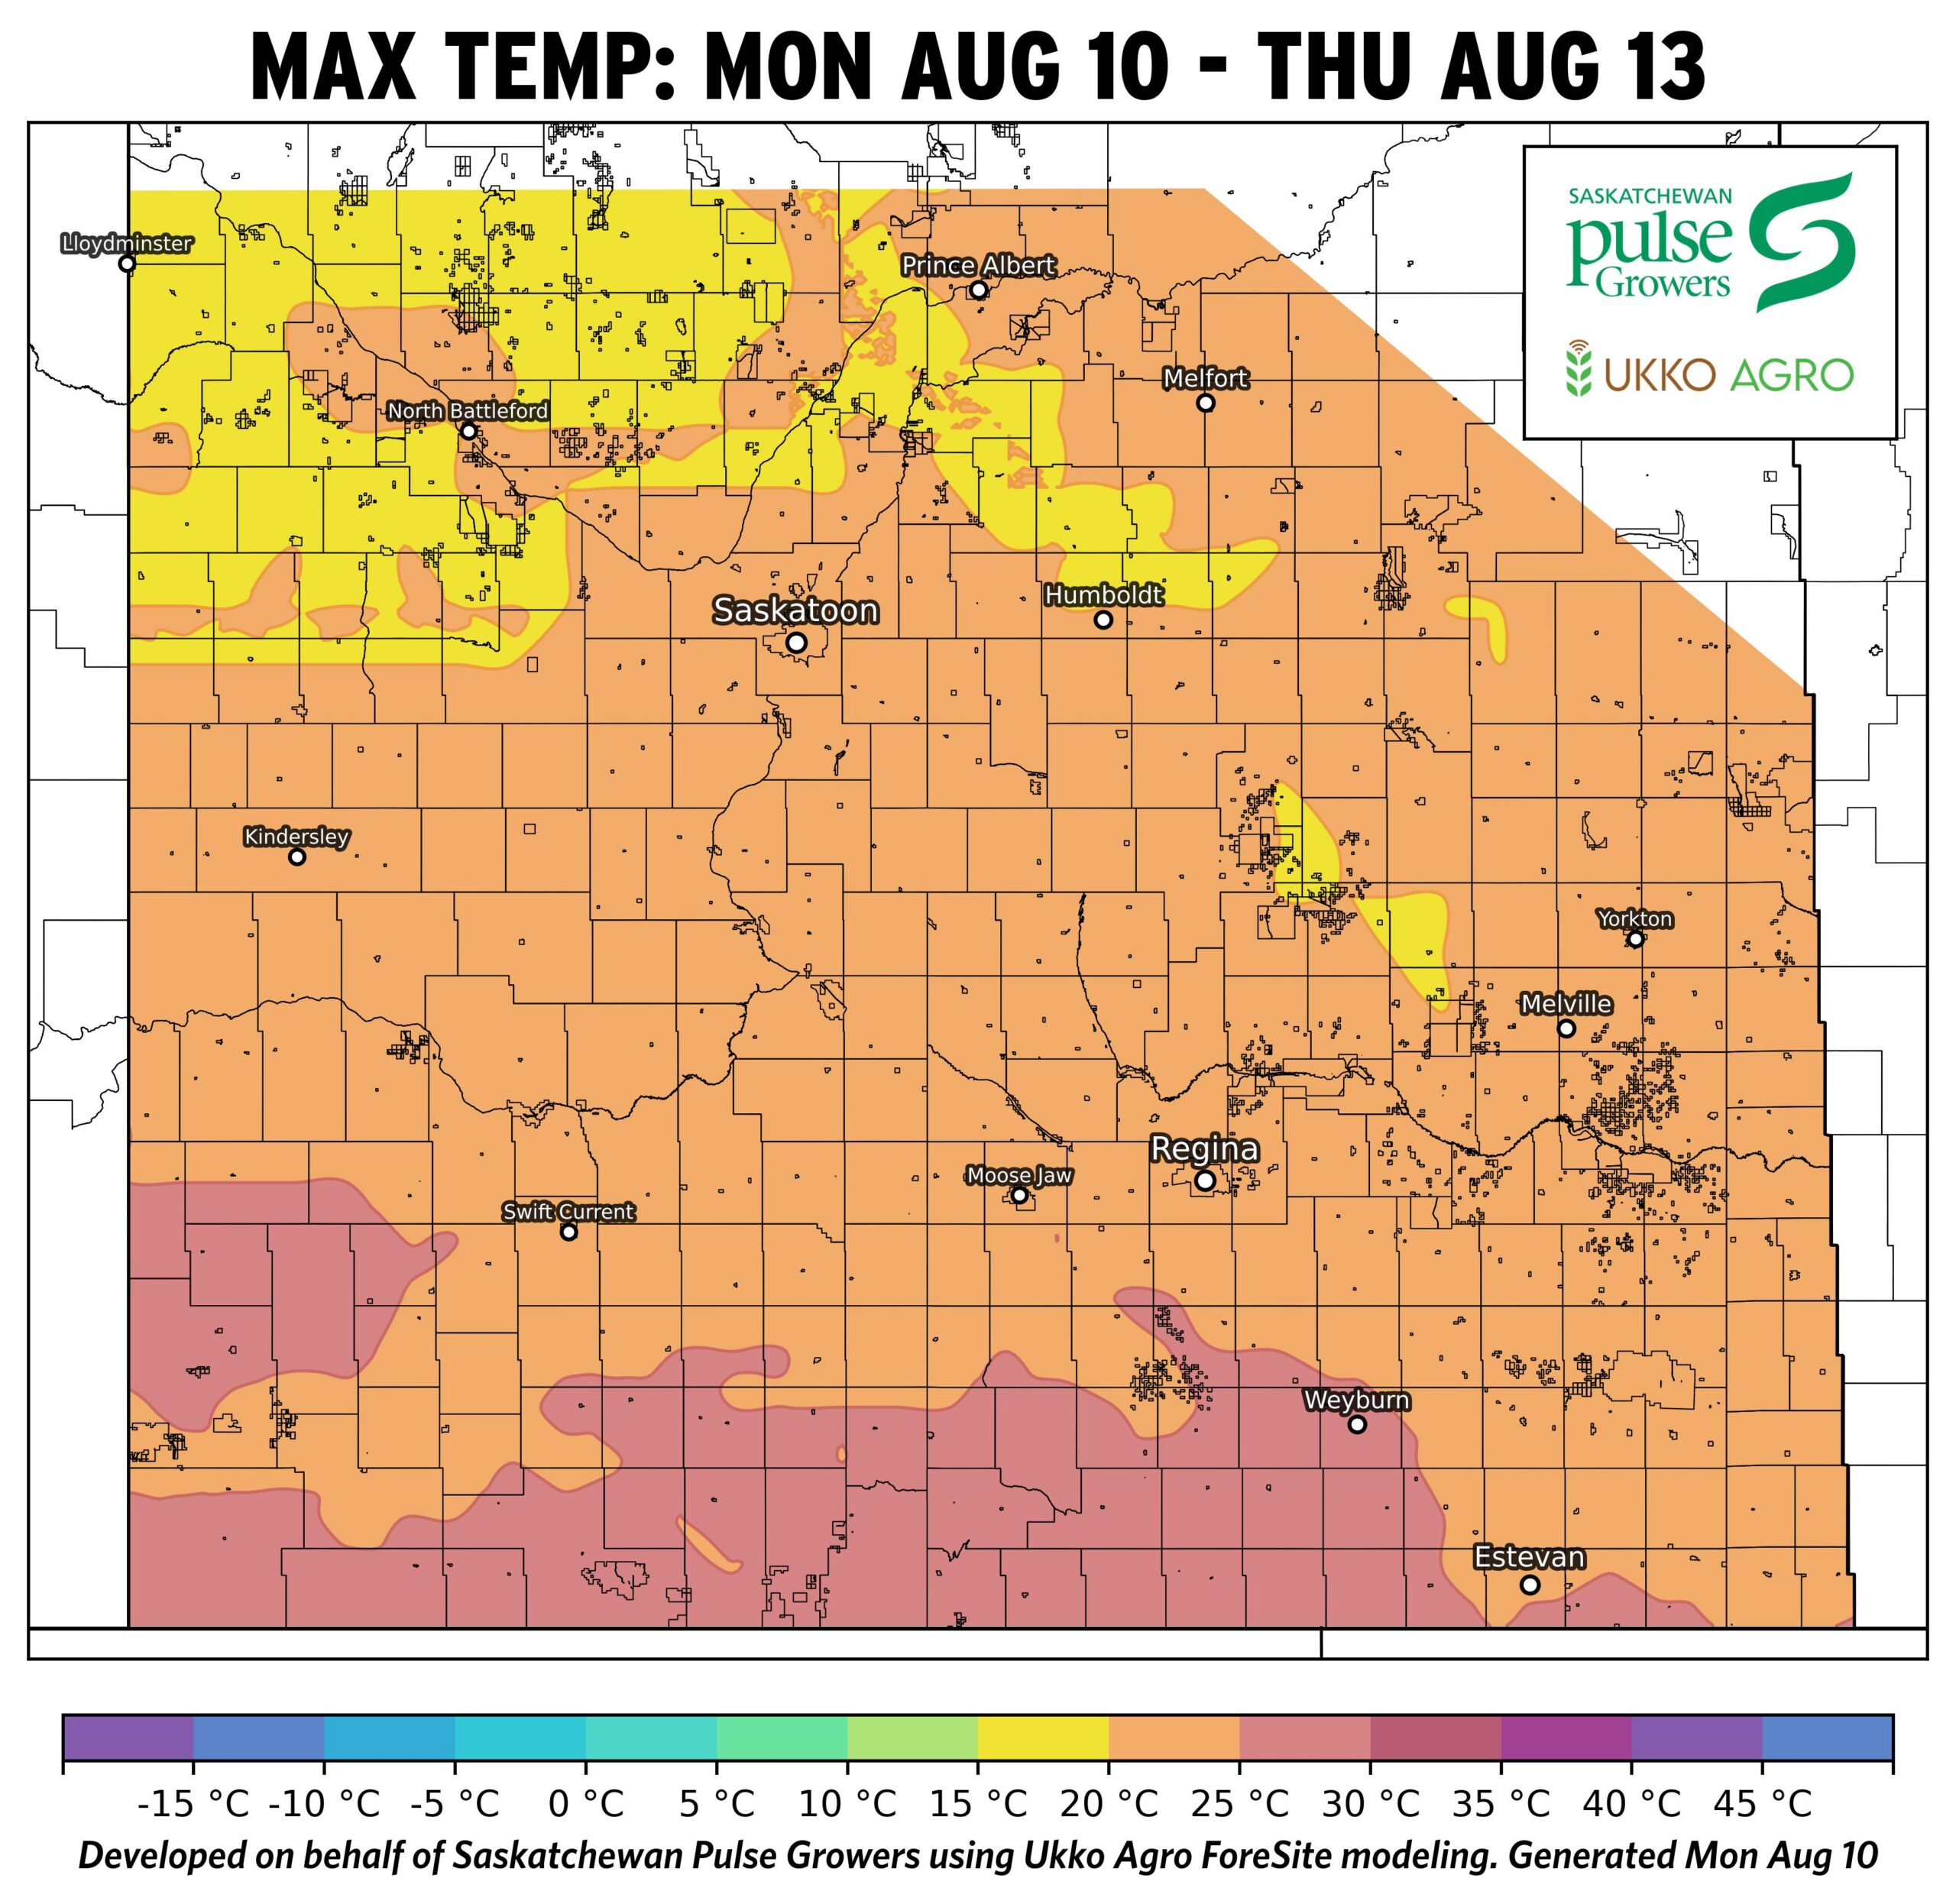
Temperature Maps: Agronomist Notes
- Moderate temperatures across Saskatchewan (max ~20-25°C for most of the province, avg ~15-20°C) will support crop development and maturity.
- Minimum temperatures of ~5–10°C are expected for most of the province throughout the week.Precipitation
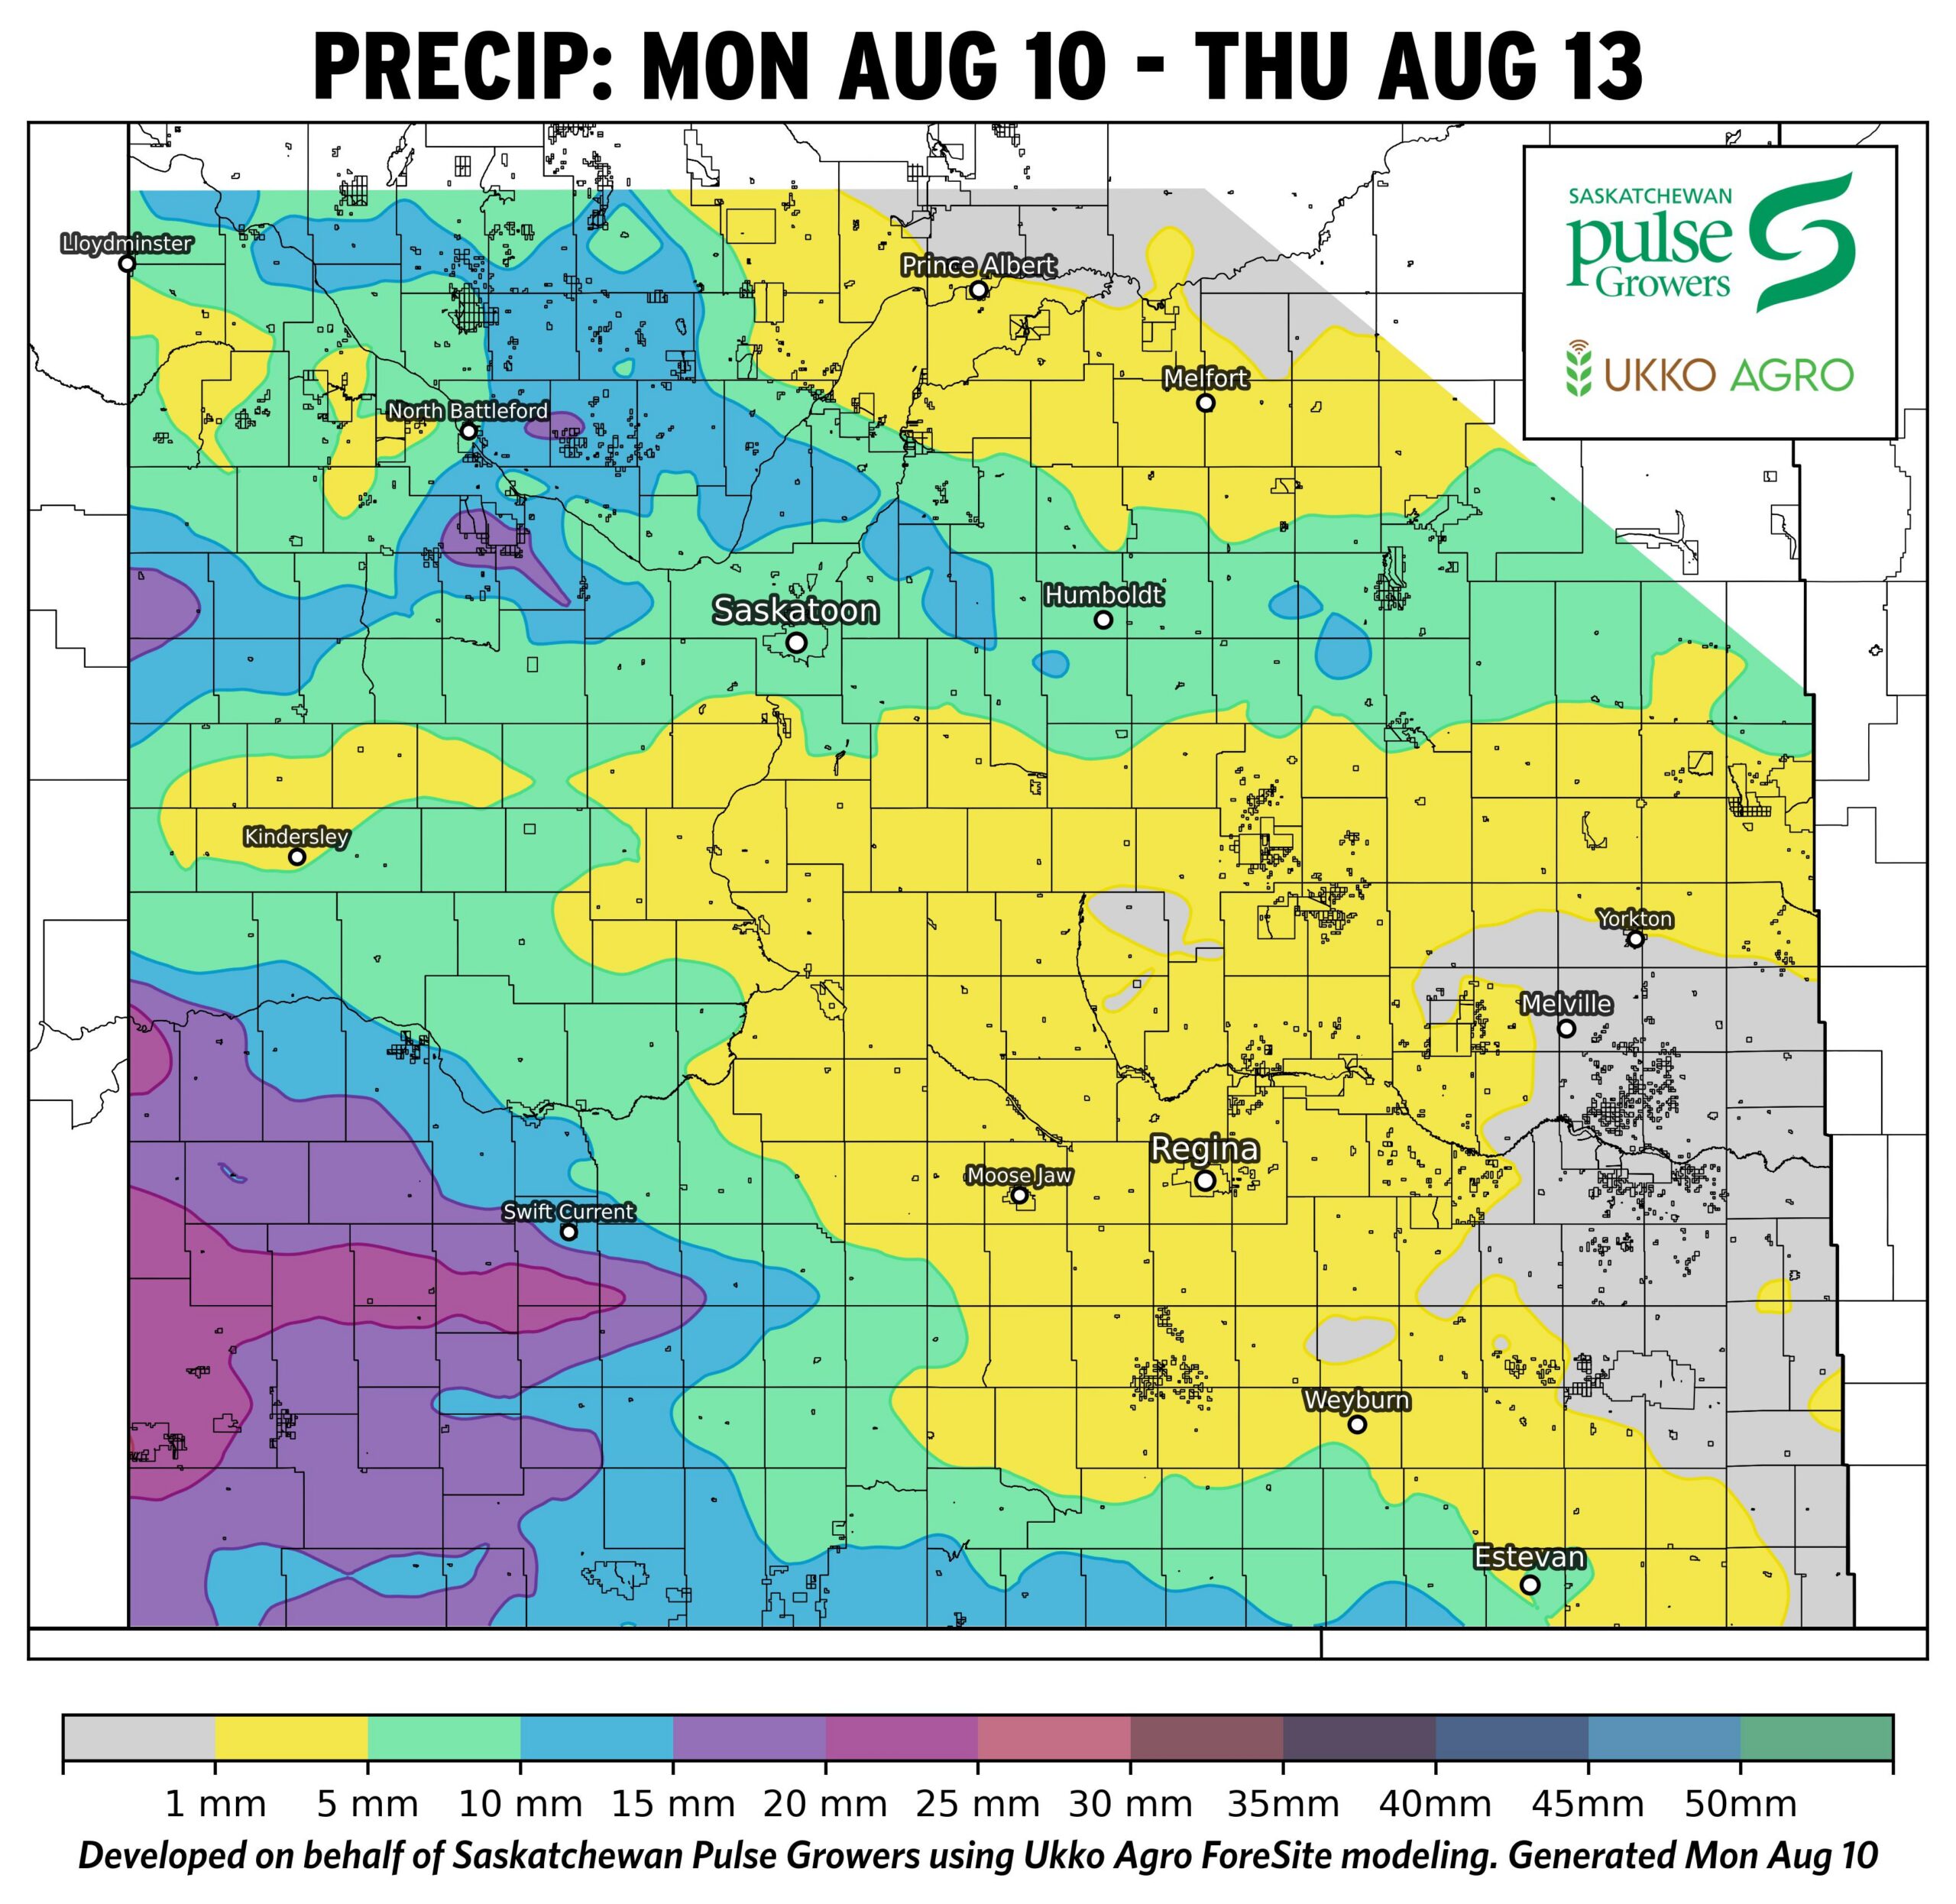
Precipitation Map: Agronomist Notes
- Varying amounts of precipitation is expected throughout the week. Areas in the southwest region can expect up to 25 mm of rain.
- The central part of the province can expect up to 10 mm.
- The northern regions can expect up to 15 mm in certain areas.
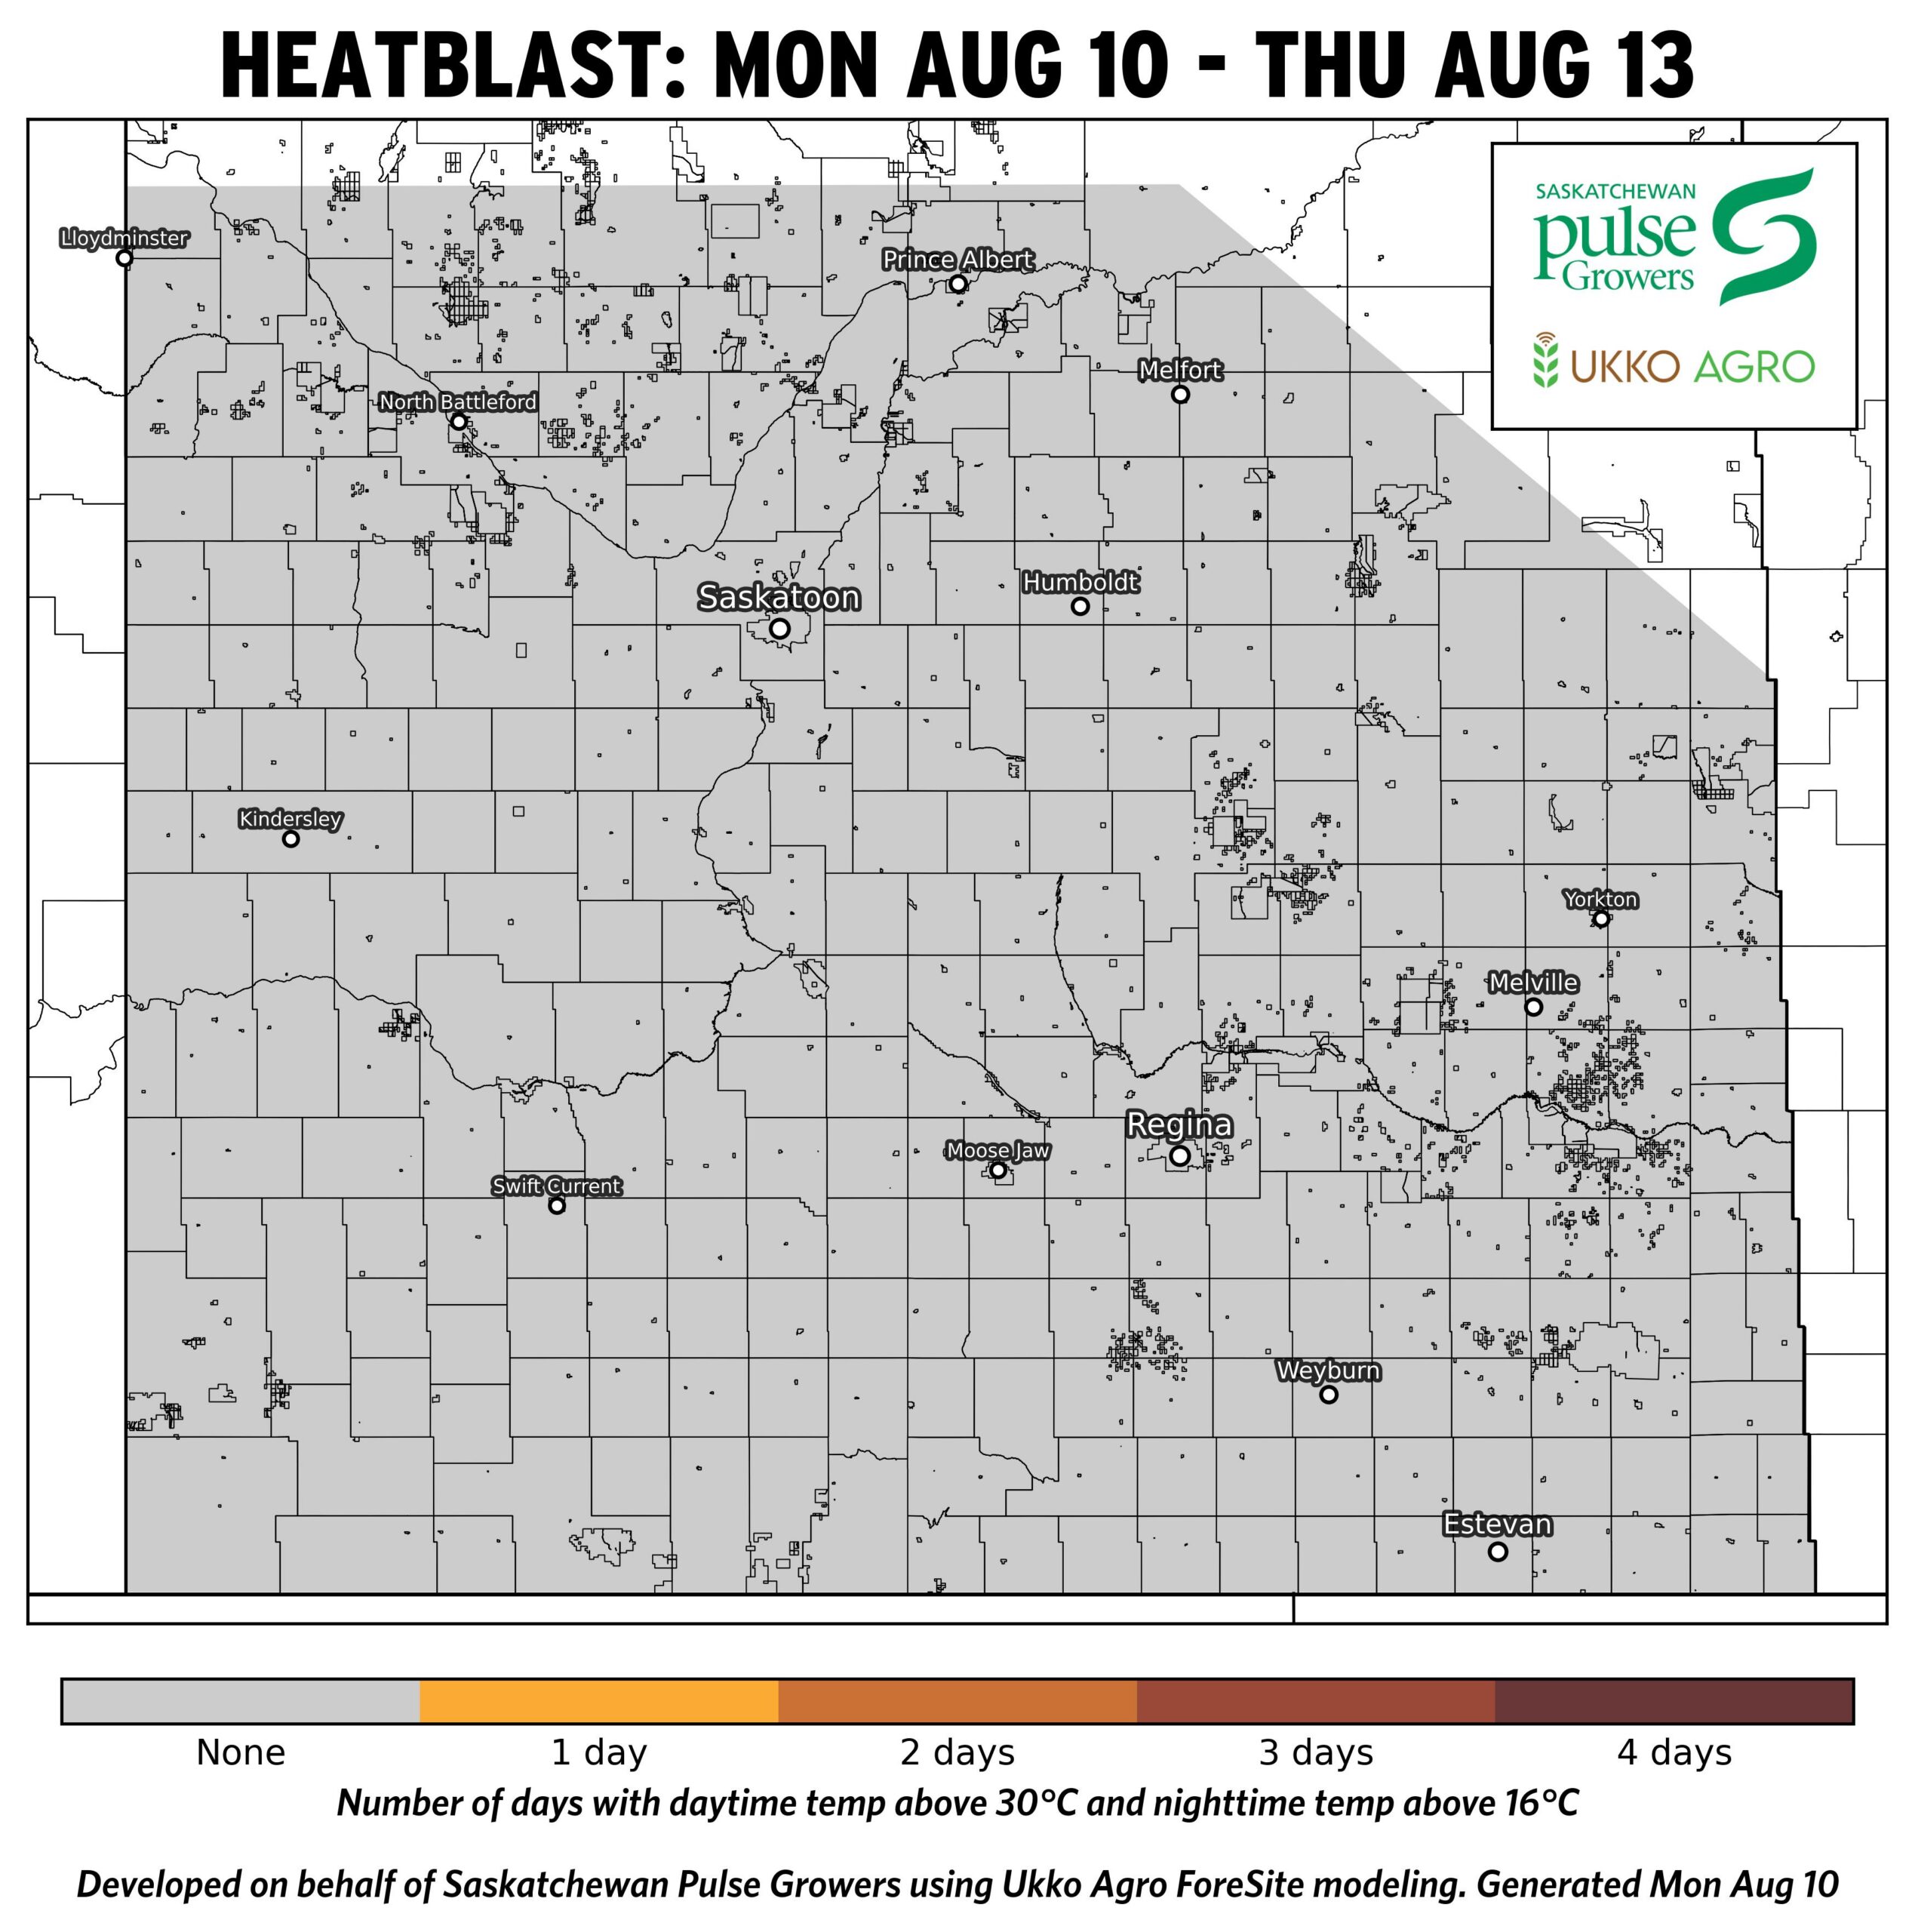
Heat Blast Map: Agronomist Notes
- No heat blast is anticipated for this week as temperatures will remain cool-moderate.
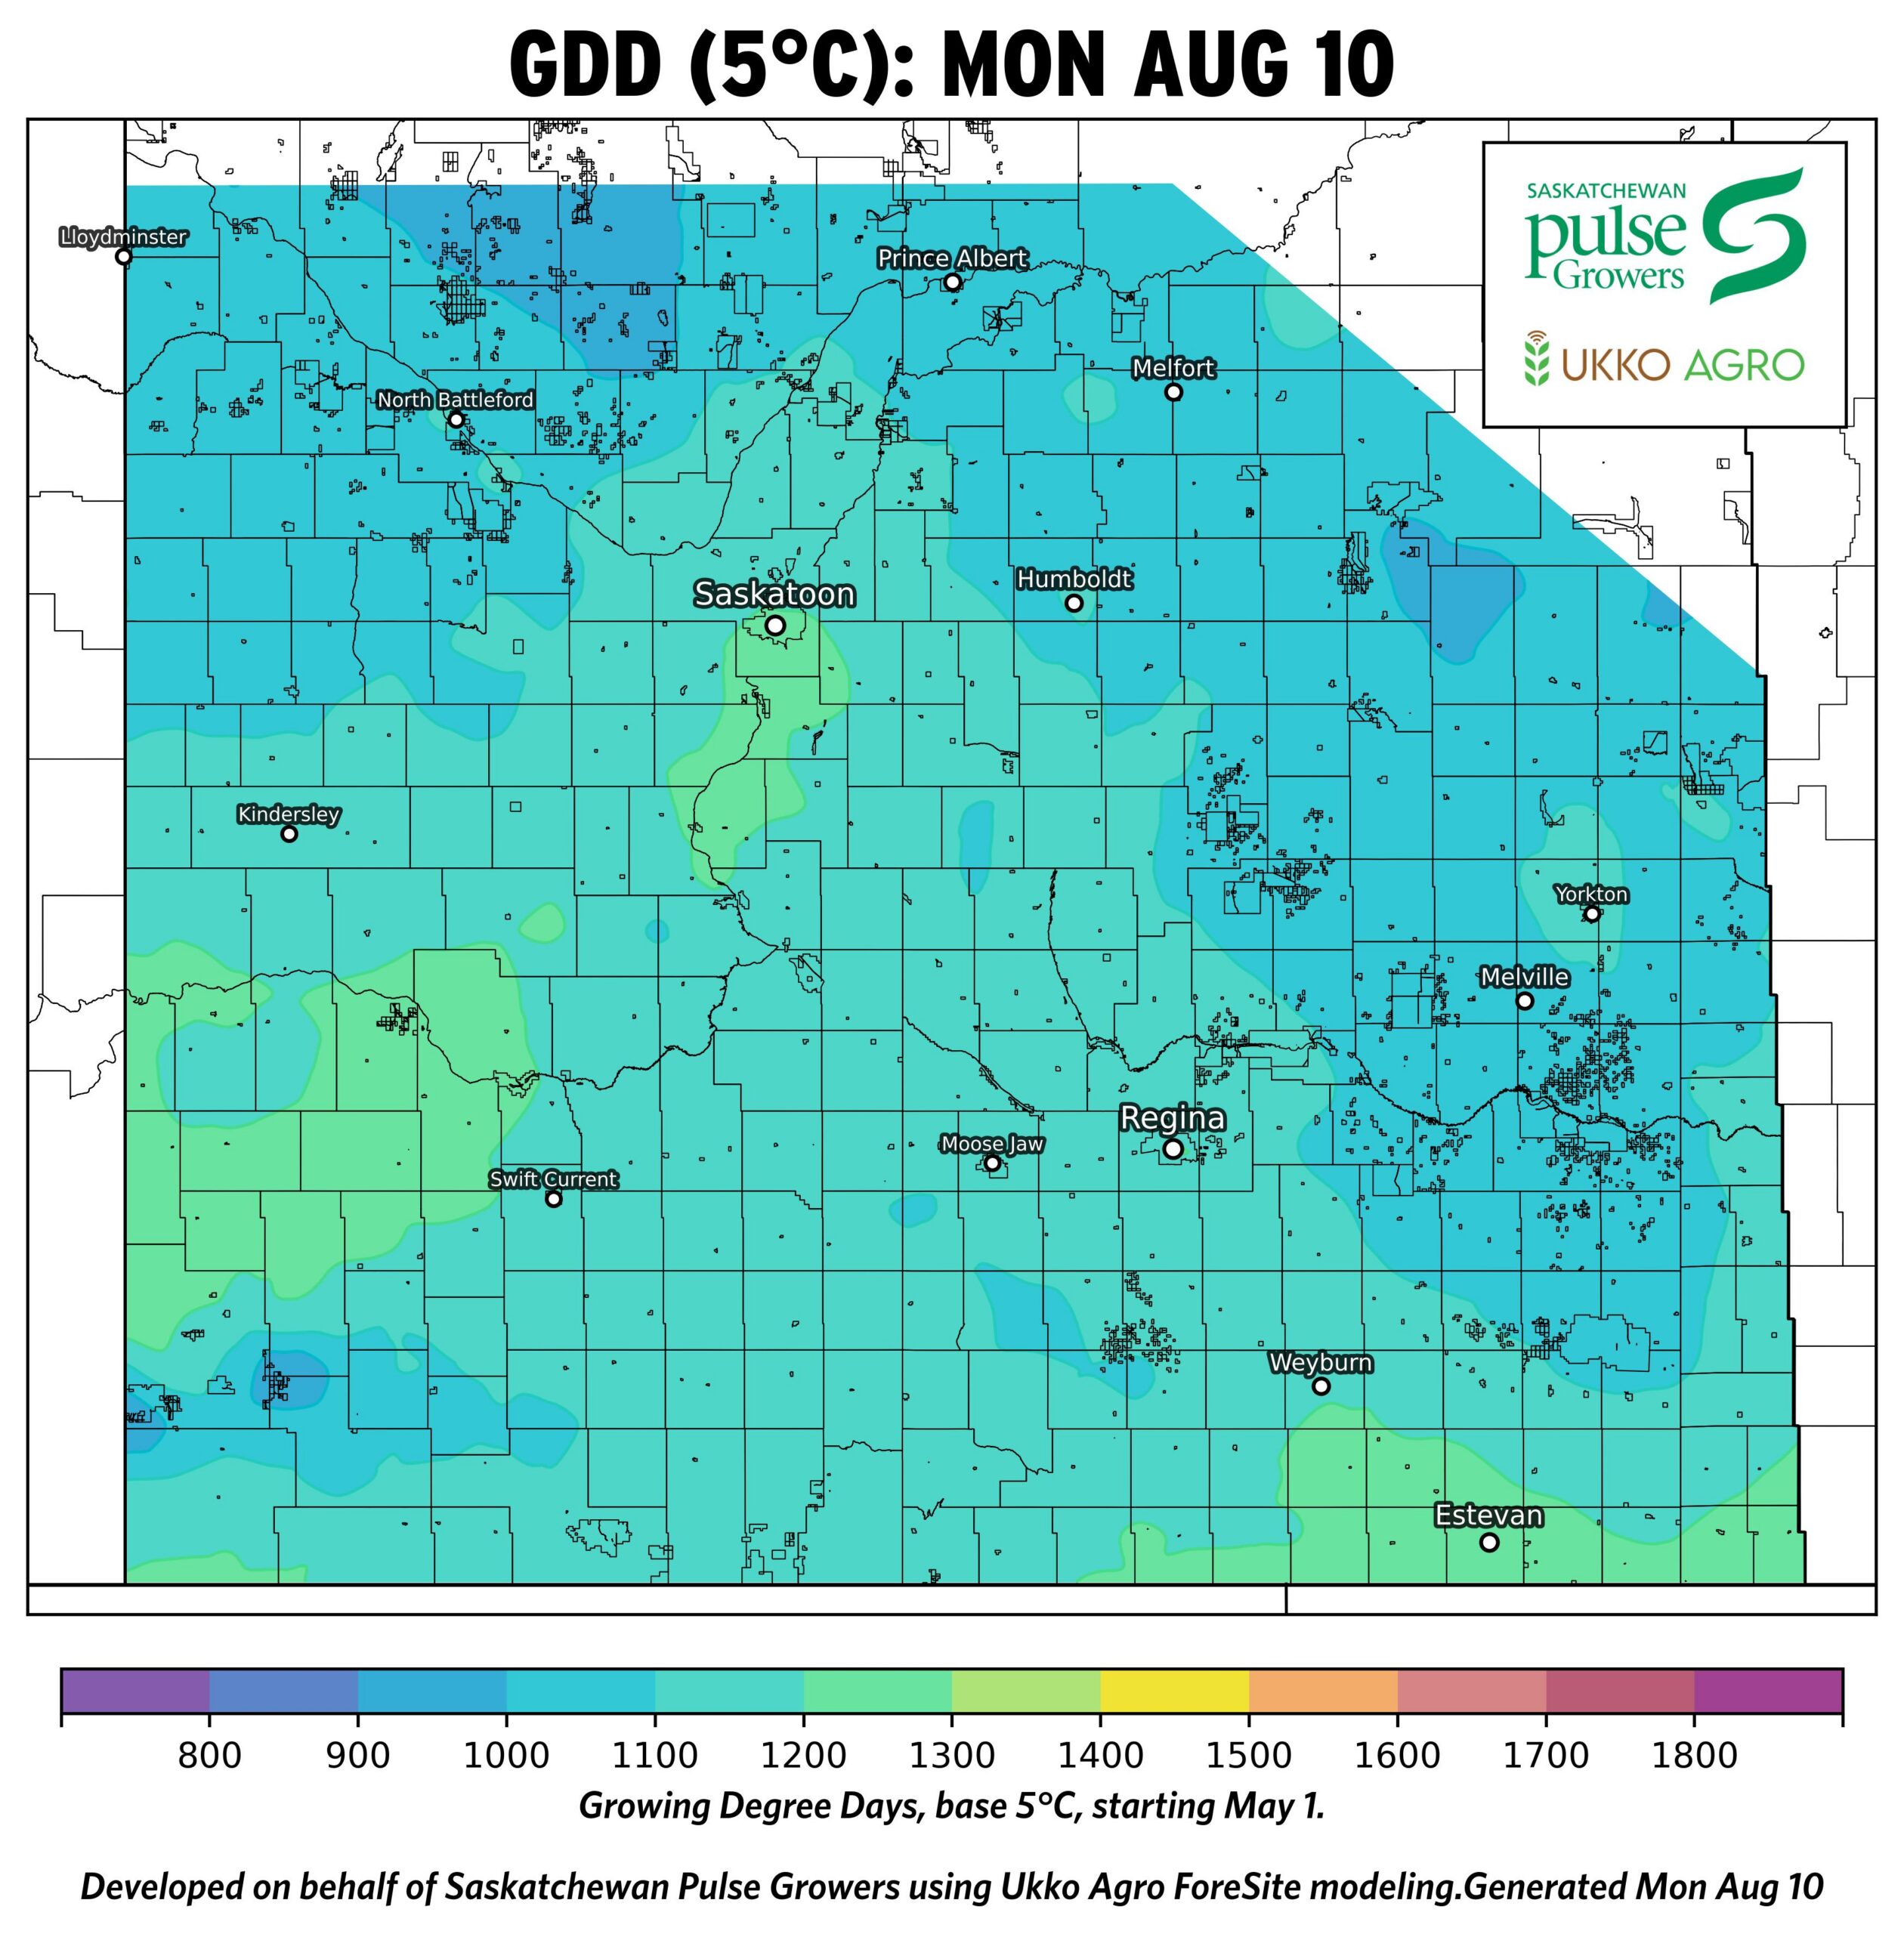
Growing Degree Days Map: Agronomist Notes
- Most of Saskatchewan is at ~1100-1200 GDD since May 1, supporting reproductive growth and maturity.
- A few small pockets of the province are at ~1000-1100.
- Overall GDD accumulation remains moderate, supporting reproductive growth and pod fill.
While every effort has been made to ensure the accuracy of these maps, weather-driven models are inherently uncertain, and forecasts may not be 100% precise. All outputs are based on conditions at the time of modeling and are subject to change as weather patterns evolve.
These maps are intended to serve as general decision-support tools only. They should not be relied upon as the sole basis for disease management, spray decisions, or other operational actions. Disease development and crop outcomes may be influenced by local environmental conditions, crop management practices, varietal susceptibility, and other factors not captured in the models. Users are strongly encouraged to verify risk through field scouting, on-site observations, and consultation with qualified agronomic advisors. For disease-specific decisions, refer to additional resources such as fungicide decision support tools and field-level risk assessments.
Information provided through these disease risk and environmental maps are OFFERED TO THE PUBLIC FOR INFORMATIONAL PURPOSES ONLY. The map creators and collaborating organizations assume no liability for decisions made or actions taken based on the use of this information.