Surveys of pests in pulse crops are important for monitoring for new diseases and insects, as well as to follow the severity of pests over time. In 2024 pulse crops were surveyed across Saskatchewan for foliar and root diseases as well as insects in crop. A seed quality survey of commercial seed test labs was also initiated to evaluate diseases on seed samples from the 2024 production year.
Disease Surveys
Disease assessments were made by visually examining plants from predetermined sampling patterns within each field. It is important to note that diagnosis of foliar disease was only based on visual symptoms in the field and no lab confirmation was carried out (except where noted).
Incidence is calculated as the percentage of the total number of plants assessed that have symptoms of the disease. For example – 76 out of 100 plants or 76% incidence within a field which is then averaged over the fields evaluated in each region.
Prevalence is a measure of the presence or absence of the disease in the field and is expressed based on the percentage of fields positive for that symptom. For example – Anthracnose symptoms are found in 31 out of the 36 lentil fields which equates to 86.1% prevalence.
Lentil
A total of 55 lentil field were surveyed for the presence and incidence of diseases in Saskatchewan. The survey was completed between July 12 to August 8 with most of the surveyed fields in staging of R4 (Flat pod) to R6 (Full pod). The number of surveyed crops was highest in Southwest Saskatchewan, with 23 of the 55 crops surveyed located in this region. The distribution of the surveyed crops across the rest of the province was as follows: 12 (West central), 12 (Southeast), 6 (East-central) and 2 (Northwest). Disease assessments were made by visually examining 10 plants from each of 5 sites along a W-pattern in each field. Individual sites were located at least 50 m from the field edge and at least 30 m apart. Crops were assessed for the incidence of anthracnose (Colletotrichum truncatum), ascochyta blight (Ascochyta lentis), sclerotinia stem and pod rot (Sclerotinia sclerotiorum), botrytis stem and pod rot (Botrytis cinerea) and stemphylium blight (Stemphylium spp.) and the prevalence of root rot complex (Fusarium spp / Pythium spp. / Rhizoctonia solani / Aphanomyces euteiches) and all previously listed diseases. Incidence is calculated as the percentage of plants assessed (out of 50 plants total per crop) with symptoms of the disease, while prevalence is a measure of the presence or absence of the disease in the field. All disease assessments were made based on visual symptoms observed in the field and samples were tested in the lab only if requested by an individual surveyor.
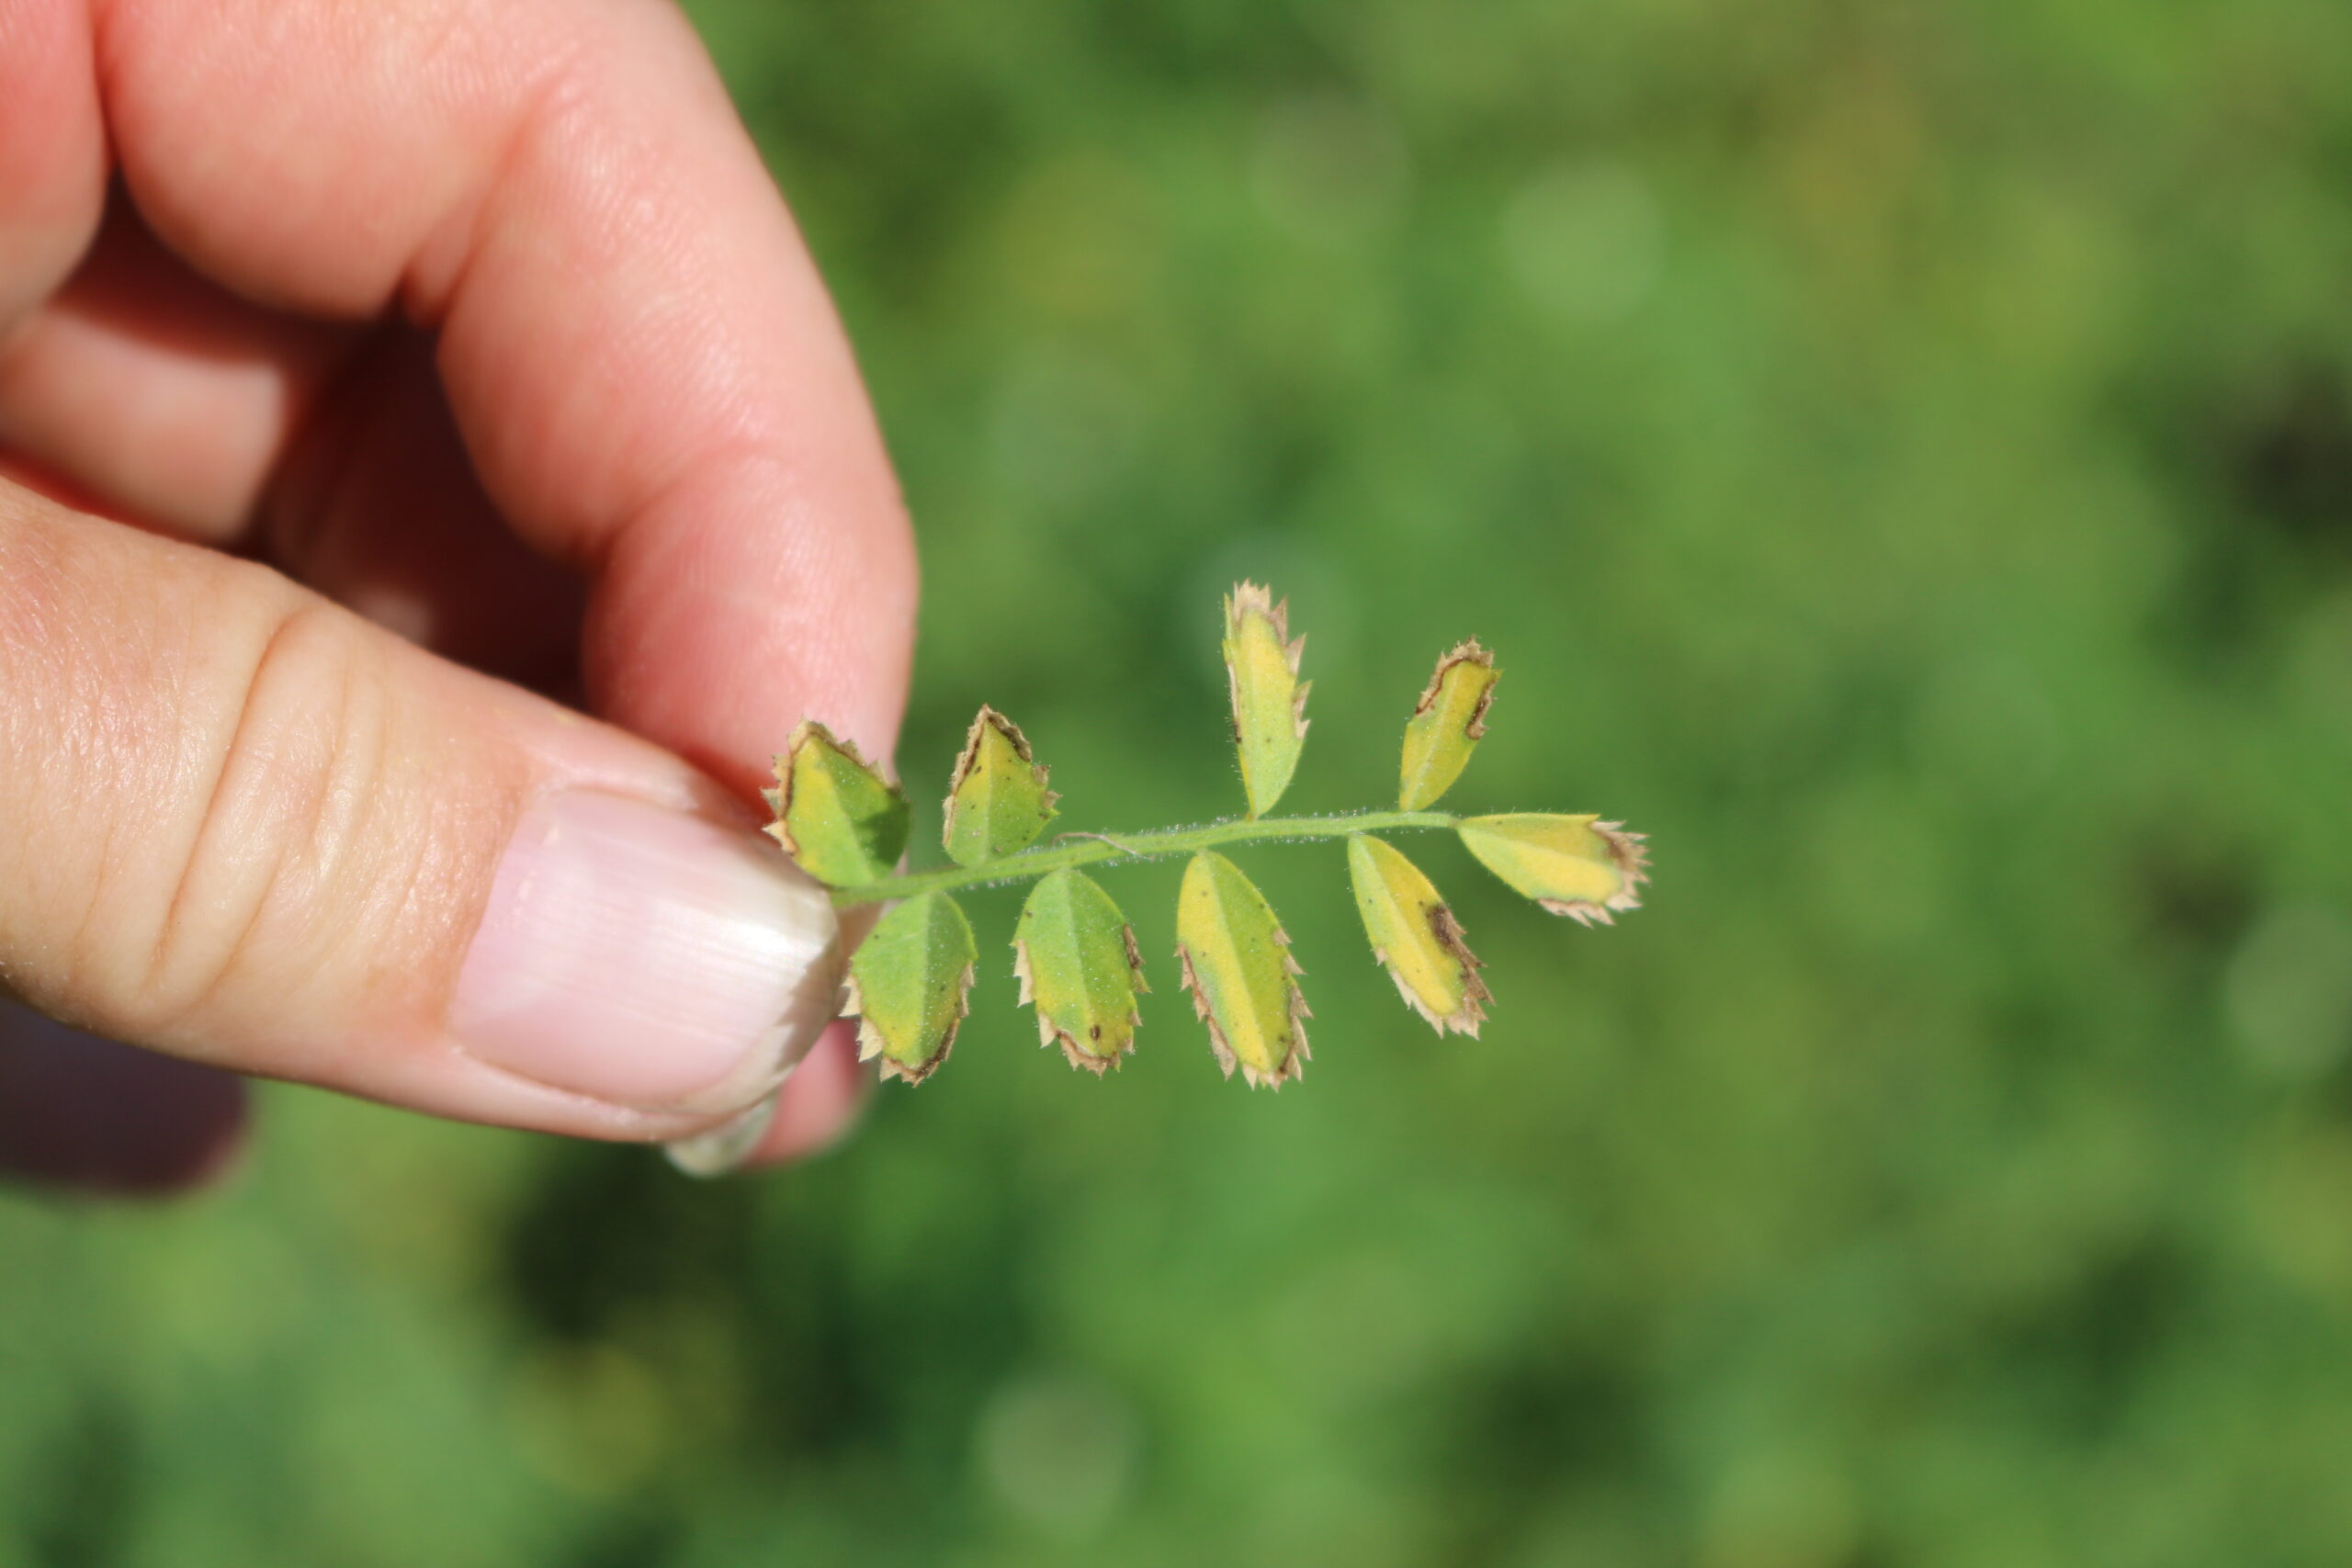
Root rot complex symptoms were present in 85 % of the surveyed crops (Table 1). Across the regions, prevalence ranged from 75% to 100% of survey fields. Overall average incidence of root rot across the province was 41% with an average severity of 1.7 across all fields (Table 2 and 3).
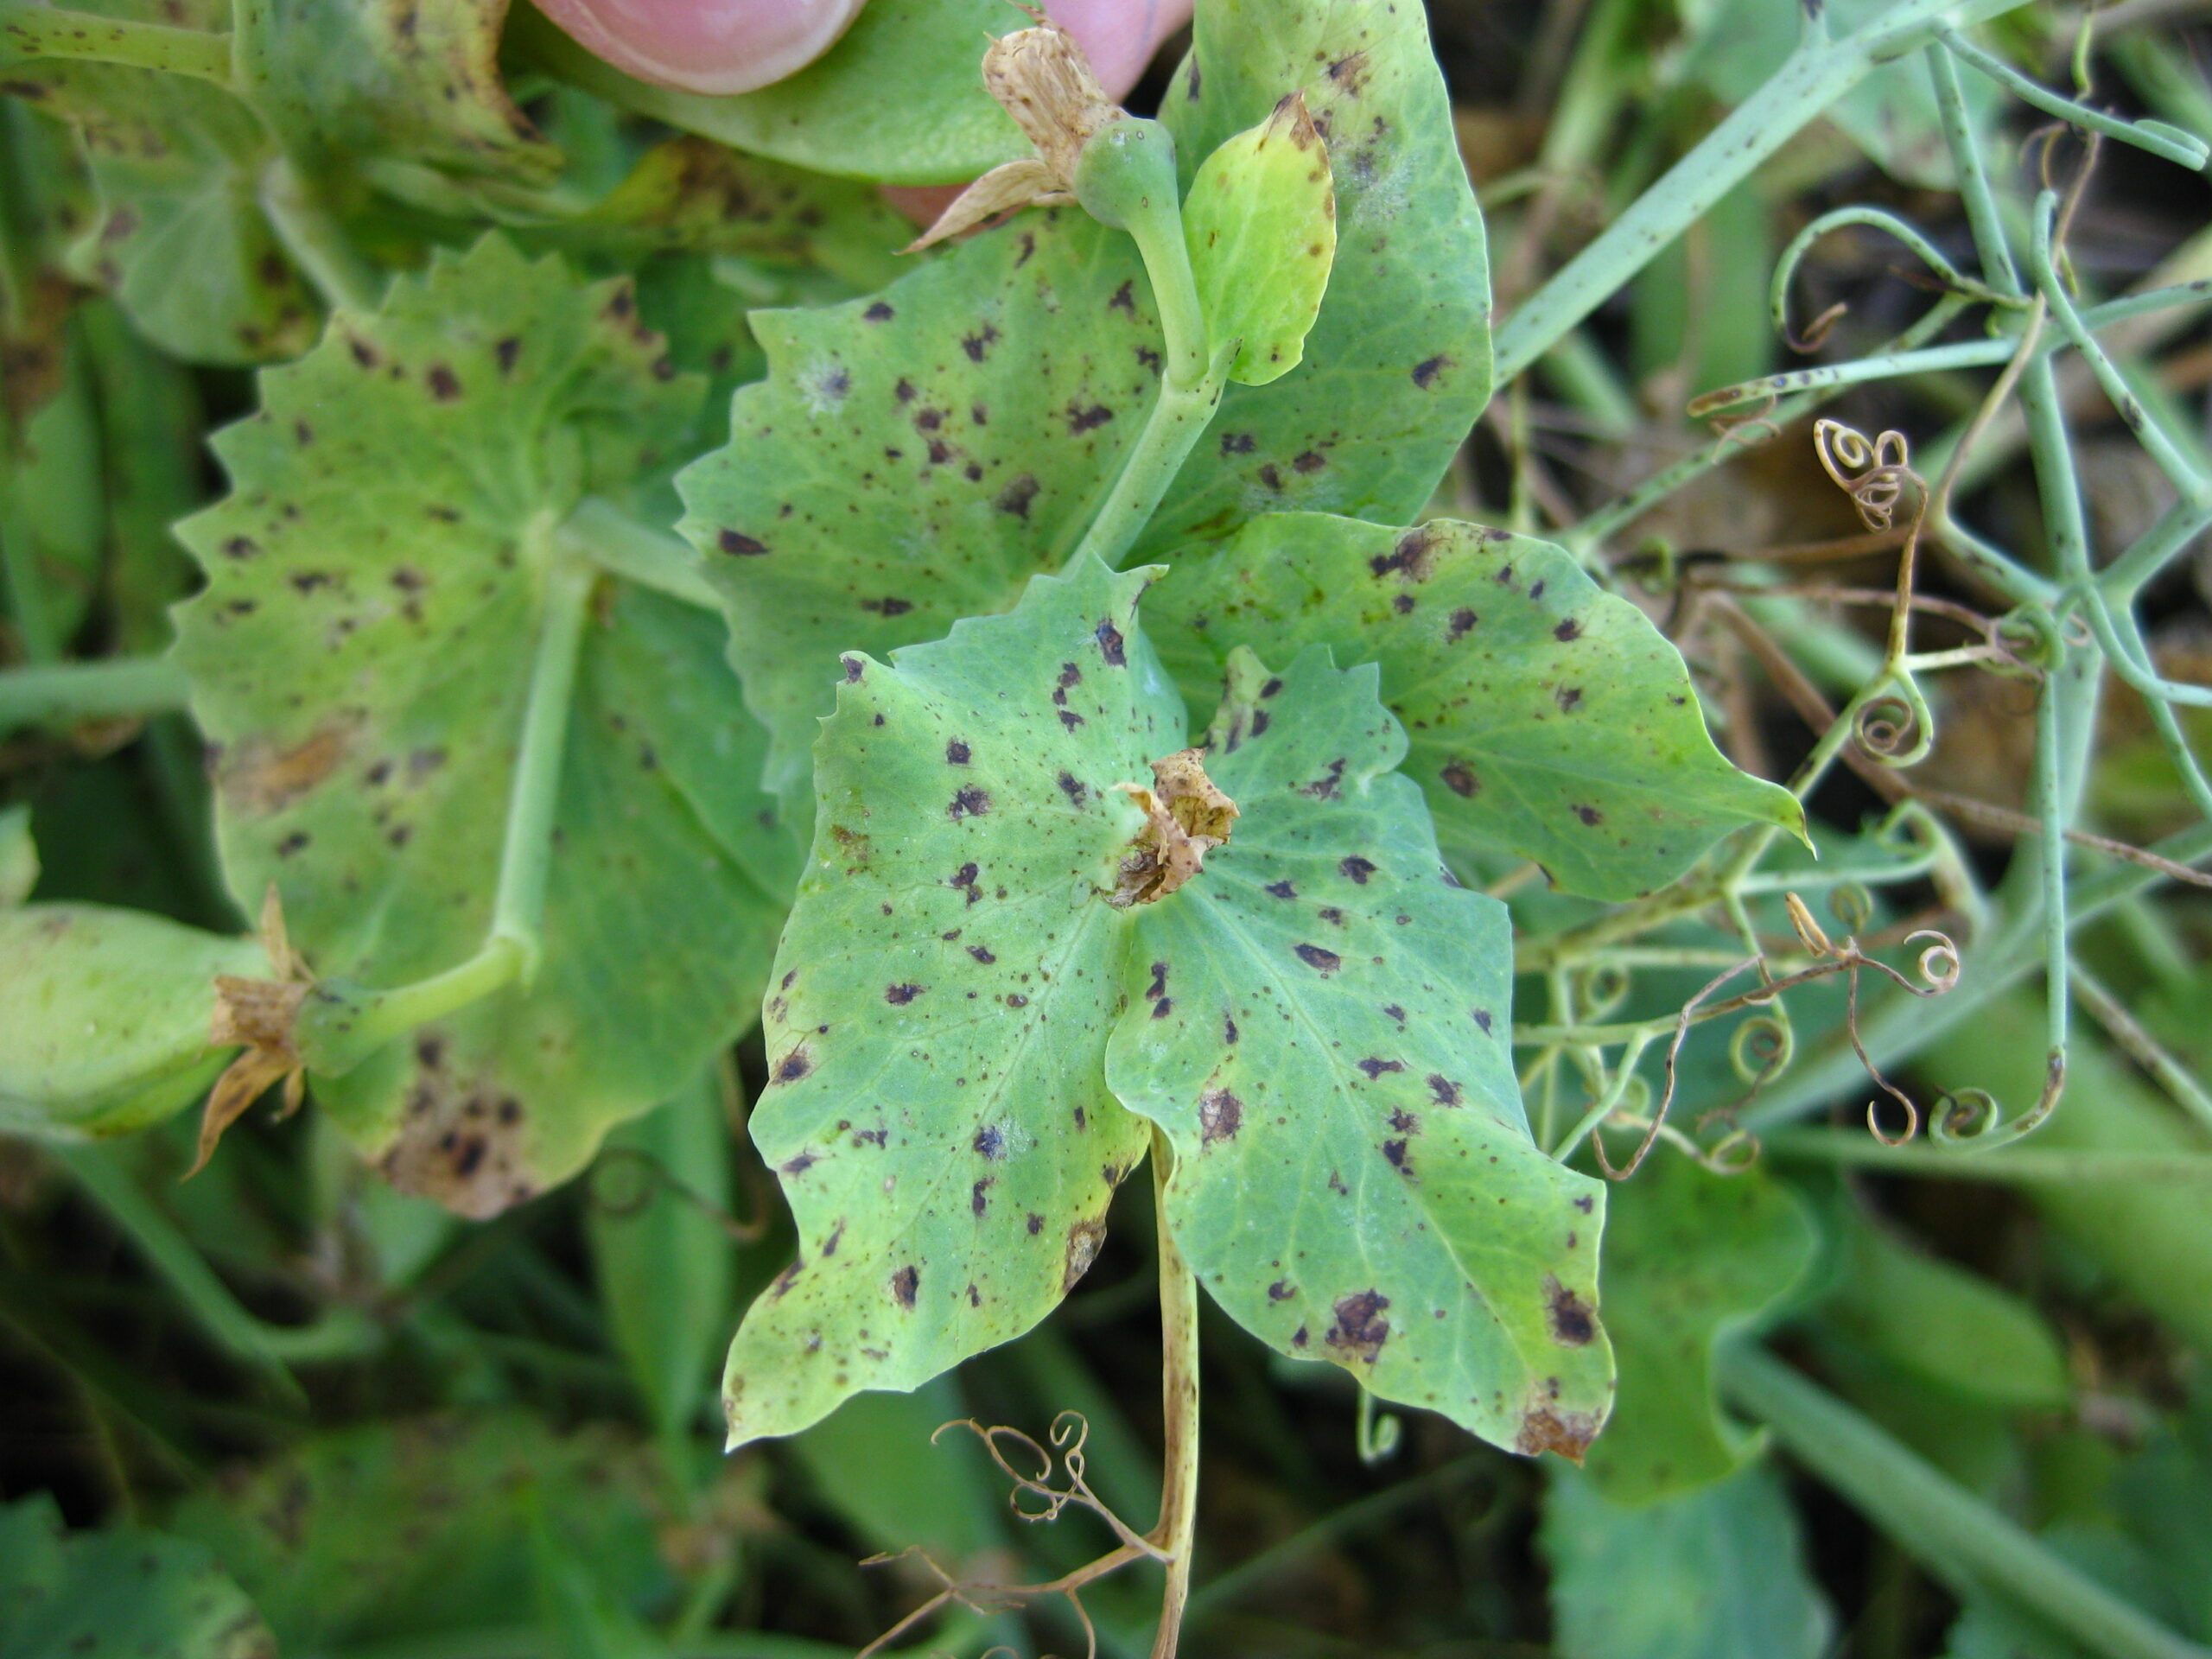
Anthracnose was the most prevalent foliar disease in 2024 and was identified in 85% of the surveyed crops with an overall average incidence of 38 % with an average severity of 0.6 across all fields (Tables 1, 2 and 3). The incidence of anthracnose was highest in Northwest Saskatchewan (50 %) followed by the East-central (49 %).
Stemphylium blight was observed in 25% of crops with an average incidence of 4% (Tables 1 and 2). Across the regions the incidence of stemphylium blight ranged from almost 0% (West-Central) to 9% (Northwest) of surveyed crops.
Ascochyta blight was found in 9% of crops with an average incidence of 0.9% (Tables 1 and 2). It is important to note that diagnosis was only based on visual symptoms in the field. Plants having visual symptoms that were consistent with ascochyta blight were not confirmed with additional testing.
Sclerotinia stem and pod rot was observed in 4% of crops with an average incidence of 0.1% (Tables 1 and 2). Sclerotinia stem and pod rot were found only in two fields, one in each of the East Central and West Central regions.
The levels of other diseases were very low across all regions. Botrytis stem and pod rot was not observed.
Severity scale for root rot complex of lentils (modified from Chatterton et al. 2019)
| Rating | Lesions | % affected | Pruning |
|---|---|---|---|
| 1 | None | 0 | 0 |
| 2 | Small (<1cm), lesion near seed attachment | 0 | 0 |
| 3 | Small coalescing lesions approximately 180° around the stem | 10-20% | 0 |
| 4 | Lesions extending and completely encircling the stem | >20-95% | 5-20% |
| 5 | Increasingly discolored and extended epicotyl lesions | 100% | >20-50% |
| 6 | Epicotyl lesions encircling the stem extending up to 2 cm | 100% | >50-80% |
| 7 | Tap root (including epicotyl) completely lesioned | Dead | Dead |
Severity scale for lentil anthracnose (developed by Dr. Michelle Hubbard, AAFC)
| Rating | Description |
|---|---|
| 0 | None |
| 1 | Up to 5% of plant area diseased (lower canopy). A few superficial lesions at stem base |
| 2 | >5-25% of stems and leaves affected in infected plants (lower canopy). Lesions, some leaf drop. |
| 3 | >25-50% of stems and leaves affected in infected plants (lower and mid canopy). Lesions and leaf drop. |
| 4 | >50-75% of stems and leaves affected in infected plants (lower, mid and upper canopy). Lesions, leaf drop, shoot die-back). |
| 5 | >75% of stems and leaves affected in infected plants (lower, mid and upper canopy). Lesions, leaf drop, severe shoot die-back. |
Table 1. Prevalence of Disease in Saskatchewan Lentil Crops Surveyed in 2024
| Region1 | Number of Fields Surveyed | Prevalence (%) (number of fields with symptoms) | |||||
| Root rot complex | Anthracnose | Ascochyta blight | Sclerotinia stem & pod rot | Botrytis stem & pod rot | Stemphylium Blight | ||
| SW | 23 | 83 (19) | 87 (20) | 17 (4) | 0 | 0 | 30 (7) |
| SE | 12 | 100 (12) | 75 (9) | 0 | 0 | 0 | 17 (2) |
| EC | 6 | 83 (5) | 83 (5) | 0 | 17 (1) | 0 | 17 (1) |
| WC | 12 | 75 (9) | 92 (11) | 8 (1) | 8 (1) | 0 | 17 (2) |
| NW | 2 | 100 (2) | 100 (2) | 0 | 0 | 0 | 100 (2) |
| Overall | 55 | 85 (47) | 85 (47) | 9 (5) | 4 (2) | 0 | 25 (14) |
1Region: Southwest (SW); Southeast (SE); East Central (EC); West Central (WC); Northwest (NW).
Source: Saskatchewan Pulse Disease Situation Report 2024 submitted to Western Forum on Pest Management by Alireza Akhavan from Saskatchewan Ministry of Agriculture
Table 2. Disease Incidence in Saskatchewan Lentil Crops Surveyed in 2024
| Region | Incidence of disease (%) (Incidence in only infected fields)2 | |||||
| Root rot | Anthracnose | Ascochyta blight | Sclerotinia stem & pod rot | Botrytis stem & pod rot | Stemphylium Blight | |
| SW | 44 (53) | 43 (49) | 1 (6) | 0 | 0 | 7 (25) |
| SE | 51 (51) | 31 (41) | 0 | 0 | 0 | 0.8 (5) |
| EC | 32 (38) | 49 (58) | 0 | 0.3 (2) | 0 | 3 (20) |
| WC | 28 (37) | 31 (34) | 2 (28) | 0.2 (2) | 0 | 0.3 (2) |
| NW | 44 (44) | 50 (50) | 0 | 0 | 0 | 9 (9) |
| Overall | 41 (48) | 38 (45) | 0.9 (10) | 0.1 (2) | 0 | 4 (16) |
2Average incidence of disease for all crops surveyed (disease incidence averaged across only fields with disease symptoms)
Source: Saskatchewan Pulse Disease Situation Report 2024 submitted to Western Forum on Pest Management by Alireza Akhavan from Saskatchewan Ministry of Agriculture
Table 3. Severity of Root Rot and Anthracnose in Saskatchewan Lentil Crops Surveyed in 2024
| Region | Root rot complex | Anthracnose |
| SW | 2.1 | 0.5 |
| SE | 1.9 | 0.7 |
| EC | 1.3 | 0.6 |
| WC | 1.3 | 0.3 |
| NW | 2.0 | 0.6 |
| Overall | 1.7 | 0.6 |
1Region: Southwest (SW); Southeast (SE); East Central (EC); West Central (WC); Northwest (NW).
Source: Saskatchewan Pulse Disease Situation Report 2024 submitted to Western Forum on Pest Management by Alireza Akhavan from Saskatchewan Ministry of Agriculture
Pea
In total, 40 field pea crops were surveyed in Saskatchewan in 2024. The highest number of surveyed crops were in Southwest, Southeast, and East-central Saskatchewan with 9 of the surveyed fields located in each of these three regions. The distribution of fields across the six regions in the province is described in Table 1. The survey was completed between July 9 and August 6. Crop growth stage ranged from R1 (flower bud) to R6 (mid maturity). Disease assessments were made by examining 10 plants from each of 5 sites along a W-pattern with at least 30m between sampling sites. Crops were assessed for the incidence of root rot complex (Aphanomyces euteiches, Fusarium spp., Rhizoctonia spp., and Pythium spp.), mycoshpaerella/ascochyta complex [Peyronellaea (Mycosphaerella) pinodes, Ascochyta pisi and Phoma medicaginis f.sp. pinodella], downy mildew (Peronospora viciae), white mould (Sclerotinia sclerotiorum) and bacterial blight (Pseudomonas syringae pv. pisi). The severity of the root rot complex and mycosphaerella/ascochyta blight complex was assessed for each plant. All disease assessments were made based on visual symptoms in the field. Unless requested by an individual surveyor for a specific sample, no additional testing was conducted to confirm diagnosis.
Root rot complex was present in 90% of the surveyed field pea crops with an average incidence of 57% across the province (Tables 1 and 2). Average disease incidence ranged from 35% (Northeast) to 66% (Southwest). Disease severity was generally low with an average severity of 2.2 across the province.
Mycoshpaerella/Ascochyta complex was present in 95% the surveyed fields and was assessed based on per cent of plant affected. Average incidence was 61% and ranged from 42% (Southwest) to 79% (East Central) and average severity was quite low at 1.8 across the province.
Downy mildew was present in 60% of the surveyed fields. Average incidence was 23%. White mould was not present in the surveyed fields this year.
Heavy infestation of rust (Uromyces sp.) was observed in one field in East Central in 2024. Septoria leaf blotch (Septoria pisi) symptoms were also observed in five fields in Southwest.
Symptoms consistent with bacterial blight were present in 35% of crops. Bacterial streaming test was conducted with a microscope on representative samples from a portion of assessed fields, but no additional testing was performed to identify/confirm the causal organism. Presence of this disease may be influenced by crop damage due to adverse weather in these regions.
Severity scale for root rot complex of field pea (modified from Chatterton et al. 2019)
| Rating | Lesions | % affected | Pruning |
|---|---|---|---|
| 1 | None | 0 | 0 |
| 2 | Small (<1cm), lesion near seed attachment | 0 | 0 |
| 3 | Small coalescing lesions approximately 180° around the stem | 10-20% | 0 |
| 4 | Lesions extending and completely encircling the stem | >20-95% | 5-20% |
| 5 | Increasingly discolored and extended epicotyl lesions | 100% | >20-50% |
| 6 | Epicotyl lesions encircling the stem extending up to 2 cm | 100% | >50-80% |
| 7 | Tap root (including epicotyl) completely lesioned | Dead | Dead |
Severity scale for mycosphaerella/ascochyta blight leaf rating of field pea (modified from Liu et al. 2013)
| Rating | Description |
|---|---|
| 1 | None |
| 2 | Mild to moderate disease on less than 5% of plant |
| 3 | Moderate to severe disease on ≥5-20% of plant |
| 4 | Moderate to severe disease symptoms on >20-50% of plant |
| 5 | Moderate to severe disease symptoms >50-80% of plant |
| 6 | Disease on all or most of the plant, plant stunted but alive |
| 7 | Plant stunted/dying |
Table 4. Prevalence of Disease in Saskatchewan Pea Crops Surveyed in 2024
| Region | Number of Fields Surveyed | Percent Prevalence (number of fields) | ||||
| Root rot complex | Mycosphaerella/Ascochyta complex | White mould | Downy Mildew | Bacterial blight | ||
| SE | 9 | 100 (9) | 100 (9) | 0 | 67 (6) | 44 (4) |
| SW | 9 | 78 (7) | 89 (8) | 0 | 11 (1) | 56 (5) |
| EC | 9 | 100 (9) | 100 (9) | 0 | 100 (9) | 0 |
| WC | 6 | 83 (5) | 100 (6) | 0 | 50 (3) | 50 (3) |
| NE | 4 | 100 (4) | 100 (4) | 0 | 100 (4) | 0 |
| NW | 3 | 67 (2) | 67 (2) | 0 | 33 (1) | 67 (2) |
| Overall | 40 | 90 (36) | 95 (38) | 0 | 60 (24) | 35 (14) |
Source: Saskatchewan Pulse Disease Situation Report 2024 submitted to Western Forum on Pest Management by Alireza Akhavan from Saskatchewan Ministry of Agriculture
Table 5. Incidence and Severity of Disease in Saskatchewan Pea Crops Surveyed in 2024
| Region | Root rot complex | Mycosphaerella/Ascochyta complex | White mould | Downy Mildew | Bacterial blight | ||
| Average Incidence (%) | Average Severity | Average Incidence (%) | Average Severity | Average Incidence (%) | Average Incidence (%) | Average Incidence (%) | |
| SE | 57 | 1.9 | 68 | 1.8 | 0 | 32 | 13 |
| SW | 66 | 2.6 | 42 | 1.5 | 0 | 1 | 10 |
| EC | 52 | 2.1 | 79 | 2.3 | 0 | 52 | 0 |
| WC | 59 | 2.3 | 48 | 1.9 | 0 | 12 | 11 |
| NE | 56 | 2 | 77 | 1.8 | 0 | 15 | 0 |
| NW | 35 | 2.1 | 55 | 1.6 | 0 | 9 | 3 |
| Province | 57 | 2.2 | 61 | 1.8 | 0 | 23 | 7 |
Source: Saskatchewan Pulse Disease Situation Report 2024 submitted to Western Forum on Pest Management by Alireza Akhavan from Saskatchewan Ministry of Agriculture
Dry Bean
A total of 10 irrigated dry bean fields were surveyed and assessed for disease incidence and severity in Saskatchewan. The survey was completed between August 7th and 20th while crops were between growth stage R4 (full pod) to R6 (50% seed). Ten plants were assessed for the incidence and severity of diseases at five sites located in a W-pattern (at total of 50 plants per field). Individual sites were at least 30m apart and located at least 50m from the field edge. Each of the 50 plants were assessed for the presence of the following diseases: bacterial blight complex (Pseudomonas syringae pv. syringae, Xanthomonas axonopodis pv. phaseoli, and Pseudomonas syringae pv. phaseolicola), Sclerotinia Stem Rot (Sclerotinia sclerotiorum), anthracnose (Colletotrichum lindemuthianum) and root rot complex (Fusarium spp / Pythium spp. / Rhizoctonia solani etc.). Disease severity was also assessed for root rot using the pea root rot scale and bacterial blight complex. The type of the bacterial blight was confirmed in each field using symptom analysis and plating at the Crop Protection Laboratory. All other disease assessments were made based on visual symptoms in the field.
The most prevalent disease in Saskatchewan was bacterial blight complex which was found in every field surveyed with an average incidence of 66% and the average severity of 0.7 on a 0 to 5 rating scale (Table 6). Bacterial brown spot and common bacterial blight were found in 7 and 6 of the survey fields while halo blight was found in 3 of the assessed fields.
Symptoms consistent with anthracnose were observed in five of the surveyed crops with an average incidence of 5 %.
Root rot complex symptoms were present in three of the surveyed crops with an average incidence of 7% across the surveyed crops. Disease severity was low with an average severity of 1.1 across all the surveyed fields.
Symptoms suggesting viral diseases were common and found in seven of the assessed fields.
Severity scale for bacterial blight complex (modified from A. Xue)
| Rating | Description |
|---|---|
| 0 | no observed lesions or other signs of infection |
| 1 | < 5% of plant area (leaf and stem-hypocotyl) diseased |
| 2 | 5- <10 % of plant area diseased |
| 3 | 10- <25 % of plant area diseased |
| 4 | 25- <50 % of plant area diseased |
| 5 | 50-100 % of plant area diseased |
Table 6. Prevalence, Incidence, and Severity of Saskatchewan Dry Bean Crops Surveyed in 2024
| Disease | Prevalence (%)1 | Average Incidence (%)2 | Average Severity3 |
| Bacterial blight complex | 100 | 66 | 0.7 |
| Anthracnose | 50 | 5 | Not Assessed |
| Sclerotinia stem rot | 0 | 0 | Not Assessed |
| Root rot complex | 30 | 7 | 1.1 |
1Prevalence = the percent of crops surveyed with symptoms of the disease
2Average incidence of the disease averaged across all the surveyed crops.
3Average severity across all the surveyed crops.
Report on Faba Bean Foliar Disease Survey in Saskatchewan and Manitoba in 2024
Kazi Kader, Syama Chatterton, Ahmed Abdelmagid
In 2024, researchers conducted a survey to study foliar diseases in faba bean fields across Saskatchewan and Manitoba. The survey aimed to understand how common certain diseases were in faba beans and identify the pathogens causing them. Researchers collected leaf samples from 36 different fields (23-SK, 13-MB) at mid-pod stage (late July to mid-August). Fields surveyed were rated on a 1-5 scale where 1: healthy plants and 5: extensive lesions on leaves, stems, pods cover >10% leaf surface, severe defoliation. The primary diseases found were Chocolate Spot (Botrytis spp.), Alternaria Leaf Spot (Alternaria alternata), and Stemphylium Blight (Stemphylium spp.). Botrytis cinerea and B. fabae were found in 35% and 8.7% of samples from SK, respectively, and 46% and 0% of samples from MB, respectively. Alternaria alternata and Stemphylium spp. were detected on 100% of samples. Colletotrichum lentil and Ascochyta fabae were not identified in any of the samples from the 36 locations.
Table 7. Summary of foliar faba bean disease survey results for SK and MB in 2024
| Province | # fields surveyed | Average disease severity | Prevalence | |||
| Chocolate Spot | Alternaria leaf spot | Stemphylium blight | ||||
| Botrytis fabae | Botrytis cinerea | |||||
| Saskatchewan | 23 | 2.0 | 8.7% | 35% | 100% | 100% |
| Manitoba | 13 | 2.2 | 0 | 46% | 100% | 100% |
Insect Surveys
Various insect surveys were coordinated by Saskatchewan Ministry of Agriculture, Saskatchewan Crop Insurance Corporation, Agriculture and Agri-Food Canada and the University of Saskatchewan, results are presented below along with comments.
Source: Saskatchewan Provincial Insect and Pest Report 2024 submitted to Western Forum on Pest Management by James Tansey, Saskatchewan Ministry of Agriculture.
Grasshoppers (various species)
2023 saw a heavy population of grasshoppers across the province and a hot, dry summer and long, open fall allowed for a quick progression through their lifecycle and uninterrupted egg laying. In the spring of 2024, reports of large numbers of eggs in several regions and damaging populations of nymph grasshoppers came in from the southwest, Eyebrow, and Central Butte areas. The survey for grasshoppers was conducted on 1137 sites throughout the province from July to September. Populations greater than 10/m2 were reported at more than 50 sites and only 28 sites had no grasshoppers detected. Cool, wet conditions in the spring greatly delayed development and emergence and the fungal pathogen Entomophthora grylii was reported to be affecting nymphs. Reports of feeding damage in lentils in the central areas and seedling damage in chickpeas in the southwest.
Source: Saskatchewan Provincial Insect and Pest Report 2024 submitted to Western Forum on Pest Management by James Tansey, Saskatchewan Ministry of Agriculture.
Pea Leaf Weevil (Sitona lineatus (L.))
Pea leaf weevil populations were surveyed again in 2024 and expanded further north and included more sites than in previous years. This invasive insect continues to expand its range in the north and east. Populations were detected in a large region extending from the east to northwestern pea production areas. Feeding pressure was reported in faba beans in the northwest. Pea and faba growers in these areas should consider the use of insecticidal seed treatments to limit damage. Neonicotinoid seed treatments remain the best protection against the pea leaf weevil larvae when adult numbers warrant.
Pea Aphids (Acyrthosiphon pisum (Harr.))
Heavy populations of pea aphid were reported across the province with thresholds exceeding damaging levels in a very short amount of time in mid-July. Multiple insecticide applications were reported across the province and poor performance of lambda-cyhalothrin products was reported at numerous sites. Dr. James Tansey (Saskatchewan Agriculture) initiated the development of an in-field test kit in collaboration with Dr. Tyler Wist (AAFC), Dr. Sean Prager (U of S), Tyler Hartl (U of S), and Mike Brown (SPG). Results indicated reduced susceptibility of field populations to lambda-cyhalothrin products relative to a susceptible laboratory colony. Work will continue in monitoring for insensitivity.
New thresholds for pea aphids in lentils and faba beans have been released through work conducted by Ningxing Zhou in the Prager lab, Dr. Wist, and Dr. Prager. Economic threshold (ET) in lentils are 20 to 66 aphids per sweep which provides a 7-day lead time before reaching the economic injury level (EIL) of 78 aphids per sweep. In faba’s, the ET is 34 to 50 aphids per main stem which provides a 7-day lead time before hitting the EIL of 96 to 142 aphids per main stem. The faba bean thresholds are applicable to both tannin and low tannin varieties.
Lygus (Lygus spp.)
Work conducted by Teresa Aguiar-Cordero in the Prager lab, Dr. Hector Carcamo, and Dr. Prager looked at lygus bugs and the crop damage and quality loss attributed to them in faba beans. The study looked at preferences between faba bean and other alternative crops while also doing a sex-based analysis on preferences. One adult lygus was caged on faba and allowed to feed at the R4-R5 growth stage for 1, 3, 24, and 48 hours. Nymphs were found to feed the longest and highlights the importance of early intervention, the Canadian Grain Commissions 1% perforation standard can be reached within 3 hours of feeding. In the sex-based analysis, females preferred to feed on pods with immatures seeds while males preferred fully developed seeds and in the crop choice, males preferred faba over canola, while females preferred canola over faba, however, both preferred alfalfa over any other crop.
Seed Quality Survey
The interim results (as of December 20, 2024) of commercial plate tests for seed-borne pathogens of 298 field pea, 379 lentil, and 83 chickpea samples are summarized in Tables 8-9. The ten-year summary of the seed quality survey in Table 9 shows 2024 interim data compared to 2015-2023 results. The number of pathogen-free samples (PFS) continues to be very high across key seed-borne diseases evaluated in field pea, lentil, and chickpea samples with the exception of Ascochyta in field pea at 36.4% PFS. Alternatively, 98.0% of lentil samples assessed for Ascochyta were pathogen-free. The 2024 interim data for Ascochyta in chickpea indicates a higher proportion of PFS and lower mean infection level relative to 2015-2023 data with 2024 having the lowest mean infection over the past ten years at 0.3% and second highest amount of PFS, second only to 2017 (97.2%). Ascochyta in lentil is above the ten year average for PFS and tested low for mean infection. Ascochyta in pea is below the ten year average for PFS but is below the average in mean infection. Anthracnose in lentil is strong again this year at 10% higher PFS compared to the ten year average and mean infection 0.2% lower. Read this factsheet to learn more about seed tests and how they can benefit your farm operation.
Table 8. 2024 Saskatchewan Seed Sample Interim Results by Crop District for Seed-Borne Ascochyta and Anthracnose
| Crop District | Lentil | Field Pea | Chickpea | |||||
| Ascochyta | Anthracnose | Ascochyta | Ascochyta | |||||
| % PFS1 | Mean2 | % PFS | Mean | % PFS | Mean | % PFS | Mean | |
| 1A | 100 | 0 | 83.3 | 0.5 | 83.3 | 0.5 | 100 | 0 |
| 1B | 0 | 0 | 100 | 0 | 100 | 0 | 0 | 0 |
| 2A | 100 | 0 | 91.7 | 0.5 | 91.7 | 0.5 | 100 | 0 |
| 2B | 100 | 0 | 66.7 | 0.5 | 66.7 | 0.5 | 100 | 0 |
| 3AN | 100 | 0 | 100 | 0 | 100 | 0 | 83.3 | 2.5 |
| 3AS | 100 | 0 | 90.9 | 0.5 | 90.9 | 0.5 | 94.7 | 0.5 |
| 3BN | 100 | 0 | 30.8 | 1 | 30.8 | 1 | 100 | 0 |
| 3BS | 100 | 0 | 0 | 1.5 | 0 | 1.5 | 75 | 0.3 |
| 4A | 0 | 0.3 | 100 | 0 | 100 | 0 | 0 | 0 |
| 4B | 100 | 0 | 37.5 | 3.5 | 37.5 | 3.5 | 100 | 0 |
| 5A | 100 | 0 | 0 | 0 | 0 | 0 | 0 | 0 |
| 5B | 0 | 0 | 11.1 | 2 | 11.1 | 2 | 0 | 0 |
| 6A | 100 | 0 | 23.1 | 1.5 | 23.1 | 1.5 | 50 | 0.3 |
| 6B | 91.2 | 0.3 | 15.7 | 2 | 15.7 | 2 | 64.7 | 0.5 |
| 7A | 98.1 | 0.3 | 0 | 1.8 | 0 | 1.8 | 75 | 0.5 |
| 7B | 100 | 0 | 30 | 1.4 | 30 | 1.4 | 0 | 0 |
| 8A | 0 | 0 | 18.2 | 2.5 | 18.2 | 2.5 | 0 | 0 |
| 8B | 100 | 0 | 39.1 | 1.7 | 39.1 | 1.7 | 0 | 0 |
| 9A | 100 | 0 | 23.1 | 1.4 | 23.1 | 1.4 | 0 | 0 |
| 9B | 100 | 0 | 45.5 | 1.5 | 45.5 | 1.5 | 0 | 0 |
| Total | 98 | 0.3 | 36.4 | 1.8 | 36.4 | 1.8 | 84.8 | 0.3 |
1 PFS – percent of samples that are pathogen-free (pathogen-free samples)
2 Mean – average infection level of samples with disease
Source of interim seed quality data for 2024: Prairie Diagnostic Seed Lab, Weyburn, SK; 20/20 Seed Labs Inc., Nisku, AB; Discovery Seed Labs Ltd., Saskatoon, SK; SGS Canada, Sherwood Park, AB.
Table 9. Ten-Year Summary of Pulse Seed Samples Tested at Accredited Labs from Seed Grown From 2015-2024 in Saskatchewan (2024 data is interim results as of December 20, 2024)
| Crop | Pathogen | 2015 | 2016 | 2017 | 2018 | 2019 | 2020 | 2021 | 2022 | 2023 | 10 Yr Avg | 2024 (int.) | |||||||||||
| PFS1 | Mean2 | PFS | Mean | PFS | Mean | PFS | Mean | PFS | Mean | PFS | Mean | PFS | Mean | PFS | Mean | PFS | Mean | PFS | Mean | PFS | Mean | ||
| (%) | |||||||||||||||||||||||
| Lentil | Ascochyta | 98.5 | 0.1 | 97.8 | 0.4 | 98.1 | 0.9 | 98 | 0.4 | 95.5 | 0.8 | 97.9 | 0.5 | 99.3 | 0.4 | 91.8 | 0.4 | 96.6 | 0.4 | 97.1 | 0.5 | 98 | 0.3 |
| Anthracnose | 72.4 | 1 | 60.4 | 0.8 | 95.1 | 0.7 | 94.1 | 0.5 | 89.2 | 0.9 | 85.3 | 1.2 | 97.2 | 0.9 | 85.6 | 1.1 | 96.4 | 0.6 | 86.2 | 0.9 | 96.2 | 0.7 | |
| Botrytis | 54.8 | 1.8 | 14.8 | 3.3 | 90.3 | 1.1 | 96.2 | 1 | 93.2 | 1 | 95.9 | 0.8 | 98.5 | 0.5 | 97.7 | 0.9 | 98.8 | 0.6 | 82.2 | 1.2 | 96 | 0.5 | |
| Sclerotinia | 90.3 | 0.4 | 33.3 | 1 | 95.4 | 0.8 | 97.7 | 0.5 | 96 | 0.7 | 97.8 | 0.5 | 99.8 | 0.3 | 97.7 | 0.7 | 99.3 | 0.6 | 89.7 | 0.6 | 97.5 | 0.5 | |
| Pea | Ascochyta | 36.5 | 2.4 | 8.4 | 5.4 | 66.4 | 1.6 | 59 | 2.4 | 36.3 | 4.7 | 33.9 | 2.8 | 75.9 | 1.2 | 53.6 | 1.6 | 61.8 | 1.7 | 48.0 | 2.6 | 36.4 | 1.8 |
| Botrytis | 74.8 | 1.6 | 61.1 | 0.9 | 93.3 | 0.6 | 99.1 | 0.9 | 93.6 | 1 | 93.6 | 0.8 | 99.5 | 0.6 | 96.8 | 0.9 | 99.7 | 0.5 | 90.2 | 0.9 | 91.7 | 0.6 | |
| Sclerotinia | 90.6 | 0.3 | 78.3 | 0.7 | 98.5 | 0.4 | 99.2 | 0.6 | 99 | 0.6 | 99.1 | 0.6 | 100 | 0 | 97.3 | 1.1 | 99.4 | 0.5 | 95.7 | 0.5 | 94 | 0.5 | |
| Chickpea | Ascochyta | 40 | 4.1 | 65.6 | 4.7 | 97.2 | 0.6 | 74.9 | 1.2 | 51.3 | 3.2 | 44.1 | 3.2 | 71.6 | 0.7 | 62.2 | 1.4 | 85 | 0.4 | 65.8 | 2.2 | 84.8 | 0.3 |
| Botrytis | 42.4 | 3.8 | 37 | 8.4 | 100 | 0 | 96.3 | 1.1 | 86.6 | 1.9 | 87.1 | 1.1 | 96.7 | 0.4 | 98.7 | 0.8 | 99.4 | 0.3 | 82.7 | 2.0 | 93.2 | 3.4 | |
| Sclerotinia | 83.3 | 0.5 | 74.1 | 2 | 100 | 0 | 98.1 | 2.2 | 89.8 | 0.9 | 99.3 | 0.3 | 98.7 | 0.7 | 100 | 0 | 100 | 0 | 93.7 | 0.7 | 98.6 | 0.3 | |
1 PFS – percent of samples that are pathogen-free (pathogen-free samples)
2 Mean – average infection level of samples with disease
Source: Saskatchewan Pulse Growers
Acknowledgements
Saskatchewan Pulse Growers would like to thank the many people that helped with the coordination and carrying out of the surveys including: Saskatchewan Ministry of Agriculture, Saskatchewan Crop Insurance Corporation, Saskatchewan Association of Rural Municipalities Plant Health Officers, Agriculture and Agri-Food Canada, University of Saskatchewan, and the many industry partners and agronomists. Thank you to those growers who signed up their fields to allow the surveys to be completed.
Contributors/Authors:
- 20/20 Seed Labs Inc. (Nisku, AB)
- Ahmed Abdelmagid, Agriculture and Agri-Food Canada
- Brian Olson, contractor for seed quality survey
- Carter Peru, Saskatchewan Ministry of Agriculture
- Discovery Seed Labs Ltd. (Saskatoon, SK)
- Dr. Alireza Akhavan, Saskatchewan Ministry of Agriculture
- Dr. James Tansey, Saskatchewan Ministry of Agriculture
- Dr. Michelle Hubbard, Agriculture and Agri-Food Canada
- Dr. Syama Chatterton, Agriculture and Agri-Food Canada
- Kazi Kader, Agriculture and Agri-Food Canada
- Prager Lab, University of Saskatchewan
- Mike Brown, Saskatchewan Pulse Growers
- Prairie Diagnostic Seed Lab (Weyburn, SK)
- SGS Canada (Sherwood Park, AB)
To understand the risks and potential damage associated with these pests, the Ministry of Agriculture and its partners monitor the presence, abundance and impact of important crop pests in Saskatchewan. This information is used to build forecast maps and make recommendations for control. Data from the pest surveys are archived and used as a reference to see historical trends that can be used to guide research initiatives or identify changes in pest pressure. Pest-related research is also supported through pest surveys via the collection of samples used by researchers in studies.
To participate in the survey program, enroll your farm today via this online sign-up form.
Published March 2025