By Marlene Boersch, Mercantile Consulting Venture Inc
July 2024
Statistics Canada (StatCan) published their estimates of principal field crop areas for the year 2024 on June 27. The report again showed significant changes from their March acreage estimates for a number of crops, including for pulses. The table below gives an overview of how the numbers evolved for the 2024 crop.
| Crop | 2021 | 2022 | 2023 | StatCan June 27, 2024 Estimate | Previous (March) StatCan Estimate | Mercantile Projection, 2024 | StatCan June Estimate (% of previous year) | Acreage Change from 2023 |
|---|---|---|---|---|---|---|---|---|
| Chickpeas | 221,950 | 233,800 | 315,500 | 453,500 | 400,000 | 380,000 | 144% | 138,000 |
| Lentils | 4,200,686 | 4,321,300 | 3,668,500 | 4,210,100 | 3,828,900 | 4,100,000 | 115% | 541,600 |
| Peas | 3,854,729 | 3,368,100 | 3,047,600 | 3,211,500 | 3,121,900 | 3,108,552 | 105% | 163,900 |
| Total | 8,277,365 | 7,923,200 | 7,031,600 | 7,875,100 | 7,350,800 | 7,588,552 | 843,500 |
Source: Statistics Canada and own numbers
Importantly, the June 27 report asserts a much bigger acreage recovery for pulse crops than the March report. The area increase for pulses amounts to almost 850,000 acres, led by lentils with a 542,000 acre surge over last year. Pea acres increased as well, but more modestly by 165,000 acres.
The solid increase in lentil acres makes some sense as return per acre comparisons based on forward prices for potential crops in Saskatchewan during the late winter/spring planning period consistently showed lentils among the top contenders, especially for green lentils, where prices have been at all-time highs for some time. Even the less expensive red lentil values were enough to keep potential returns to reds above those for canola and durum wheat. In this context, the 15% increase in lentil acres over last year’s that StatCan is showing make sense. However, Mercantile was and is a little more conservative on acres than StanCan because of lingering disease concerns that will only be harnessed by addressing rotational issues. We also note that the trade’s pre-report estimates for lentil acres came in at 4 million tonnes, albeit with a very wide range of estimates (3.5 – 4.3 million acres).
A look at historic Canadian lentil acres also shows that while acres are far lower than the 5.6 million acre record set in 2016, this year’s increase in acres keeps lentil acres within a new 8-year range of 3.7 to 4.4 million acres. Most of the lentil acreage still is concentrated in Saskatchewan, with Alberta contributing 12-13% of total acreage over the past several years.
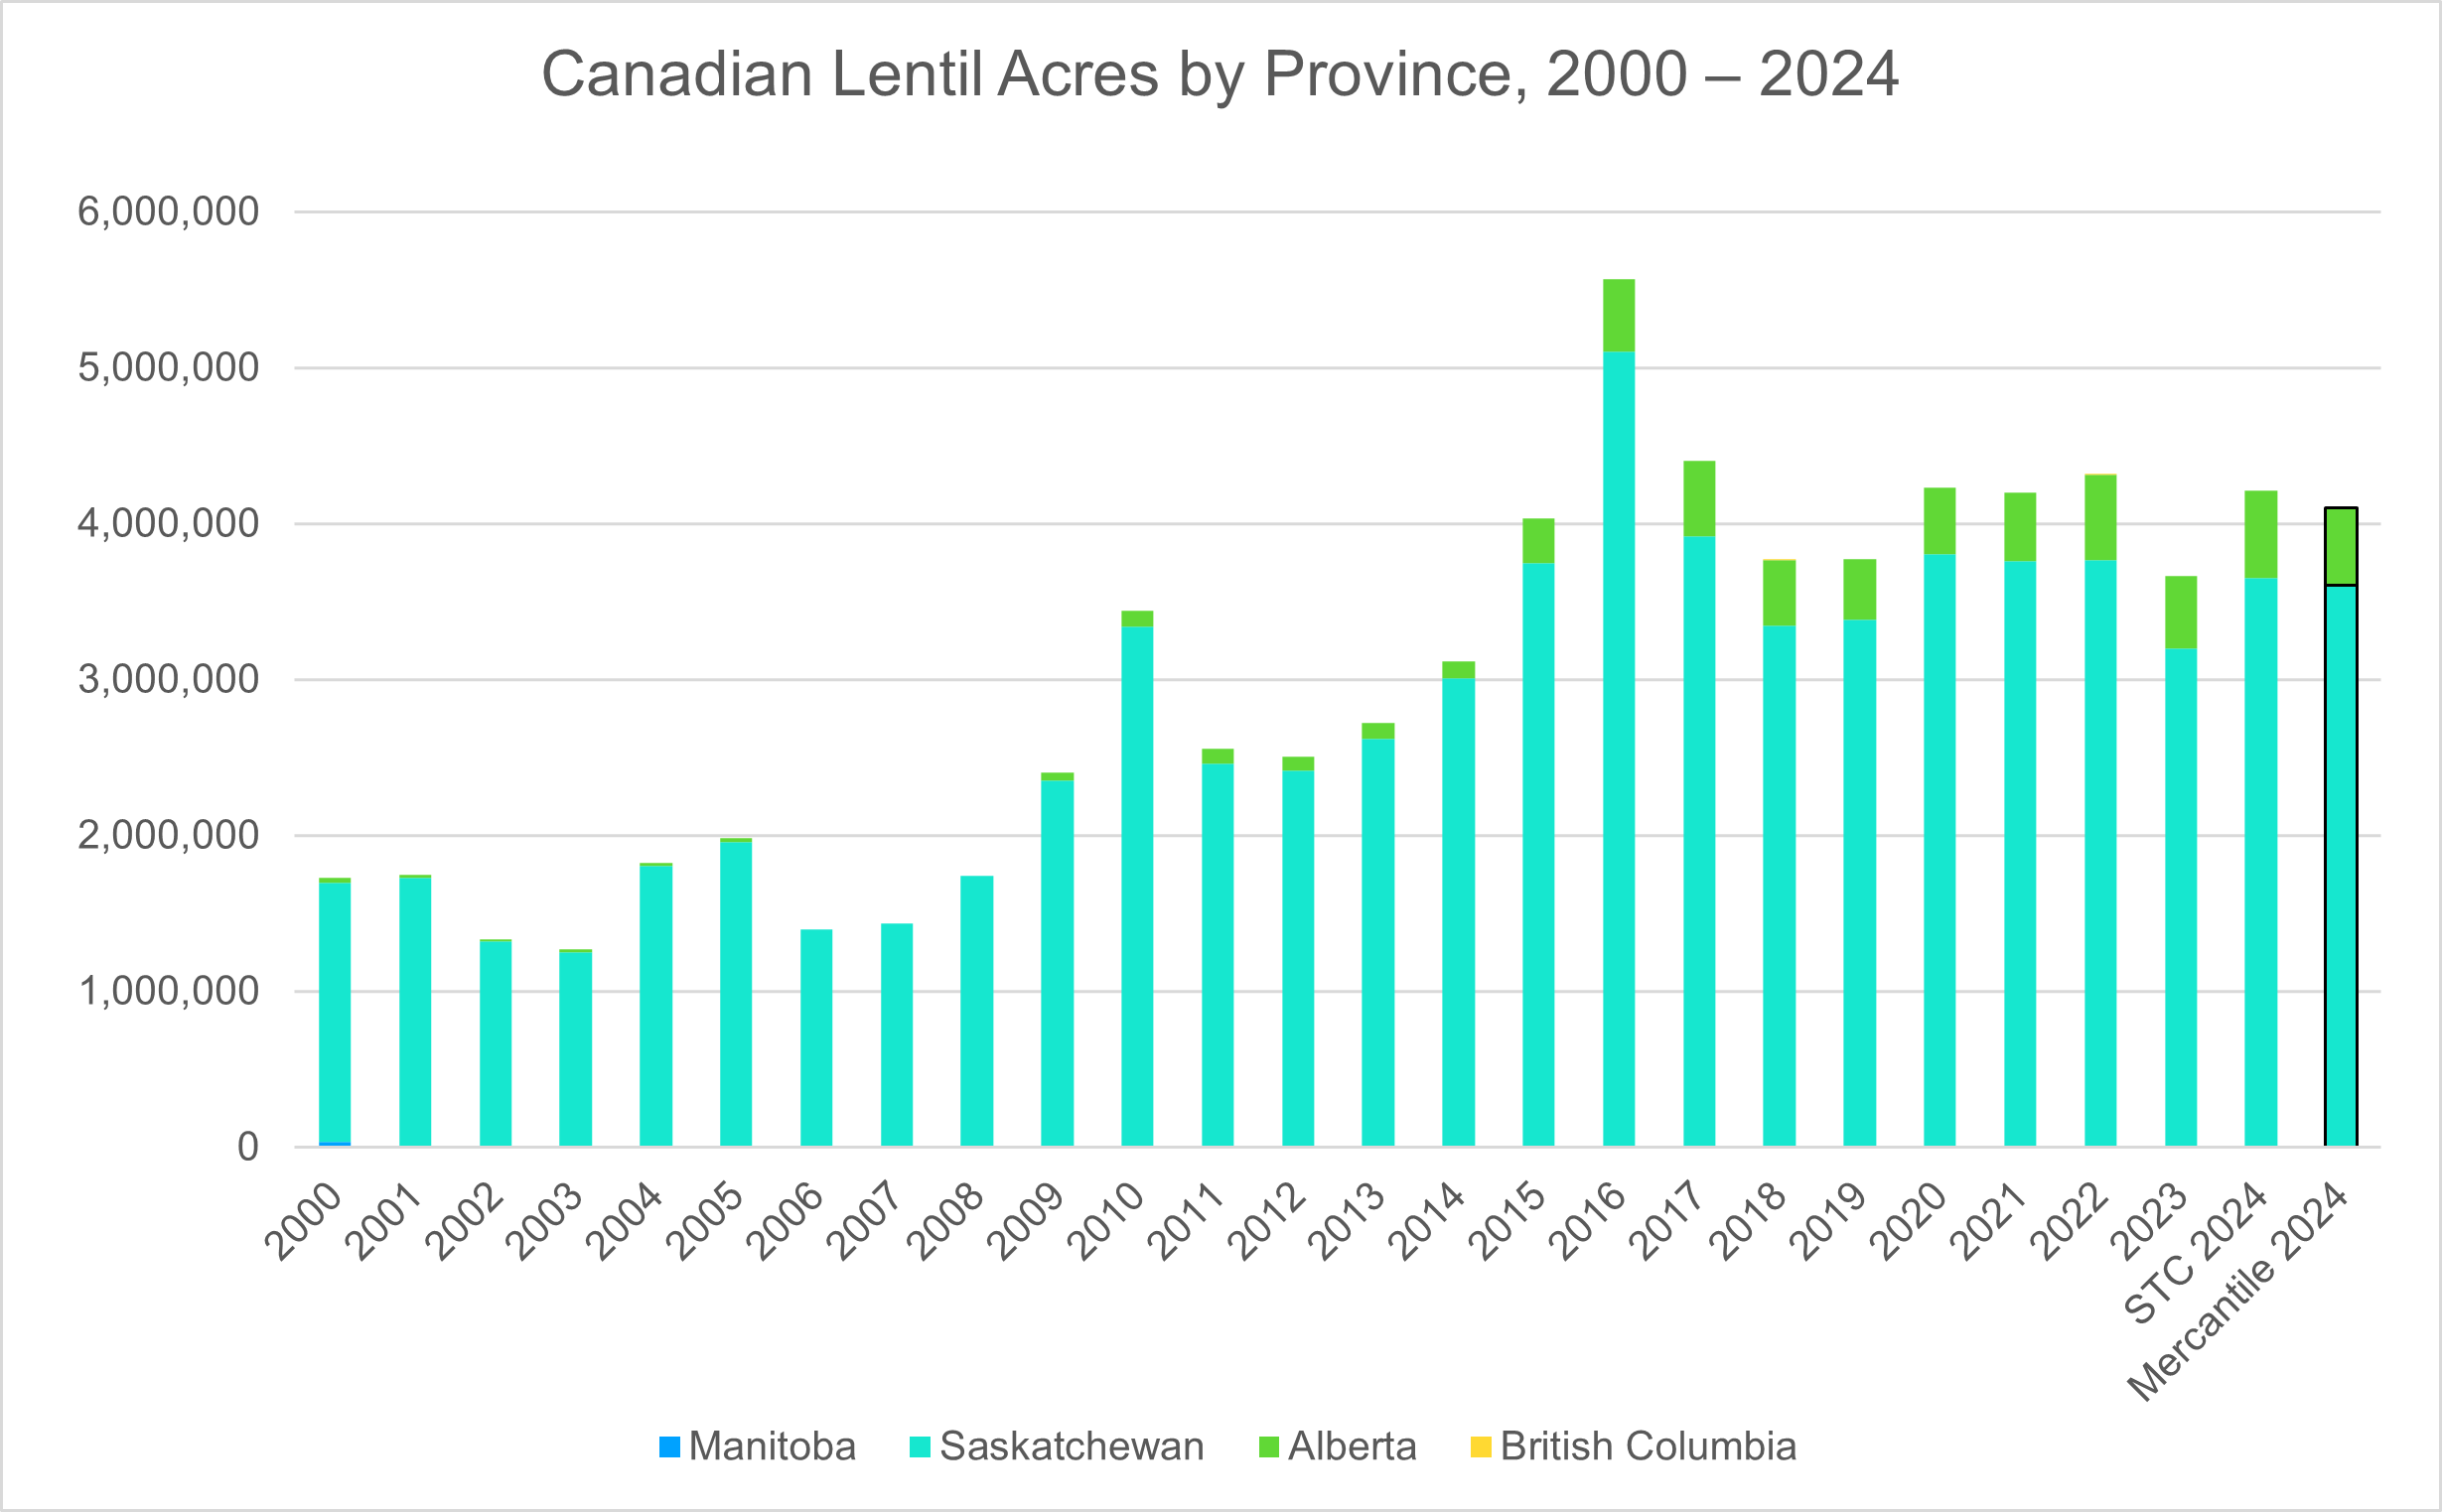
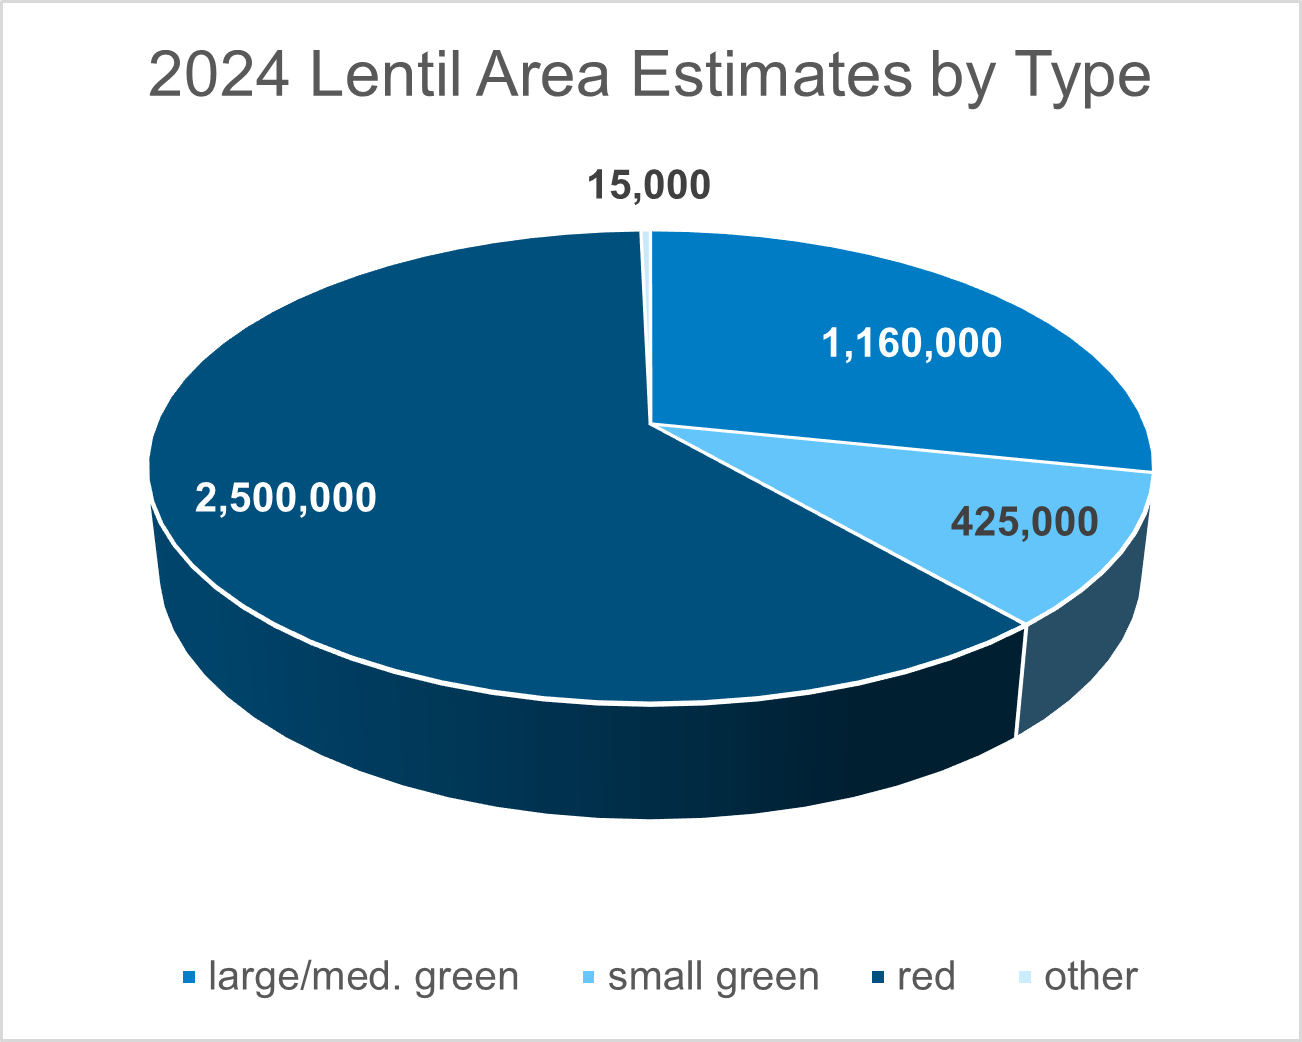
What has changed is the type of lentils grown. While there are no firm numbers on acres by type, we estimate that green lentil acres have increased to ~38% (28% large/medium greens and 10% small greens), while the red lentil acreage percentage has dropped a little to ~61%. This change was induced by the favourable market prices of greens over reds.
What does the sizeable 15% increase in lentil acres mean within the context of this year’s markets? Assuming somewhat better than average yields (as conditions look favourable at this time), we expect roughly a 2.3 million tonne Canadian lentil production. The StatCan numbers against current Agriculture & Agri-food Canada (AAFC) projections yield about the same outcome. Carry-in stocks in Canada from last crop year will not be burdensome (50,000 – 100,000 tonnes), nor will they be burdensome in Australia, our main competitor in red lentil markets.
On the demand side, global demand for lentils has proven to be very solid. Indeed, it has been able to absorb the big 1 million tonne increase in Australian lentil production over the past five years to about 1.6 million tonnes without major pressure on values or any increases in global ending stocks. However, the increase of Australian participation in the markets has led to a reduction in Canadian market share in the red lentil markets. Additional suppliers trying to exert an influence in the markets are Turkey, Russia, and Kazakhstan. We estimate Turkey’s production at 350,000 tonnes, the combined Black Sea lentil production at ~300,000 tonnes.
The big buyers have been India, Turkey, Pakistan, the United Arab Emirates (UAE), Bangladesh. We have no reason to believe demand from the main destinations will dry up or fall significantly in the coming crop year. Given green lentil supply has been tight leaving buyers without buffer stocks, we expect green lentil demand to be solid as well, although export demand for greens is unlikely to exceed 560,000 tonnes.
Canada is poised to export about 1.65 million tonnes in 2023/24, down from 2.2 million tonnes the year prior. The reduction this year was due to lower supplies. We project Canadian exports for 2024/25 to rise to 2 million tonnes, which would leave a carryout of ~150,000 tonnes, a moderate 7% stock-use ratio. We expect lentil markets to remain solid for the 2024 crop and well-balanced between supply and demand. Our numbers indicate that red lentils might become the tightest type of lentil this year.
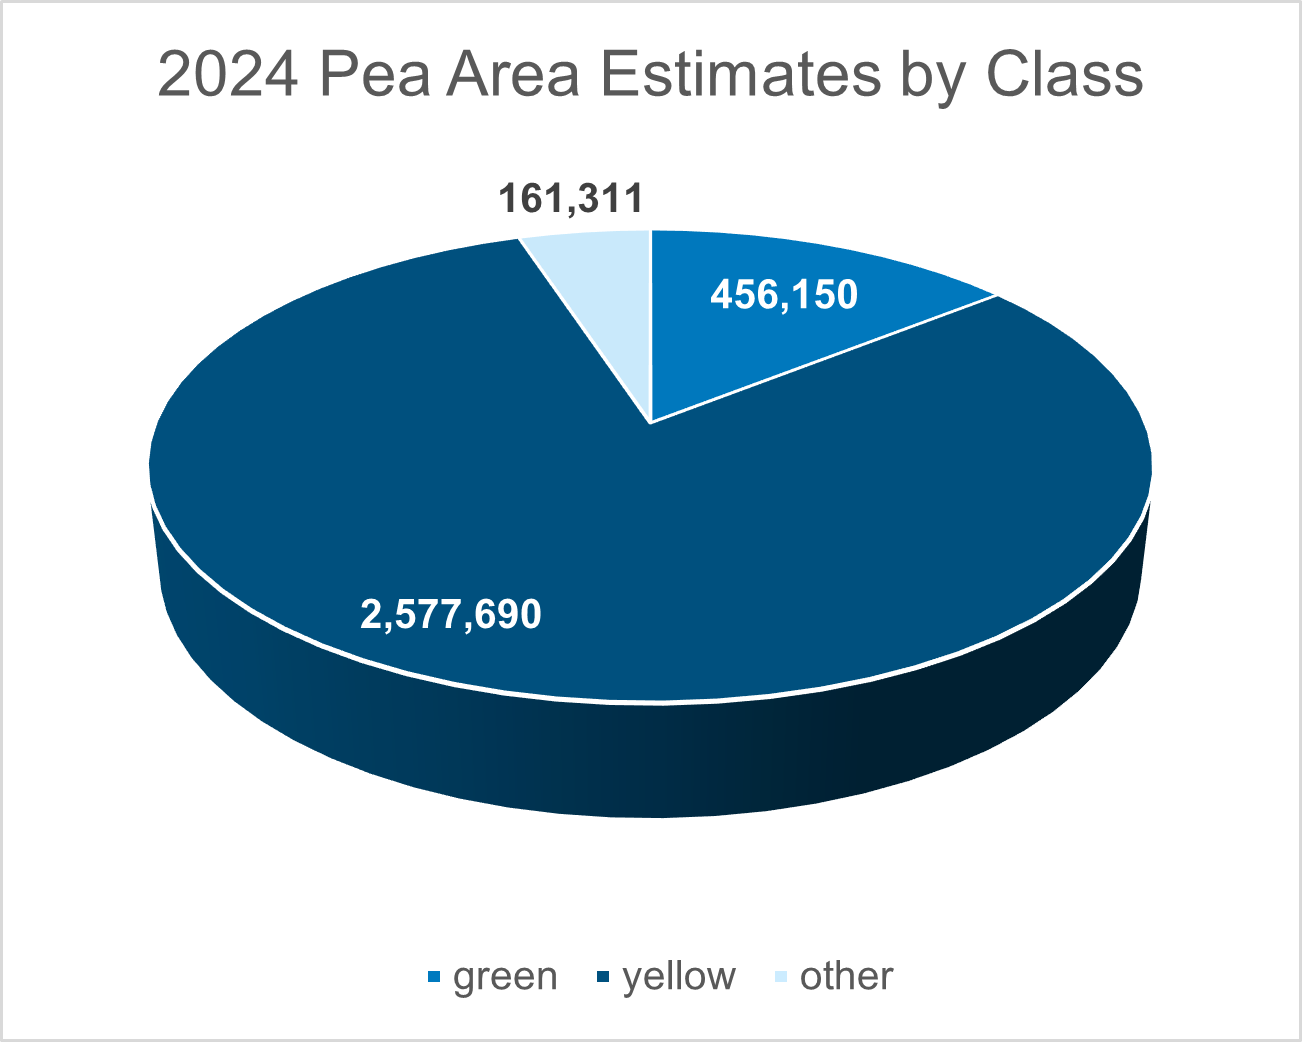
Turning to pea acres, StatCan showed a 5% increase in acres to 3.21 million acres in the June report, up from the 3.12 million acre estimate in March (+2.4%). The trade’s pre-report estimate for pea acres was at 3.28 million acres. Given the tepid forward pricing in the winter/spring, especially of yellow peas, we would be surprised if pea acres increased very significantly, although – thanks to changes to India’s import policies – the movement of peas has been very good relative to production. Yellow pea forward prices generally ranked well below canola and spring wheat returns. Green pea prices fared better, and we expect that the percentage of green pea acres has increased to 14 – 15%, or roughly 460,000 acres. This up by more than 100,000 acres from last year, but still well below the green pea acreage a few years ago.
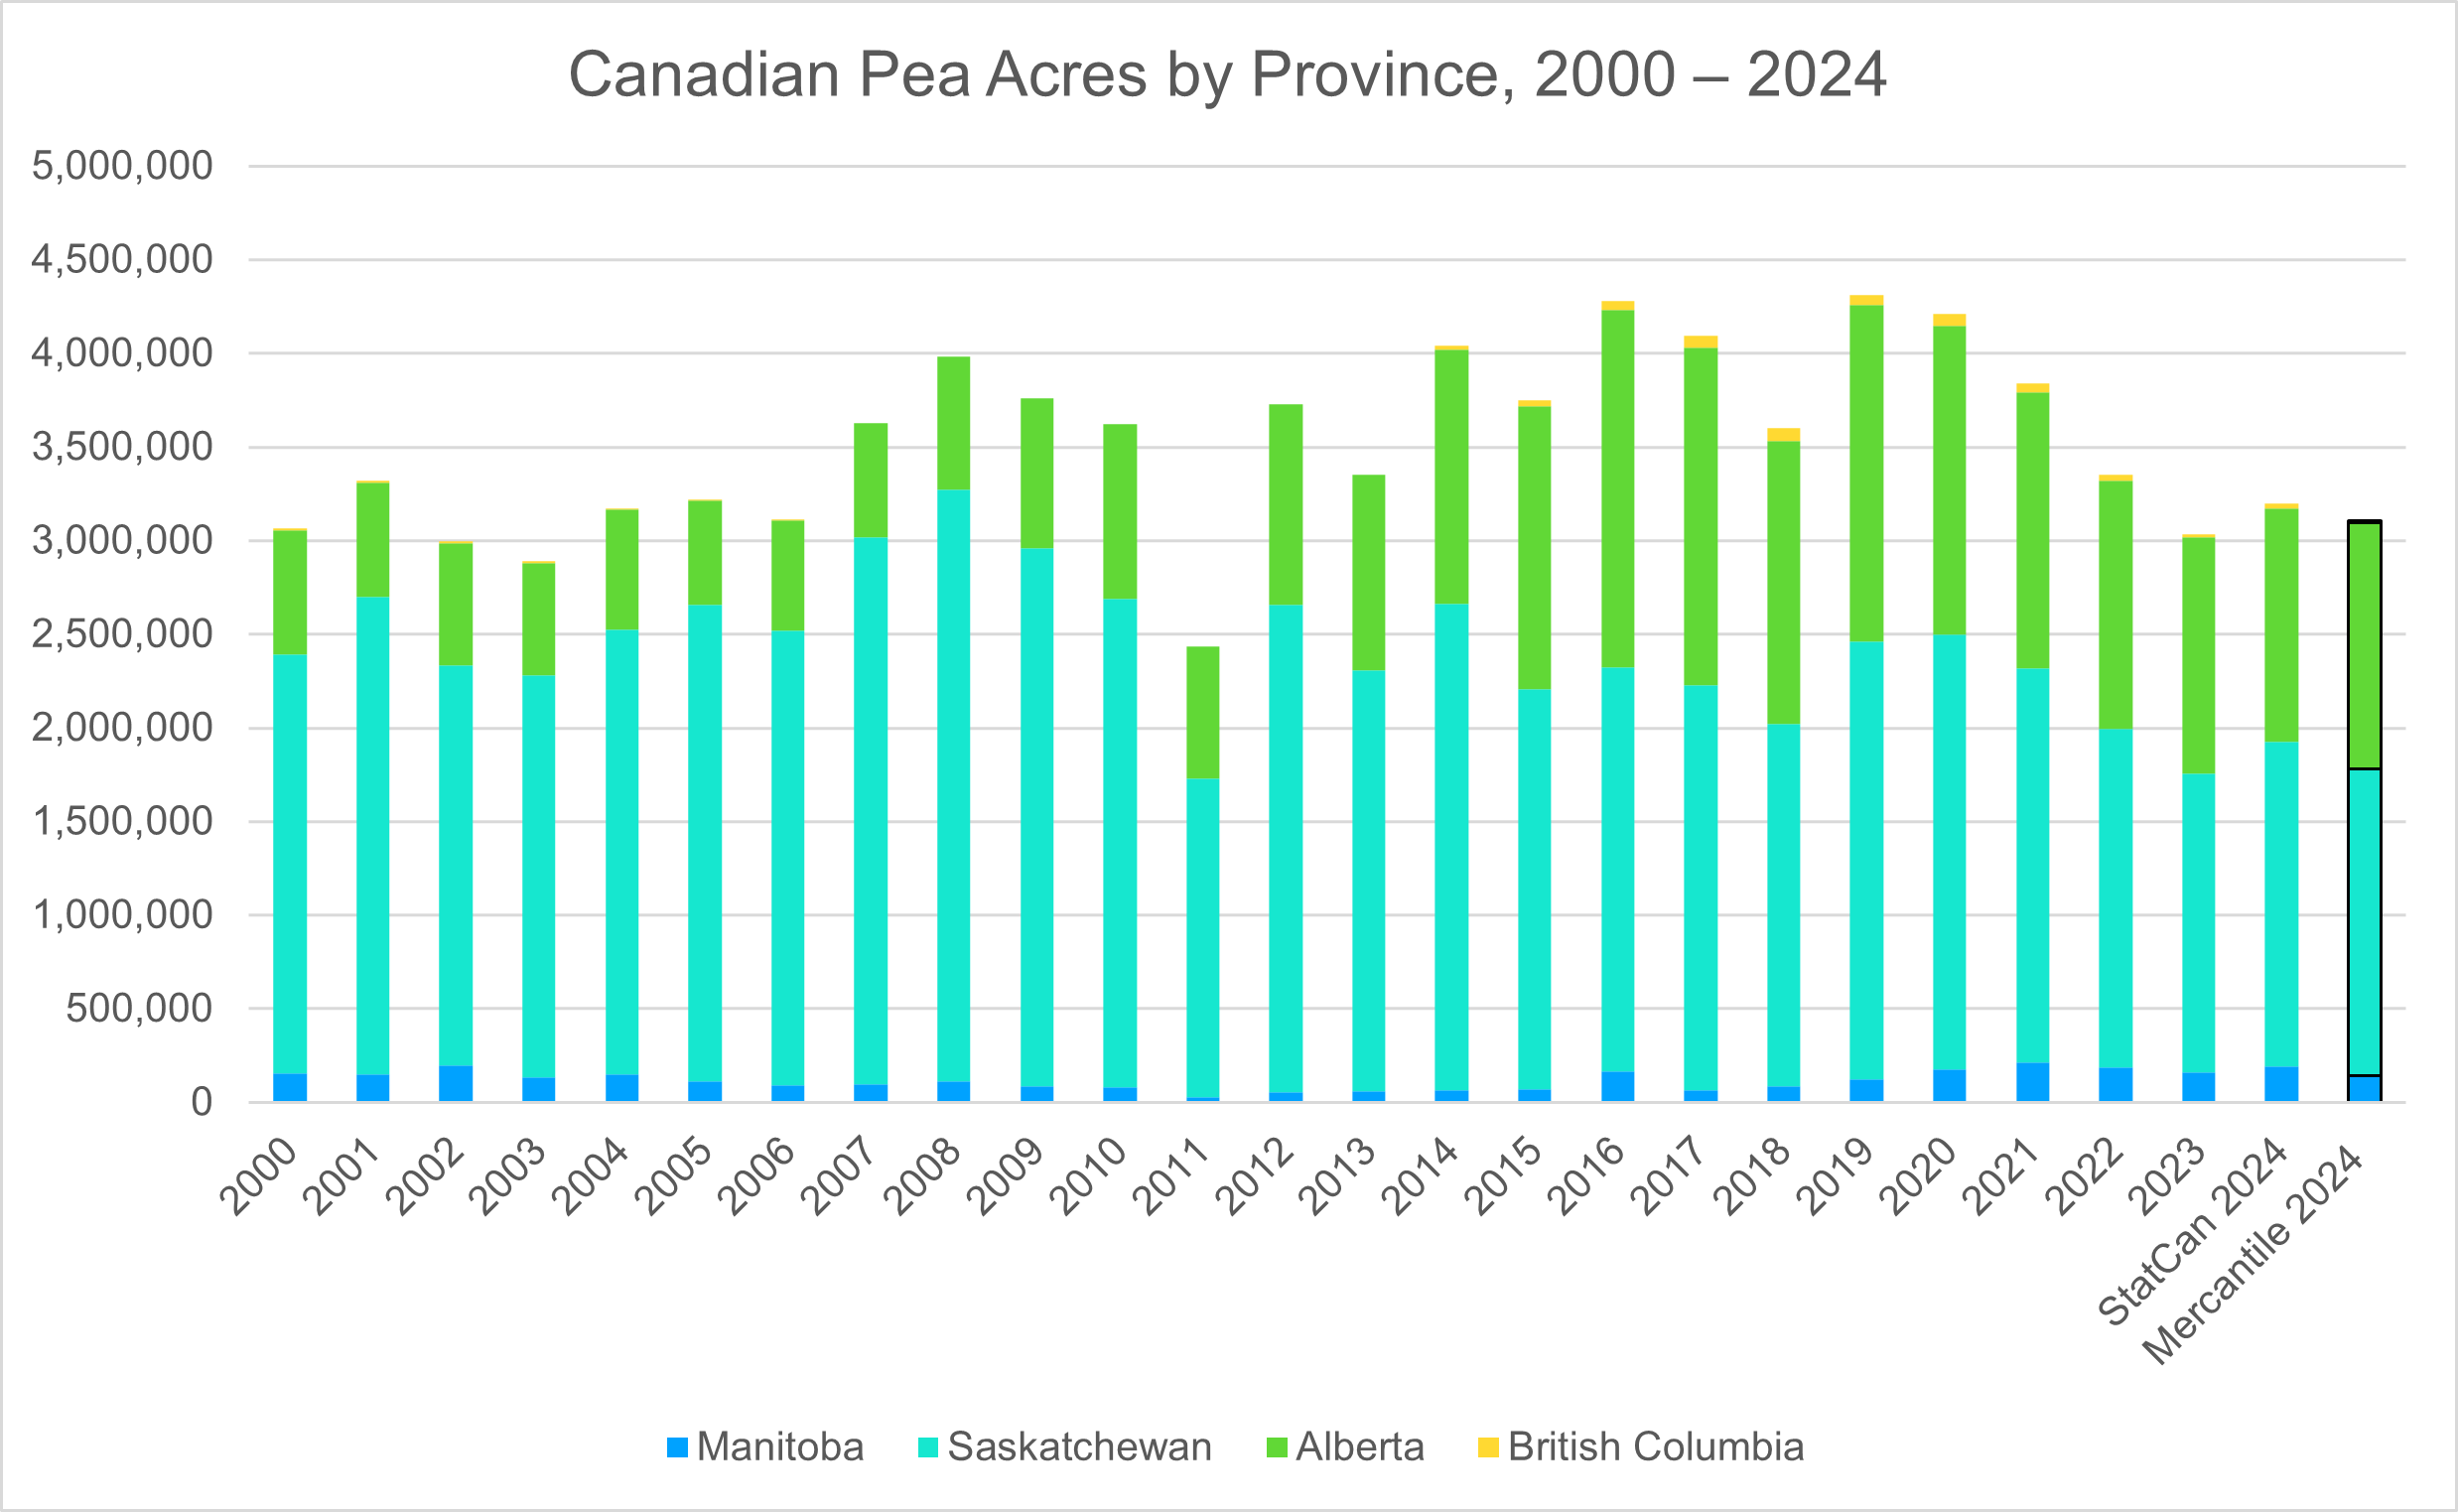
In fact, looking at historic acreage data, the recent range of pea acres at 3 million – 3.3 million acres remain well below the highs above 4 million acres. The reason for the progressive drop in acres from 2019 forward is the loss in confidence in pea markets following the import ban on peas by India, previously the biggest buyer. Chinese purchases, especially when feed peas were working, made up for some of the Indian losses, but new, aggressive competition by Russia into China, pose a new threat to Asian bulk pea markets. Fortunately, overall demand for peas has remained solid.
India did drop the tariffs and quotas on peas last winter and the policy extension of duty-free pea imports to October 31, 2024 stretches the influence of that policy into the new crop year. Another fourth extension of that policy seems possible but will depend on the success of domestic production in India. India has already imported 1.57 million tonnes of peas this calendar year (January – April 2024), and we are projecting 2 million tonnes of new crop pea purchases by India from all origins, but primarily from Canada and from Russia. Concerning the peas shipped year-to-date to India, Canada supplied 52% of total imports, followed by Russia at 31%, Turkey at 12%, and Ukraine at 2%. Evidently, the competition for market share into India and China has become more diverse and substantial.
We anticipate roughly a 3.1 million tonne Canadian pea production in 2024. The StatCan numbers against current AAFC yield projections translate into a 3.13 million tonne crop. Carry-in stocks in Canada from last crop year will not be burdensome (175,000 – 225,000 tonnes), nor should they be burdensome in Russia. Canada is poised to export about 2.45 million tonnes in 2023/24 (down from the previous year due to the smaller crop), and we are projecting 2.5 million tonnes in exports for next year.
The biggest competitor to Canadian exports in the pea markets now is Russia. At this point, we expect Russian pea production in 2024 at ~3.6 – 3.8 million tonnes, down from 4.7 million tonnes last year. But Russia should still be able to export 1.7 – 1.9 million tonnes of peas to their new friends in China, India, Bangladesh, and/or Pakistan, threatening Canadian market share into these destinations.
Looking at the overall picture, we expect a 2024 global pea production of 11.9 million tonnes (major producers) compared to 11 million tonnes last year. However, the carry-in of peas will be much lower than last year’s. We therefore expect global pea supply and demand to remain fairly balanced and expect a marketing year similar to last year’s. We note that competition by Russia is making it harder for Canadian exporters to extract premiums and to access feed pea markets. The immediate variables to watch are the growing conditions in Canada and Russia and the monsoon precipitation in India.
Marlene Boersch is a managing partner in Mercantile Consulting Venture Inc. More information can be found at www.mercantileventure.com.