Principle Investigator: Chris Holzapfel
Collaborators: Jessica Enns, Kayla Slind, Bryan Nybo, Don Sluth, Amber Wall
Introduction
This project was initiated as a follow-up to a previous research project that focused on improving weed control in lentil crops. The previous study evaluated multiple combinations of seeding rates, fungicide application strategies, and herbicide layering for improved weed control. Key findings indicated that (1) using pre-seed residual herbicide reduced early season annual weed populations by 66% compared to the traditional pre-seed burn-off strategy, (2) a seeding rate of 190 seeds/m2 resulted in the highest yield and net returns compared to seeding rates of 130 or 260 seeds/m2, and (3) that weed issues were most severe at the commonly recommended seeding rate of 130 seeds/m2. Disease severity was also noticed to increase with increasing seeding rates, and a single fungicide application was more likely to be required when higher seeding rates were used, and dual fungicide applications were more likely to be required under higher disease pressure. However, under the conditions encountered for the project, the cost of fungicide typically reduced net returns compared to the unsprayed treatments.
Based on these results, Saskatchewan Pulse Growers (SPG) identified a need to expand with a follow-up demonstration, which aimed to build upon the previous work by demonstrating the key findings of the previous project under different environmental conditions and demonstrating the benefits and drawbacks of different seeding rates and fungicide use on lentil production. The overall objective was to provide producers with information on the potential benefits of higher seeding rates for enhancing lentil yields and weed competition while considering the drawbacks and implications for disease management. For this project, the focus was on seeding rates and fungicides to simplify field trial management and data collection while also reducing the number of treatments.
Materials & Methods
Field trials with small red lentils were conducted at three locations and soil zones: Swift Current, a brown soil zone, Scott, a dark brown soil zone, and Indian Head, a thin black soil zone. Each site was tested for two growing seasons, 2021 and 2022. The treatments were a factorial combination of three seeding rates (130, 190, and 250 seeds/m2) and three fungicide management treatments (no fungicide applied, single application at early flowering, single application at early flowering and a second application approximately 14 days after the first) for a total of nine individual treatments (Table 1). The fungicide products and rates were 395 ml/ha Dyax® (250 g/l fluxapyroxad and 250 g/l pyraclostrobin) for the first application and 420 g/ha Lance® WDG (70% boscalid) for the second. The treatments were replicated four times in a randomized complete block design (RCBD).
Table 1: Seeding rate and fungicide treatments used for the lentil input demonstrations at Indian Head, Scott, and Swift Current 2021 and 2022
| Seeding rate (seeds/m2) | T1 Fungicide (early bloom) | T2 Fungicide (≈14 days after T1) |
|---|---|---|
| 130 | None applied | None applied |
| 130 | 395 ml Dyax®/ha | None applied |
| 130 | 395 ml Dyax®/ha | 420 g Lance® WDG/ha |
| 190 | None applied | None applied |
| 190 | 395 ml Dyax®/ha | None applied |
| 190 | 395 ml Dyax®/ha | 420 g Lance® WDG/ha |
| 250 | None applied | None applied |
| 250 | 395 ml Dyax®/ha | None applied |
| 250 | 395 ml Dyax®/ha | 420 g Lance® WDG/ha |
Lentils were direct seeded into cereal stubble with various equipment across locations. Both fertilizer and granular inoculant were held constant across the study area within each site with fertility intended to be non-limiting in all cases. Seed treatment was used at all locations and the lentil variety was either CDC Impulse CL (Swift Current and Scott) or CDC Proclaim CL (Indian Head). Weeds were controlled with registered pre-emergent and in-crop herbicide applications. No hand weeding was permitted. Foliar fungicides were applied to individual plots as per protocol using hand booms or similar. Pre-harvest herbicides or desiccants were utilized at the discretion of individual site managers, the plots were straight-combined when it was fit to do so, and outside rows were excluded from the harvest area wherever possible.
Various data were collected during the growing season and from the harvested samples (Table 2). However, prior to the analyses, data from the Scott 2021 site were removed due to extreme variability caused by drought and poor environmental conditions. Data from the remaining five sites were combined and analyzed using the generalized linear mixed model. For most variables, the effects of site (S), seeding rate (SR), fungicide treatment (F), and all possible interactions were considered, as well as within-site effects. Fungicide effects were excluded from the model for plant density. Disease and weed ratings were not statistically analyzed but are still summarized for explanatory purposes. All treatment effects and differences between means were considered significant at P ≤ 0.05; however, responses at P ≤ 0.1 were also generally highlighted if they made agronomic sense.
Table 2: Endpoints of the Lentil Input Demonstration Trials
| Endpoint | Description |
|---|---|
| Spring Plant Densities | Estimated plant densities from 4 x 1-meter sections after emergence, converted to plants/m² |
| Disease Ratings | Ratings of disease severity at two distinct times: prior to the first fungicide application and approximately seven days after the 2nd application. Each time, five sections within each plot were rated on a 0–100 scale for the area affected and then averaged. At Indian Head, plant samples were also submitted to Saskatchewan Crop Protection Laboratory to confirm the presence of disease and specific pathogens. |
| Weed Competitiveness Rating | At maturity, ratings of the lentil’s ability to compete with weeds were taken on a scale of 1–10, where 1 indicates less than 10% plot area affected by weeds. |
| Seed Yields | Determined from harvested grain samples, corrected for dockage and to 13% seed moisture content. |
| Test Weights | Determined from cleaned sub-samples using standard Canadian Grain Commission methods, expressed as g/0.5l |
| Seed Weight | Determined by counting and weighing a minimum of 250 seeds per plot, converted to g/1000 seeds. |
| Growing Season Temperatures and Precipitation | Compiled data from the nearest weather stations, located within 3 km of each trial site. |
Results
Mean Monthly Temperatures & Precipitation
Mean monthly temperatures and precipitation amounts for the demonstration at each site are presented relative to the long-term (1981–2010) averages. In 2021, Indian Head was initially dry, but timely precipitation events maintained reasonable yield potential. Total precipitation was 121% of the long-term average, but most rain fell in August, too late to benefit the crop. In 2022, the growing season started wet with above-average precipitation (117%) from May to August, supporting well above-average yield potential. Any potential negative impacts of the wet conditions were mitigated by good drainage and dryer weather in June. Indian Head had slightly above-average temperatures in 2021 (103%) and approximately average temperatures in 2022 (101%). Scott (2022) and Swift Current (2021 and 2022) experienced warmer (105–106%) and drier (78–88%) conditions than average. Except potentially Indian Head in 2022, the conditions at all sites were not conducive to disease, limiting the ability to achieve the project objectives to some extent.
Plant Densities
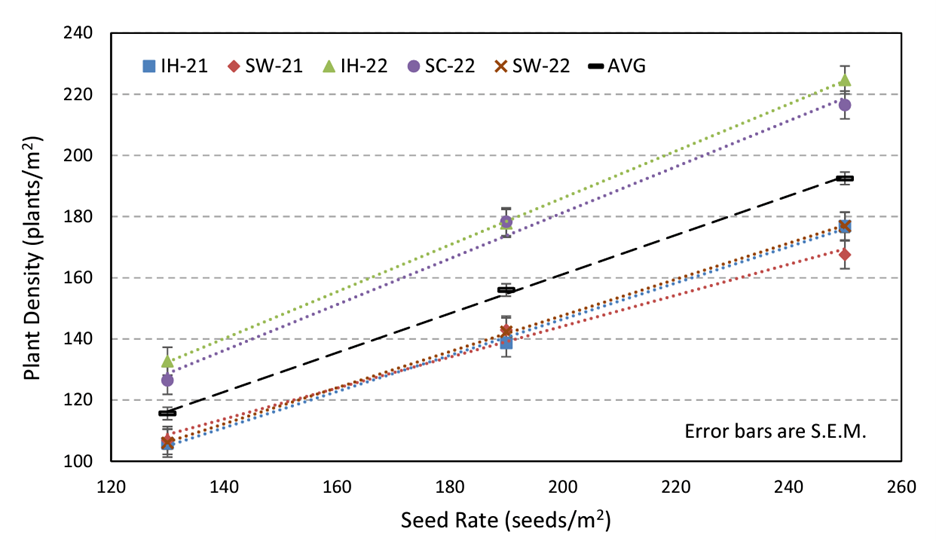
For plant density, the effect of site (S), seeding rate (SR), and their interaction (SxR) were all significant (P = <0.001 to 0.004). Across seeding rates, overall plant populations were highest at Indian Head 2022 and Scott 2022, and lower at the other sites. Despite a significant site-by-seeding rate interaction, the seeding rate effect on plant densities was consistently linear with a significant positive correlation between plant density and seeding rate (Figure 1). While significant, the site-by-seeding rate interaction was not considered important and attributed to subtle site variation at each seeding rate. Mortality also increased with the seeding rate, with percentages of live seeds establishing as plants at 89%, 82%, and 77% for seeding rates of 130, 190, and 250 seeds/m2.
Weed Competitiveness
Based on the previous project that this demonstration was built, the expectation was that increased seeding rates would improve the lentil crop’s ability to compete with weeds. While pre-seed burndown and in-crop herbicides were used, no residual herbicides were applied, and hand weeding was prohibited. Weed counts and biomass measurements were not taken as part of this demonstration, however, visual ratings on the overall weediness of each plot were completed prior to harvest. While not statistically analyzed, in brief, the plots at all sites were relatively clean and did not show a tendency for higher weed pressure at the lowest seeding rate at each site individually or when averaged across sites. Across all sites, the overall weediness rating was 1.7/10 at 130 seeds/m2 and 1.4/10 for the 190-250 seeds/m2 seeding rates (Table 3). Indian Head in 2022 had the highest overall values, but this was primarily due to the presence of Canada thistles, which were not controlled by the in-crop herbicides. In general, higher seeding rates and narrow row spacing can help any crop compete with weeds; however, it is possible that the resulting denser canopy can also create conditions that result in heavier disease pressure.
Table 3: Weediness ratings for each site and seeding rate.
| Site | Seeding Rate (seeds/m2) | Weediness Rating (out of 10) |
|---|---|---|
| Indian Head 2021 | 130 | 1.7 |
| Indian Head 2022 | 130 | 2.1 |
| Swift Current 2021 | 130 | 1.8 |
| Swift Current 2022 | 130 | 1.6 |
| Scott 2022 | 130 | 1.9 |
| Indian Head 2021 | 190-250 | 1.3 |
| Indian Head 2022 | 190-250 | 2.0 |
| Swift Current 2021 | 190-250 | 1.5 |
| Swift Current 2022 | 190-250 | 1.4 |
| Scott 2022 | 190-250 | 1.7 |
| Average | 130 | 1.7 |
| Average | 190 – 250 | 1.4 |
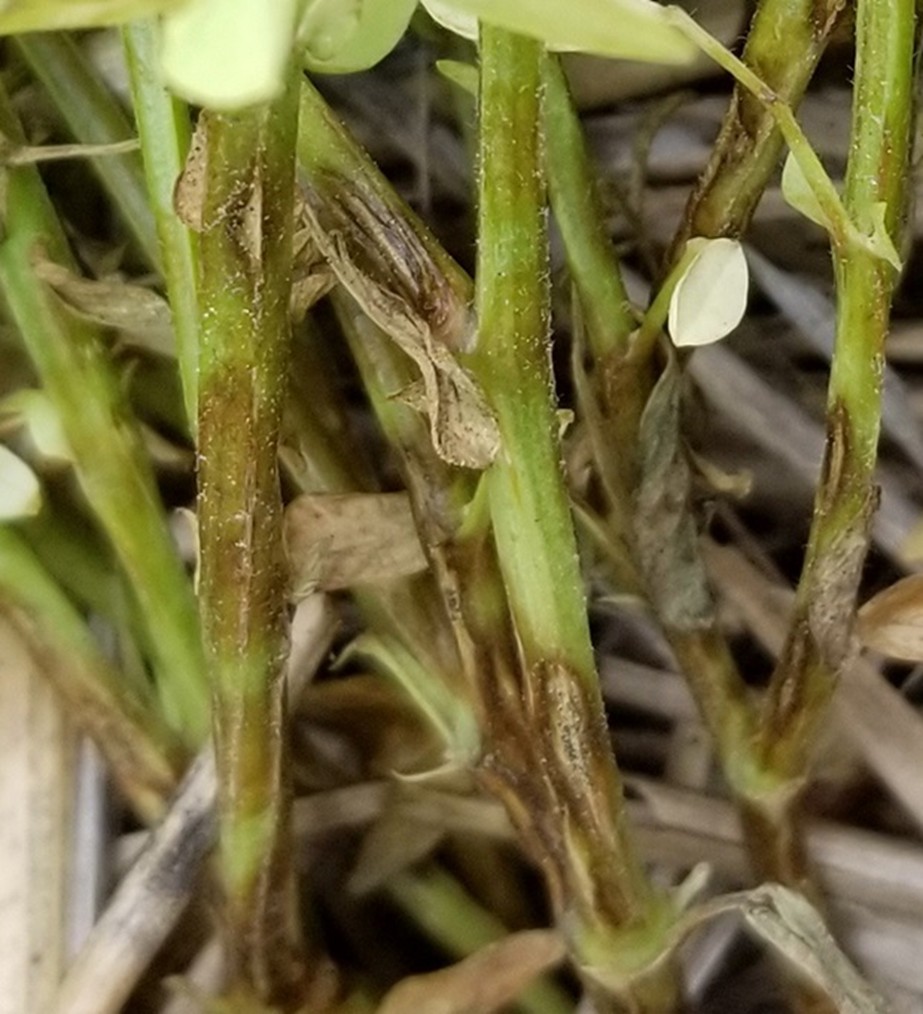
Disease Ratings
The initial disease ratings were completed at the start of flowering, prior to the first fungicide treatment applications. While these data were not statistically analyzed, the intent of these ratings was to provide information on the apparent disease pressure at the time when producers would need to decide about investing in foliar fungicide applications. The values presented in this report were averaged across seeding rates and rated on a scale of 0–100. Disease pressure at the time of the first application was negligible at all five sites (Table 4). The highest values were reported at Indian Head 2022 and the lowest was at Swift Current 2021, the wettest and driest of the sites, respectively. At the sites with the heaviest disease pressure, the lowest values did tend to coincide with the lowest seeding rate; however, the numbers were so small that they were not considered to be of much importance. The only site where the application of fungicide may have had a positive effect was Indian Head 2022 where soil conditions were wetter than usual.
Final disease ratings were conducted approximately seven days after the second set of fungicide treatments and the disease ratings increased at all locations except Swift Current in 2021, where the ratings went from negligible to non-existent. The sites with the lowest disease pressure (Indian Head 2021, Swift Current 2021 and 2022) did not show significant impacts of higher seeding rates on disease. Indian Head 2022 and Scott 2022 did show increased disease pressure with higher seeding rates (Table 4), but the overall disease pressure at Indian Head in 2022 remained low relative to the expected effects of the wet weather. The highest disease rating values were observed at Scott 2022 despite the dry conditions, but these results could have been confounded by senescence.
Table 4: Initial and final disease ratings per site from seeding densities of 130–250 seeds/m2
| Site | Initial Disease Ratings | Final Disease Ratings (%) |
|---|---|---|
| Indian Head 2022 | Negligible (0.5%) | 1.6–1.9 |
| Scott 2022 | Negligible (1 – 1.4%) | 2.3–4.2 |
| Indian Head 2021 | Negligible (0.7- 0.9%) | 2.4–7.8 |
| Swift Current 2021 | Negligible (0.1-0.2%) | – |
| Swift Current 2022 | Negligible (0.4 -0.5%) | 1.3–1.5 |
| Average | Negligible (0.6 -0.7%) | 1.5–3.1 |
Averaged across seeding rates, fungicide application did not appear to have much impact on disease at the sites with the lowest pressure, Indian Head 2021, and Swift Current 2021 and 2022 (Table 5). At Indian Head 2022, fungicide treatments resulted in lower disease ratings with no difference between single and dual applications, and at Scott, fungicide effects appeared to be less prevalent. Plant samples from Indian Head were submitted to the Saskatchewan Crop Protection Laboratory to confirm the presence of disease and identify the specific pathogens in both years. In 2021, results were inconclusive with no disease identified in the sample. In 2022, the dominant disease was confirmed to be anthracnose (Colletotrichum truncatum) with infection levels on individual plants ranging from mild to severe. Alternaria was also identified on severely damaged pods but suspected to have been established on plants that had prematurely senesced.
Table 5: Fungicide impacts on disease ratings
| Site | Control Final Disease Rating (%) | 1x Fungicide Treatment Final Disease Rating (%) | 2x Fungicide Treatment Final Disease Rating (%) |
|---|---|---|---|
| Indian Head 2022 | Negligible | Negligible | Negligible |
| Scott 2022 | 4.8 | 2.6 | 2.6 |
| Indian Head 2021 | 5.3 | 4.3–4.6 | 4.3–4.6 |
| Swift Current 2021 | Negligible | Negligible | Negligible |
| Swift Current 2022 | Negligible | Negligible | Negligible |
| All | 2.6 | 2.1 | 2.1 |
Seed Yield
Seed yield analysis utilized a simpler model with common variance across sites. The overall effect of the site (S; P < 0.001) and fungicide treatment (F; P = 0.012) were highly significant while the overall seeding rate effects were marginally significant (SR; P = 0.056). The highest yields were observed at Indian Head 2022, followed by Indian Head 2021, Scott 2022, Swift Current 2022, and lowest at Swift Current 2021.
Seeding rate effects on lentil yield differed across sites, resulting in a significant site-seeding rate interaction. At Indian Head 2021, the seeding rate had a positive effect on yield. At Swift Current 2021, there was a marginally significant decline in yields under severe drought conditions. At Indian Head 2022, yields declined linearly with increasing seeding rate under wet and disease-prone conditions. The seeding rate had no impact on yield at Scott 2022. At Swift Current 2022, there was a marginally significant decline in yield with an increasing seeding rate under drought conditions. Averaged across all sites, there was a slight linear decline in yield with an increasing seeding rate.
Fungicide treatment effects on yield were significant at Indian Head 2022 and when averaged across sites (Figure 2). The lack of site-fungicide interaction suggests some consistency across sites in response to fungicide treatment. Generally, yields in treated plots were slightly higher than in control plots at all sites. The magnitude of the yield response to fungicide ranged from 2–4% over the control. The dual fungicide application did not show additional benefits over a single application at early bloom. The observed responses to a fungicide may have been stronger at a larger scale, considering canopy drying, disease spread, and field conditions.
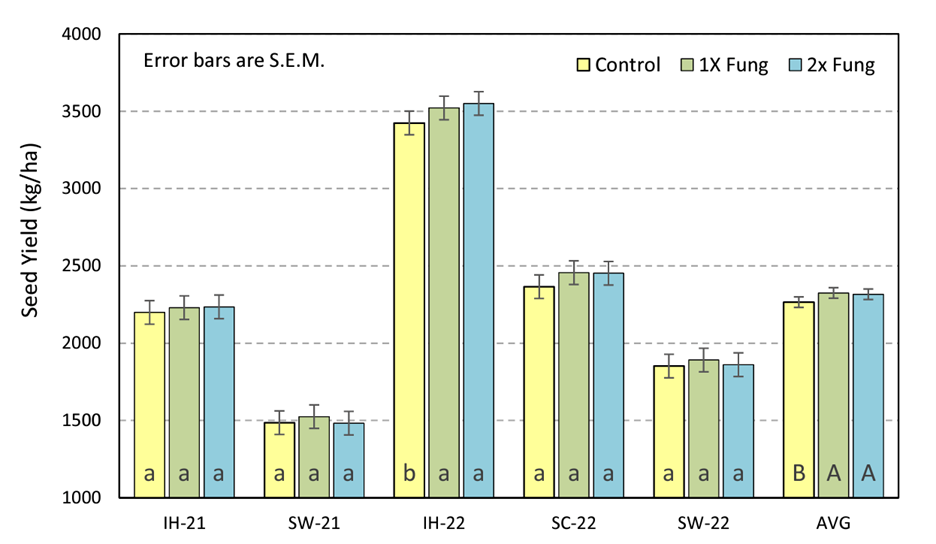
There was no significant interaction between the seeding rate and fungicide for most sites or overall (P = 0.091–0.653), indicating that the response to fungicide did not vary according to the seeding rate. The site by seeding rate by fungicide treatment interaction was also not significant, suggesting consistent responses to seeding rate regardless of fungicide application. Indian Head 2022 was the exception, showing significant effects of both seeding rate and fungicide. However, rather than higher seeding rates benefiting from the fungicide, it was the 130–190 seeds/m2 treatments that showed a stronger yield response. At Indian Head 2022, the yield benefit from fungicide application was 4–5% for 130–190 seeds/m2 and only 1% for 250 seeds/m2. The seeding rate responses varied due to higher yields at lower seeding rates when fungicide was applied. In the absence of fungicide, there was no relationship between yield and seeding rate, while yields declined linearly with seeding rate when fungicide was applied. Other factors may have limited yield at the 250 seeds/m2 seeding rate, reducing the potential benefit of fungicide applications.
Test Weight
Overall, test weight was affected by site, with significant interactions between site and seeding rate (SxSR; P = 0.02) and site and fungicide (SxF; P= 0.004). The highest test weights were observed at Indian Head 2022, followed by Indian Head 2021, Scott 2022, Swift Current 2021, and Swift Current 2022. The variety grown at each location may have contributed to the differences in test weight. There was a significant interaction between the seeding rate and site at Scott 2022, indicating seeding rate may have affected test weight at this site. Given that the relationship between seeding rate and test weight was mainly quadratic, the highest test weights were observed under a seeding rate of 130 seeds/m2. There was a marginally significant negative linear response between the seeding rate and test weight at Indian Head 2022, but this effect was weak.
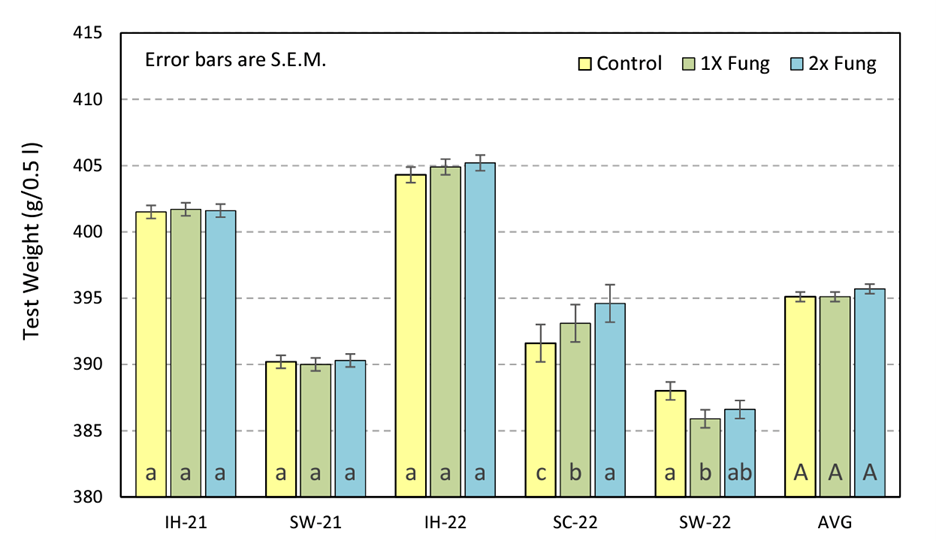
Fungicide effects on test weight showed significant interactions at Scott 2022 and Swift Current 2022 but were inconsistent (Figure 3). At Scott 2022, where disease was observed, the effect of fungicide on test weight was positive. At Swift Current 2022, the highest test weights were observed in the control, while the lowest was with a single application of fungicide. The effects of seeding rate and fungicide on test weight were small compared to the influence of environment and genetics, however, test weight is not a major grading factor for red lentils, unlike some other crops.
Seed Weight
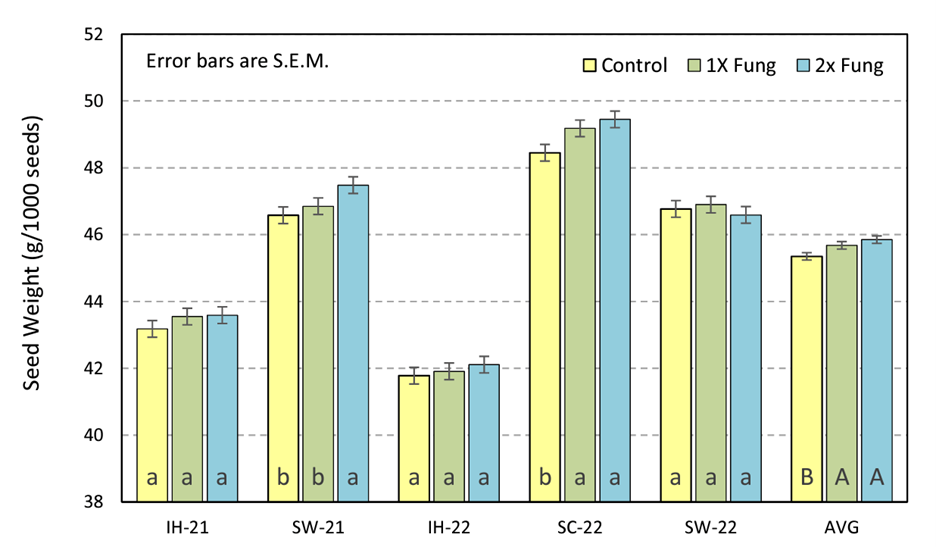
For lentil seed weight, site (S), seeding rate (SR), and fungicide application (F) all had significant effects on seed weight, but no interactions were detected. Seed weights were highest at Scott 2022, followed by Swift Current 2021 and Swift Current 2022, Indian Head 2021, and Indian Head 2022, however, the lower values at Indian Head may have been due to different genetics. The linear decline in seed weight from 130 seeds/m2 to 250 seeds/m2 seeding rate was significant. The site and seeding rate interaction were not significant, but the main effect response was mainly driven by Indian Head 2021 and Swift Current 2022. Fungicide had a small but positive effect on seed weight (Figure 4). Averaged across sites, seed weights increased slightly when foliar fungicide was applied, and the effect of fungicide on seed weight was strongest at Swift Current 2021 and Scott 2022. The decline in seed weight with increasing seeding rates likely contributed to the negative impacts of high seeding rates on yield observed at some sites. Seed size is an important yield component, and larger, heavier seeds contribute to higher yields.
Economic & Practical Implications for Growers
The economic returns associated with any evaluated treatments can vary widely depending on the environmental conditions, commodity prices, and input costs. This demonstration focused on calculating the marginal profits for the seeding rate and fungicide application. While the plots were conventionally managed with respect to herbicide applications, occasional minor benefits in the crops’ ability to compete with weeds as the seeding rate was increased were observed. However, the most profitable seeding rate varied with location. Indian Head 2021 was the only site where yields increased with the seeding rate, making the 250 seeds/m2 treatment the most profitable. In other cases, seeding rate effects on yield were neutral or negative, resulting in lower relative marginal profits as the seeding rate increased. When the higher input costs are considered alongside the magnitude of the responses, increasing seeding rates from 130 seeds/m2 to 190 seeds/m2 reduced profits at three of five sites. Rates of 250 seeds/m2 were less profitable than 130 seeds/m2 at four of five sites. In general, the higher seeding rates evaluated in this project appeared to have the greatest potential to be detrimental under either very dry conditions or wetter than normal conditions. The effect of seeding rates on test weight and seed weight was small and inconsistent and if the results from Indian Head 2022, which had the best establishment and high yields, are considered, higher seeding rates were overall considered to have little to no benefit.
Fungicide applications also did not result in higher marginal profits compared to the untreated control when averaged across seeding rates. Marginal profits were lower with fungicide applications, ranging from $1/ha to $145/ha less than the control. Indian Head 2022 was the most responsive site to fungicide, but even there, the single application of fungicide did not improve profits compared to the control.
Overall, the seeding rates of 130–190 seeds/m2 should be considered low-risk and optimal. Except for organic production where there is potential for heavy weed pressure, seeding rates as high as 250 seeds/m2 should generally be avoided as such high seeding rates increase input costs and could even negatively affect yields. Disease should generally be managed independently of target plant populations.
Key Findings & Recommendations
This project was intended to provide producers with information on the potential benefits of higher seeding rates to enhance lentil yields and their ability to compete with weeds while also illustrating potential drawbacks and implications for disease management. The results from this project were not always consistent with the results from the previous demonstration which this project was expanded from, particularly with respect to seeding rate effects on seed yield. The key concluding findings and recommendations are provided below:
Seeding Rate
Key Finding: Seeding rates of 130–190 seeds/m2 were considered low-risk and optimal from both a cost, yield, and grade perspective. Higher seeding rates generally resulted in negative effects on yield and weight and increased disease.
Recommendation: Seeding rates above 190 seeds/m2 should be generally avoided.
Fungicide Applications
Key Finding: Fungicide applications at early bloom had an overall benefit, but the yield responses were small. Further, single fungicide applications resulted in covered costs but did not result in an overall profit. Dual fungicide applications were less profitable than the control.
Recommendation: Fungicides are best applied at early bloom, but producers should prepare for small yield responses.
Disease Management
Key Finding: Disease management should be independent of the target plant population. Lower plant populations may be able to compensate for yield with increased branching and flowering when supported by fungicide application. However, disease pressure in lentils can still be costly if not managed effectively, particularly in wetter years or regions.
Recommendation: Disease management should be a priority, regardless of target plant populations, and regular monitoring for disease, disease resistance, and insensitivity to fungicidal applications is critical. Producers should frequently test the efficacy of fungicide products in various environments and consider rotating products to prevent insensitivity or resistance from developing. Validating small plot trial results under larger field-scale conditions using commercial sprayers and covering different landscape positions is also valuable. It may also be beneficial to use wider row spacing, such as 40 cm, for potential benefits in disease management, but producers should still be cautious of decreased weed competition and increased reliance on herbicides.