By Marlene Boersch, Mercantile Consulting Venture Inc.
January 2022
This certainly has been a unique year in all agriculture markets, and pulse markets have been no exception. Following generally well- supplied markets in 2020, the much-reduced 2021 crop year took a lot of people by surprise, not least our Prairie farmers. No one had expected yields to be down by 30–40%, and both sellers and buyers were unprepared for this scenario. Overlay the situation with extreme logistics problems post-harvest, and we get a rough picture of the messy market everyone has been facing.
Lentils
To quickly recap, according to Statistics Canada (StatCan) in December, Canada ended up with a 1.6 million (M) tonne lentil crop in 2021, down 44% from 2020 (Mercantile is using a somewhat bigger crop of approximately 1.7 M tonnes). The 2021 Canadian lentil supply is down to about 2.1 M tonnes, from about 3.2 M tonnes the previous year. Prices reacted accordingly over the summer as the shortfalls became more apparent to exporters and overseas buyers. The immediate surge in prices was supported by exporters having to augment the contracted volumes which were affected by extremely low yields with new purchases, as some farmers fell short of the original production contract volumes. No.2 red lentils briefly reached $55 per hundredweight (/cwt) in late August, and have since settled at around $45/cwt. Large green lentils reached $66/cwt in mid- September, and levelled to the low to mid 60s. Good small greens remain at ~$60/cwt. The big question now is what farmers can expect for the remainder of the crop year. To answer this, we need to consider the global lentil supply situation, export movement to date, and pending demand scenarios.

Global lentil supply has certainly been affected by the shortfalls in both Canada and in the United States (U.S.). The combined North American shortfall in lentil production compared to last year was 1.4 M tonnes, and other lentil producers are not big enough to make up for that deficit. In fact, we estimate the 2021/22 global lentil production at 5.3 M tonnes compared to 6.7 M tonnes in 2020/21. Ending stocks in import countries also were low because of relatively high prices last year. Buyers overseas were hoping to be able to replenish stocks with cheaper new crop product following harvest. This opportunity did not materialize. This means that, given near normal demand, overall supplies are unusually tight this ongoing crop year.

Canadian Export Movement to Date
Year to date (YTD) exports of lentils as reported by StatCan (we only have August 1 to October 31 numbers to date) are down by 28% from last year’s (-225,000 tonnes). Turkey has emerged as the biggest buyer of Canadian lentils YTD (194,000 tonnes), trailed by India (134,000 tonnes) and with the United Arab Emirates (UAE) in third position (60,000 tonnes). The biggest increase in exports to any destination has been to the U.S. (six-fold increase to 19,000 tonnes), which speaks to the lentil production shortfall in the U.S.
Initial export shipments this fall, especially red lentil bulk shipments, were based on forward sales to destination buyers and some exporters had to quickly top off production contract purchases to service these contracts. This resulted in the price peaks seen at the end of the summer to early fall. Since then, it is fair to say that export demand for both Canadian red and green lentils was disappointing during October and November. December, especially last half of December, tends to exhibit a “seasonal” slowdown in demand, but we are seeing renewed interest in large green lentils, with grower bids inching up again. Red lentils will likely pause until the bulk of the Australian red lentil crop has been spoken for.
Underlying Destination Demand
Global lentil consumption over the past five years is estimated at around 6.6–7.8 M tonnes. Global trade in lentils has amounted to 3.6–4.3 M tonnes, depending on production in some of the importing countries. Of the trade number, Canada tends to contribute 1.6–2.7 M tonnes, or 45–63% of total. This means that shortfalls in Canada always weigh heavily in terms of overall export availability.
Green Lentils
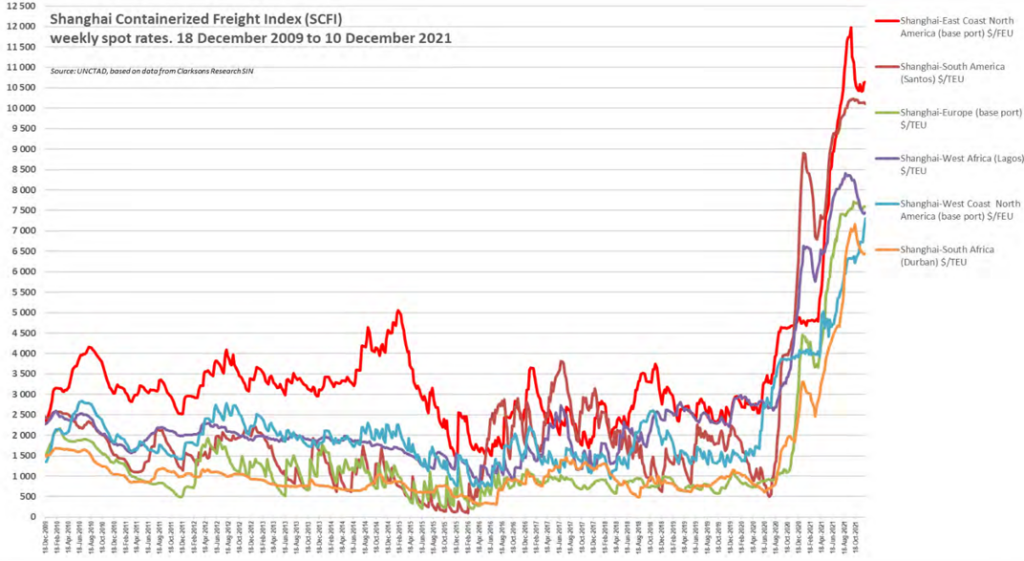
On the green lentil side, the primary producers of traded green lentils are Canada and the U.S., and their combined green lentil production in 2021 at ~750,000 tonnes was roughly 50% smaller than in 2020. We estimated carry-in stocks at no more than 75,000 tonnes for a total supply at around 825,000 tonnes. This will have to satisfy domestic demand (including for seed) of ~150,000–175,000 tonnes, plus exports generally around 900,000–975,000 tonnes. The numbers show that there is no doubt that green lentil supplies are tight. So, why the slow demand during the fall? We think the price jolt to buyers this fall was profound, especially when combined with spiralling freight costs (see graph). Buyers withdrew, hoping the tepid demand would at least pressure commodity prices (and perhaps freight costs would fall too). Buyers also went on a buying spree of any domestically/ nearby produced pulses (lentils and any potential substitutes), adhering to the principle of buying all least costly supplies first. In Europe and North Africa, this included supplies from Black Sea countries. We expect that destination buyers have now reached the point of needing additional North American supplies and are coming back to Canadian suppliers. Does this mean that prices will continue to rise? Likely somewhat, but we also need to recognize that current prices are well above “normal” prices. Most important of all, farmers should remember not to carry any product into new crop in case we have improved supplies next year.
Red Lentils
Red lentils have more supply options, although most of traded lentils are supplied by Canada (1–2 M tonnes), Australia (275,000–850,000 tonnes), and Turkey (250,000–450,000 tonnes). We estimate combined red lentil production of the major exporters at about 2.1 M tonnes compared to ~3 M tonnes the previous year, roughly a 30% reduction. Carry-in was around 150,000 tonnes, for a supply of 2.25 M tonnes against domestic needs plus ‘normal’ exports of 3–3.8 M tonnes. Again, there is a real shortfall here, although the market is still absorbing the unusually good Australian crop for now. However, the above numbers say that Canadian lentils will also be needed in the New Year.
Thoughts on New Crop (2022) Lentils
There have been some new crop bids for large green lentils at $36.50– 40.00/cwt with Act of God (AoG), and at $30–33/cwt for reds. The new crop red lentil price is a big improvement over the low initial bid at $25/cwt, and this might make reds more attractive than greens for some growers. However, these bids still do not compare to the new crop bids for oats, durum, flaxseed, or canola.
Peas
To recap the production numbers, StatCan maintains that only 2.3 M tonnes of peas were produced in Canada, compared to 4.6 M tonnes the previous year, a 51% reduction. The 2021/22 Canadian pea supply is down to 2.8 M tonnes from 4.9 M tonnes the previous year. Pea prices reacted a little more slowly than lentil prices and have been relatively flat since at $18 per bushel (/bu) for yellows and $16/bu for green peas.
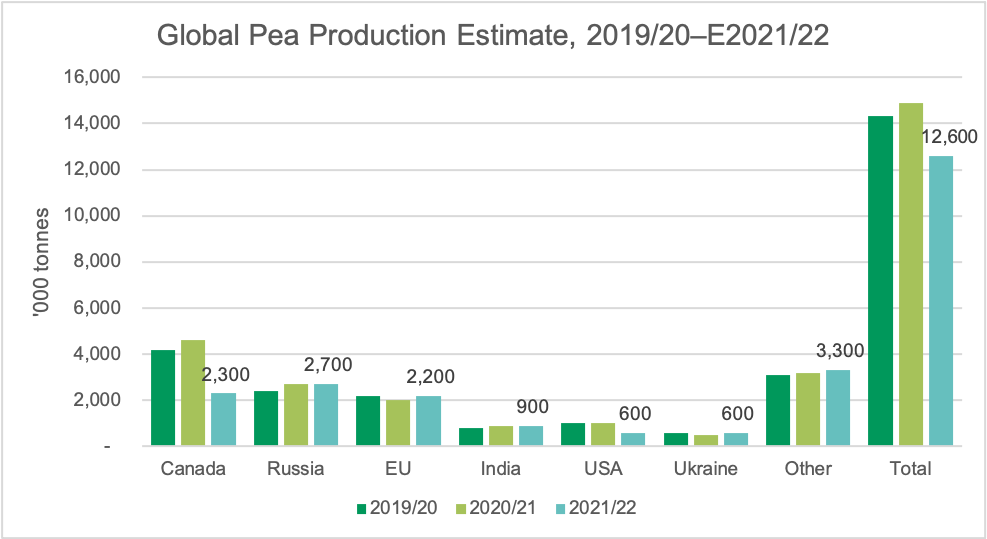
We estimate global pea production to be down by 15% from last year to 12.6 M tonnes, again driven by the shortfalls in Canada (-51%) and in the U.S. (-40%). European Union (EU) and Black Sea production of peas is up by a combined 6% (+300,000 tonnes), but this is not enough to offset the combined 48% North American shortfall (-2.7 M tonnes). However, Russia has become the biggest producer of peas in 2021/22, and Russian pea export shipments so far during the calendar year amount to 838,000 tonnes, up 59% on last year.

YTD export movement (August to October 2021) of Canadian peas amounted to 823,000 tonnes compared to 1.3 M tonnes last year. Of that, China has taken 611,000 tonnes, 74% of total pea exports. This is important, as China bought 81% of total last year’s exports during that period. The difference is that China stopped buying additional peas for feed this fall. So, YTD exports to China are down by 484,000 tonnes. Notably, the next biggest importer of Canadian peas to date is the U.S. (92,000 tonnes; a fivefold increase and testimony to their production shortfall), followed by Cuba with 92,000 tonnes. We expect the U.S. to buy as much as 380,000 tonnes of peas this crop year. Overall imports of peas other than to China are only down by 21,000 tonnes from last year, but because China is so dominant that it seems exports are almost at a standstill.
Demand Outlook
The StatCan production number should limit Canadian exports to about 2 M tonnes (3.6 M tonnes last crop year), which requires some serious belt-tightening by most of our importers, even if China buys no additional peas for feed. Those buyers who want peas after Russia has run out, will have to compete for supplies. The fact that container rates have started to fall to some destinations will help marginally.
Thoughts on New Crop (2022) Peas
There were some new crop bids last week for yellow peas at $13/ bu free on board farm with AoG. This definitely is a step on the right direction but cannot yet fully compete with new crop canola, durum, oat, or flaxseed bids.
Marlene Boersch is a managing partner in Mercantile Consulting Venture Inc. More information can be found at www.mercantileventure.com.