By Marlene Boersch, Mercantile Consulting Venture Inc
October 2024
Faba Beans
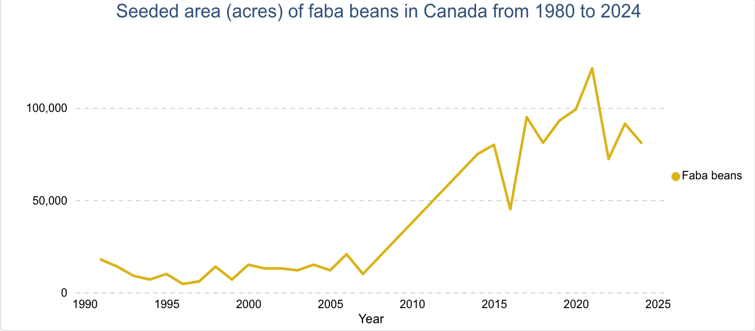
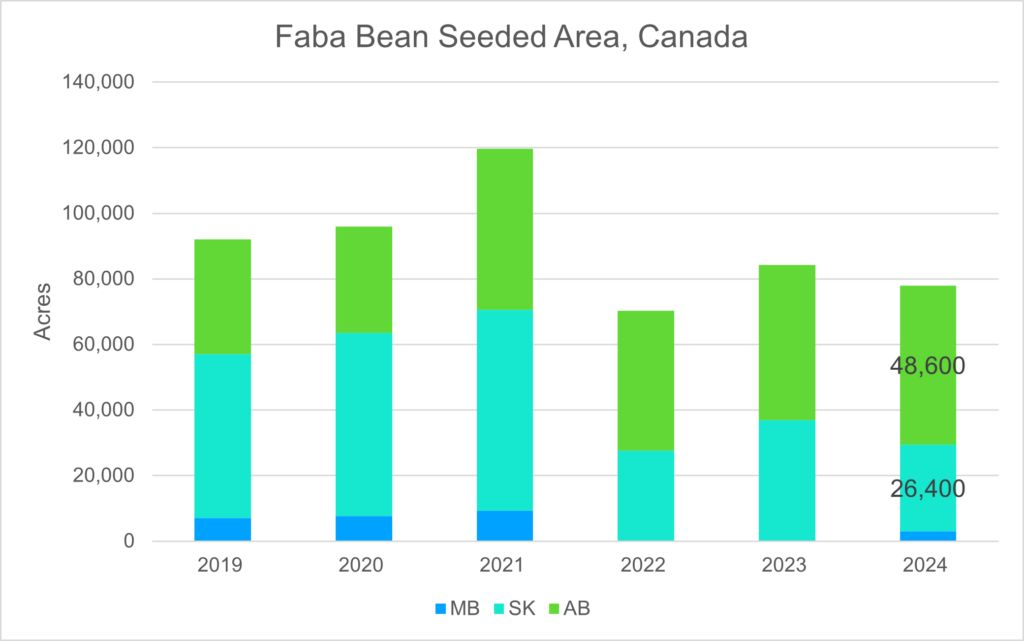
2024 faba bean acres in Canada are well below their peak of 121,000 acres established in 2021. In fact at 81,100 acres, faba bean acres remain well below the 100,000 mark.
One major change that has taken place is that Alberta has overtaken Saskatchewan as the province with the highest acreage. This makes sense to us, as marketing of the crop is the biggest problem, and the main feed markets are located in Alberta.
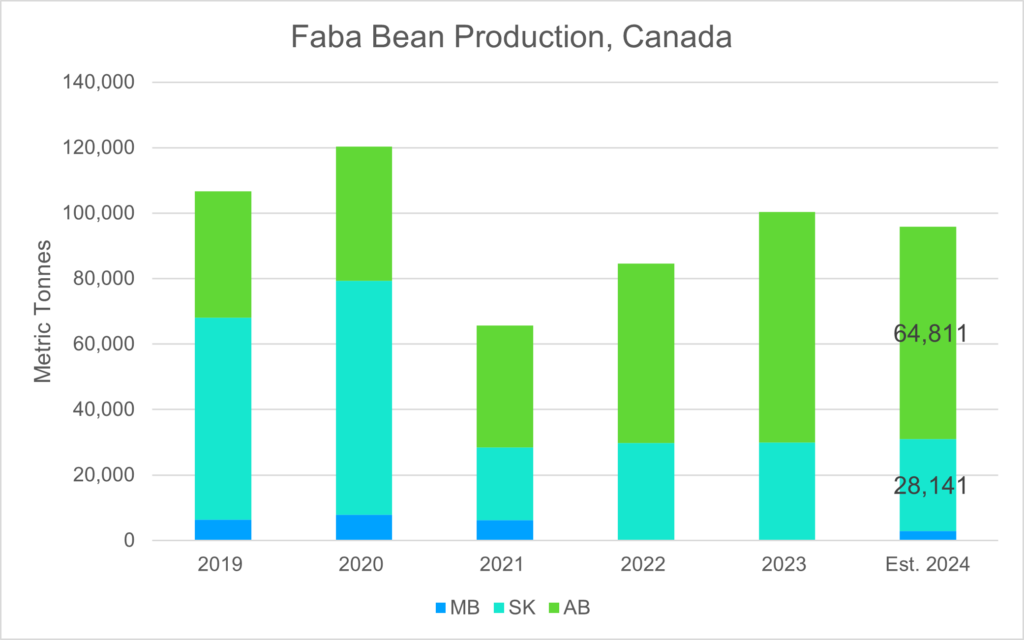
Statistics Canada does not seem to have a production estimate for 2024 faba beans, but we peg 2024 production at approximately 97,500 tonnes, down about 9% from 107,000 tonnes in 2023. Production in Saskatchewan fell marginally to 28,000 tonnes, while production in Alberta fell to approximately 64,800 tonnes.
Turning to demand, a look at the Canadian export performance over the past six years shows that faba bean usage is increasingly a domestic affair, with only two major destinations: Egypt and the United States (U.S.).
Canadian Faba Bean Exports (Tonnes)
| 2019 | 2020 | 2021 | 2022 | 2023 | 2024 (January – July) | |
|---|---|---|---|---|---|---|
| Belgium | – | 38 | 154 | – | – | – |
| Bermuda | – | 2 | – | – | – | – |
| China | 75 | 1 | 1 | – | – | – |
| Colombia | – | – | – | 78 | – | – |
| Denmark | 641 | – | – | – | – | – |
| Ecuador | – | – | – | 79 | – | – |
| Egypt | 24,168 | 16,920 | 2,092 | 4,190 | 324 | 1,153 |
| Hong Kong | – | – | 3 | – | – | – |
| India | 1,514 | 766 | – | – | – | 482 |
| Israel | 151 | 248 | 98 | 80 | – | – |
| Italy | – | 44 | – | – | – | – |
| Japan | 179 | 77 | 180 | 174 | 367 | 21 |
| Jordan | 203 | – | – | – | – | – |
| Korea, South | – | 812 | 207 | – | 85 | 478 |
| Kuwait | – | 121 | – | – | – | – |
| Lebanon | 260 | 101 | – | 129 | – | – |
| Libya | – | – | 144 | – | – | – |
| Malaysia | – | 25 | – | 32 | – | – |
| Morocco | – | 576 | 74 | – | 13 | 132 |
| Netherlands | 5 | – | 21 | – | – | – |
| Norway | 40 | – | – | – | – | – |
| Pakistan | – | 193 | – | – | – | – |
| Peru | – | 34 | – | – | – | – |
| Qatar | 25 | – | – | – | – | – |
| Saudi Arabia | – | 310 | – | – | – | – |
| Sri Lanka | – | – | – | 53 | – | – |
| Sudan | – | 1 | – | – | – | – |
| Switzerland | – | 1 | – | – | – | – |
| Taiwan | – | – | – | 84 | – | – |
| Türkiye | 245 | 612 | 514 | 394 | – | 134 |
| United Arab Emirates | 1,389 | 304 | – | – | 59 | – |
| United States | 10,046 | 6,572 | 12,920 | 10,833 | 7,681 | 7,049 |
| Viet Nam | – | 52 | – | – | – | – |
| Grand Total | 38,942 | 27,810 | 16,408 | 16,125 | 8,529 | 9,450 |
Source: Mercantile based on StatsCan data
The main producers of faba beans are China with 1.5 to 1.8 million tonnes annually, Ethiopia with over 1 million tonnes of production annually, Australia with 700,000 to 850,000 tonnes annually, the United Kingdom (U.K.) with 600,000 to 700,000 tonnes annually, and France with 180,000 to 250,000 tonnes annually. The main exporters are Australia, the U.K., and France.
Egypt is by far the biggest importer, taking 500,000 to 550,000 tonnes annually. Egypt imports primarily from the U.K., Australia, and France. The quality requirements in Egypt are stringent, and medium to large seed size faba beans with high tannin are preferred for food use as well as for processing into concentrated protein fractions. It is hard for Canadian product to compete with U.K., Australian, and French faba beans on quality as well as on freight costs.
This is the reason that most Canadian-grown faba beans are primarily used domestically for pet food and livestock feed (mostly hog and poultry, though there is potential for cattle as well). This also means that prices are determined in the feed markets. Faba beans are also increasingly used for fractioning, but volumes are still small, and this market has been growing more slowly than anticipated.
Export demand for faba beans remains quiet because there is sufficient production in Australia. Feed-quality faba beans are currently fetching around $8 per bushel free-on-board (FOB) farm.
Soybeans
Soybeans are mostly considered to be within the oilseed sector, but they equally belong within the legume family. Soybeans are relatively new in Saskatchewan, but they have been produced on Canadian farms for more than 70 years. Advances in plant breeding have brought soybeans to the Prairies, and soybeans now rank fourth among Canada’s principal crops in terms of acreage, outranking corn.
In Saskatchewan, soybeans reached a high of 498,000 seeded acres in 2018 but dropped back steeply to around 45,000 to 70,000 acres in recent years due to production and marketing challenges, and due to improved prices for other commodities. Saskatchewan acres are estimated at 67,000 acres this year, with an estimated production of 48,000 tonnes. The soybean acreage in Manitoba is estimated at 1.43 million acres, and production at 1.43 million tonnes.
Canadian Soybean Production (Tonnes)
| 2019 | 2020 | 2021 | 2022 | 2023 | 2024 | |
|---|---|---|---|---|---|---|
| Canada | 6,145,000 | 6,358,500 | 6,224,029 | 6,543,158 | 6,980,525 | 7,196,652 |
| Quebec | 1,146,000 | 1,159,700 | 1,146,934 | 1,126,353 | 1,268,813 | 1,330,410 |
| Ontario | 3,708,200 | 3,908,700 | 3,955,870 | 3,996,015 | 4,036,036 | 4,314,285 |
| Manitoba | 1,122,300 | 1,162,800 | 1,015,853 | 1,318,459 | 1,566,858 | 1,429,825 |
| Saskatchewan | 107,200 | 68,800 | 44,502 | 36,883 | 44,656 | 48,172 |
| Alberta | 4,900 | F | F | x | F | .. |
… = not available for a specific reference period
x = suppressed to meet the confidentiality requirements of the Statistics Act
F = too unreliable to be published
Source: Mercantile based on StatsCan data
Canadian Soybean Area (Acres)
| 2019 | 2020 | 2021 | 2022 | 2023 | 2024 | |
|---|---|---|---|---|---|---|
| Canada | 5,714,300 | 5,070,300 | 5,157,986 | 5,274,200 | 5,630,700 | 5,742,600 |
| Quebec | 906,200 | 885,500 | 941,173 | 955,900 | 1,001,500 | 1,069,200 |
| Ontario | 3,114,500 | 2,850,200 | 2,806,255 | 3,080,400 | 2,913,000 | 3,118,500 |
| Manitoba | 1,469,500 | 1,149,600 | 1,287,330 | 1,134,800 | 1,595,400 | 1,425,600 |
| Saskatchewan | 150,000 | 126,700 | 74,273 | 45,400 | 68,000 | 67,000 |
| Alberta | 7,000 | 2,500 | F | x | F | .. |
… = not available for a specific reference period
x = suppressed to meet the confidentiality requirements of the Statistics Act
F = too unreliable to be published
Source: Mercantile based on StatsCan data
The Canadian soybean balance sheet shows total 2024 production at 7.1 million tonnes, with supply reaching almost 8 million tonnes, a 3-year high. Exports are expected to reach 4.5 to 5 million tonnes, and industrial use (crush) 1.9 million tonnes. Ending stocks are expected to increase to minimum 520,000 tonnes from 415,000 tonnes last year. This would represent a relatively small 6.9% stock-use ratio.

The most important export destinations over the past several years have been China, Iran, and Japan.
Canadian Soybean Exports By Destination – Top 20 (Tonnes)
| 2019 | 2020 | 2021 | 2022 | 2023 | 2024 (January – July) | |
|---|---|---|---|---|---|---|
| Algeria | 69,690 | 255,537 | 281,706 | 278,261 | 398,319 | 225,654 |
| Bangladesh | 579,649 | 297,746 | 260,523 | 81,758 | – | – |
| Belgium | 263,134 | 262,988 | 164,508 | 165,059 | 96,687 | 45,216 |
| China | 55,738 | 449,649 | 584,433 | 1,116,372 | 1,535,952 | 364,348 |
| Egypt | – | 33,021 | 153,910 | 96,499 | 402 | – |
| Germany | 181,460 | 61,189 | 66,970 | 1,610 | 59,514 | 1,623 |
| Indonesia | 177,128 | 234,461 | 311,693 | 275,418 | 265,749 | 157,053 |
| Iran | 736,395 | 779,982 | 597,163 | 476,704 | 630,709 | 29,633 |
| Italy | 376,726 | 303,747 | 292,317 | 434,007 | 151,778 | 13,427 |
| Japan | 304,580 | 282,822 | 254,732 | 338,926 | 325,954 | 202,629 |
| Malaysia | 55,484 | 73,892 | 66,455 | 60,123 | 78,564 | 71,480 |
| Netherlands | 261,638 | 273,314 | 191,962 | 127,105 | 117,396 | 46,721 |
| Norway | 25,000 | 83,026 | 153,455 | 31,427 | 37,765 | 31,503 |
| Portugal | 70,405 | 71,500 | 21,251 | 96,308 | 21,648 | 42 |
| Spain | 141,028 | 145,668 | 119,067 | 111,244 | 107,444 | 3,834 |
| Taiwan | 52,753 | 55,576 | 47,676 | 54,958 | 61,049 | 31,133 |
| Thailand | 37,708 | 46,324 | 42,978 | 22,776 | 65,014 | 32,340 |
| United Kingdom | – | 170,749 | 112,027 | 35,056 | 18,812 | 21,346 |
| United States | 134,600 | 139,070 | 154,079 | 141,466 | 99,388 | 154,158 |
| Viet Nam | 108,562 | 109,779 | 90,726 | 84,764 | 122,398 | 78,532 |
| Grand Total | 3,631,678 | 4,130,039 | 3,967,629 | 4,029,839 | 4,194,541 | 1,510,671 |
Source: Mercantile based on StatsCan data
However, to put the Canadian production and export outlook within the global context: The 2024/25 global soybean production is estimated at a record 429 million tonnes, up 34 million tonnes (+8.7%) from last year. This means that Canada represents 1.7% of the global soybean production this year. Brazil (169 million tonnes), the U.S. (125 million tonnes), and Argentina (51 million tonnes) are the major producers. China, India, Paraguay, and Russia collectively produce another 52 million tonnes.
Total global exports of soybeans are expected to add to a record 182 million tonnes, with Brazil exporting 105 million tonnes, the U.S. 50 million tonnes, Paraguay 7.3 million tonnes, Argentina 4.5 million tonnes, and Canada 4.5 to 5 million tonnes. Canada represents about 2.6% of global soybean exports, so Canada is not a price leader, but a price follower in this market.
Global crush of soybeans is expected to reach a record 347 million tonnes, with China (103 million tonnes), the U.S. (66 million tonnes), Brazil (54 million tonnes), and Argentina (40 million tonnes) being the major players.
Nevertheless, 2024/25 ending stocks of soybeans are expected to increase by 22.4 million tonnes over last year’s to 134.6 million tonnes.
There are still challenging growing conditions in South America, potentially affecting South American soybean production, and the U.S. crop also is not yet in the bin. However, the current global balance sheet looks well-supplied. Local Saskatchewan soybean bids currently range from $10.25 to $10.75 FOB farm.
Marlene Boersch is a managing partner in Mercantile Consulting Venture Inc. More information can be found at www.mercantileventure.com.