By Marlene Boersch, Mercantile Consulting Venture Inc.
October 2023
Soybeans
Soybean discussions are often included within the oilseed sector, but they equally belong within the legume side. While soybeans are relatively new in Saskatchewan, Canadian farmers have grown soybeans for more than 70 years. Advances in plant breeding over the past years are spurring on a surge in production on the Prairies and soybeans now rank fourth among Canada’s principal crops in terms of acreage. With the development of new early-maturing soybean varieties, the crop can thrive in Quebec and Manitoba, as well as parts of the Maritimes, Southeast Saskatchewan, and Southern Alberta.
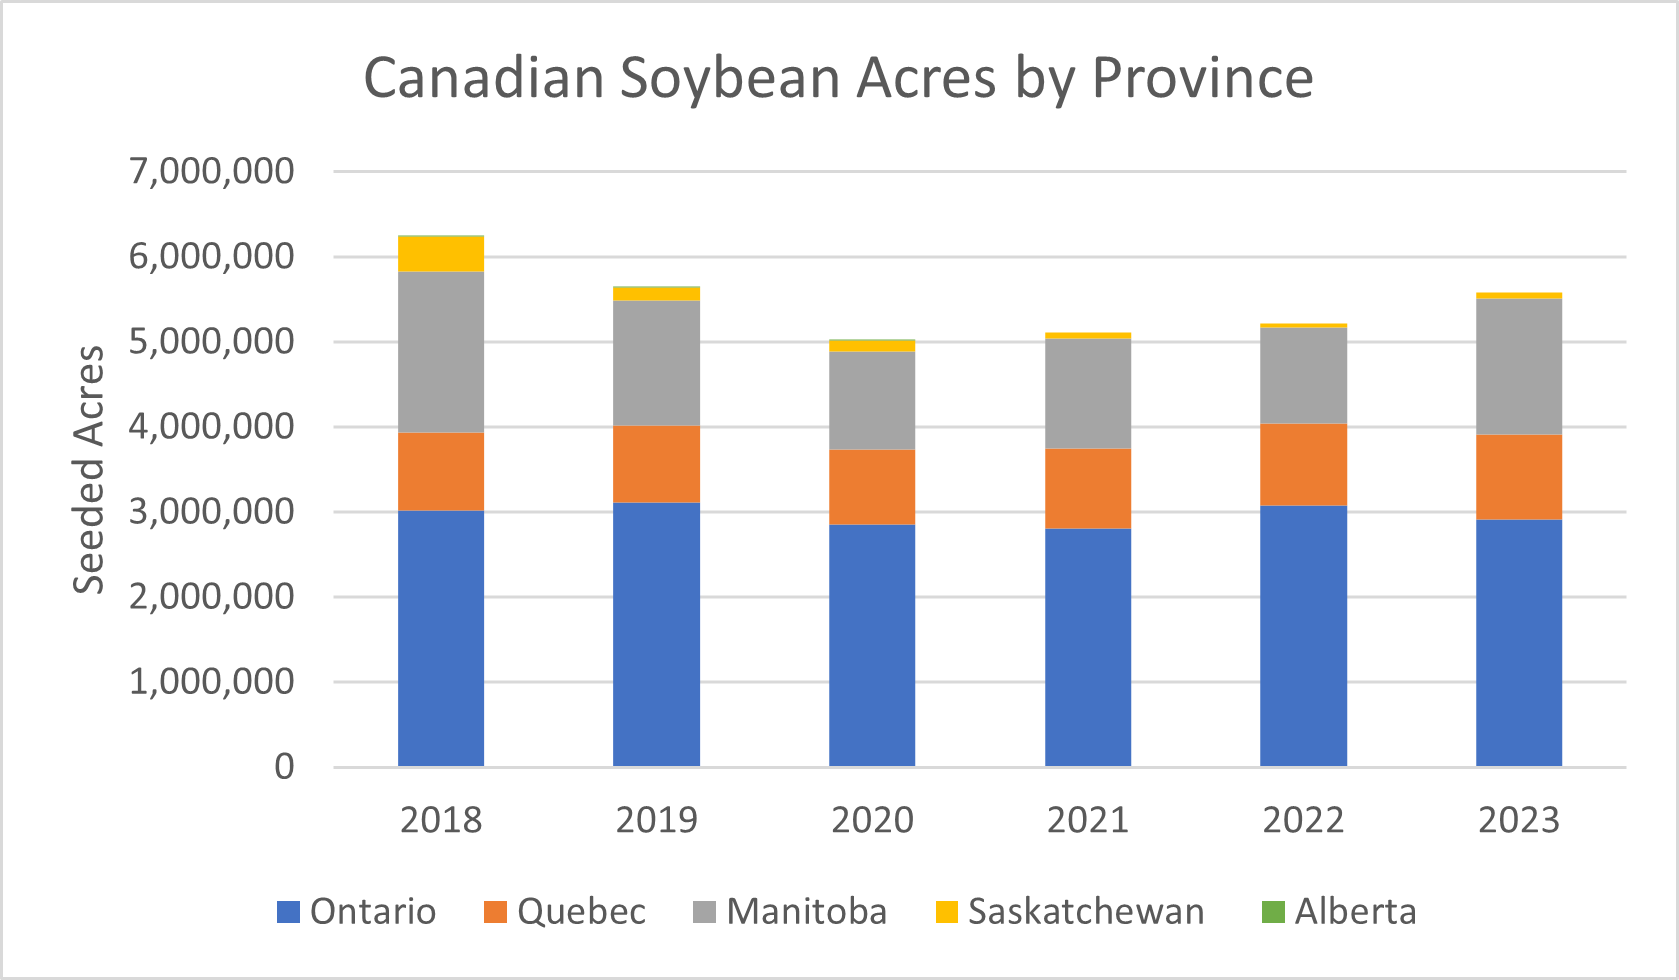
In Saskatchewan, soybeans reached a high of 498,000 seeded acres in 2018, but dropped back to 45,000 acres in 2022 due to production and marketing challenges. Saskatchewan acres increased again this year to 68,000 acres and are expected to continue to increase over the coming years. Similarly, Manitoba acres reached almost 2 million acres to drop back to 1.1 million acres in 2022 but are back to 1.6 million acres this year.
Canadian Soybean Seeded Acres by Province
| Seeded Acres | ||||||
| 2018 | 2019 | 2020 | 2021 | 2022 | 2023 | |
| Maritimes | n/a | |||||
| Ontario | 3,020,000 | 3,114,500 | 2,850,200 | 2,806,255 | 3,080,400 | 2,913,000 |
| Quebec | 915,000 | 906,200 | 885,500 | 941,173 | 955,900 | 1,001,500 |
| Manitoba | 1,890,000 | 1,469,500 | 1,149,600 | 1,287,330 | 1,134,800 | 1,595,400 |
| Saskatchewan | 407,500 | 150,000 | 126,700 | 74,273 | 45,400 | 68,000 |
| Alberta | 18,300 | 7,000 | 2,500 | n/a | n/a | n/a |
| Canada | 6,320,100 | 5,714,300 | 5,070,300 | 5,157,986 | 5,274,200 | 5,630,700 |
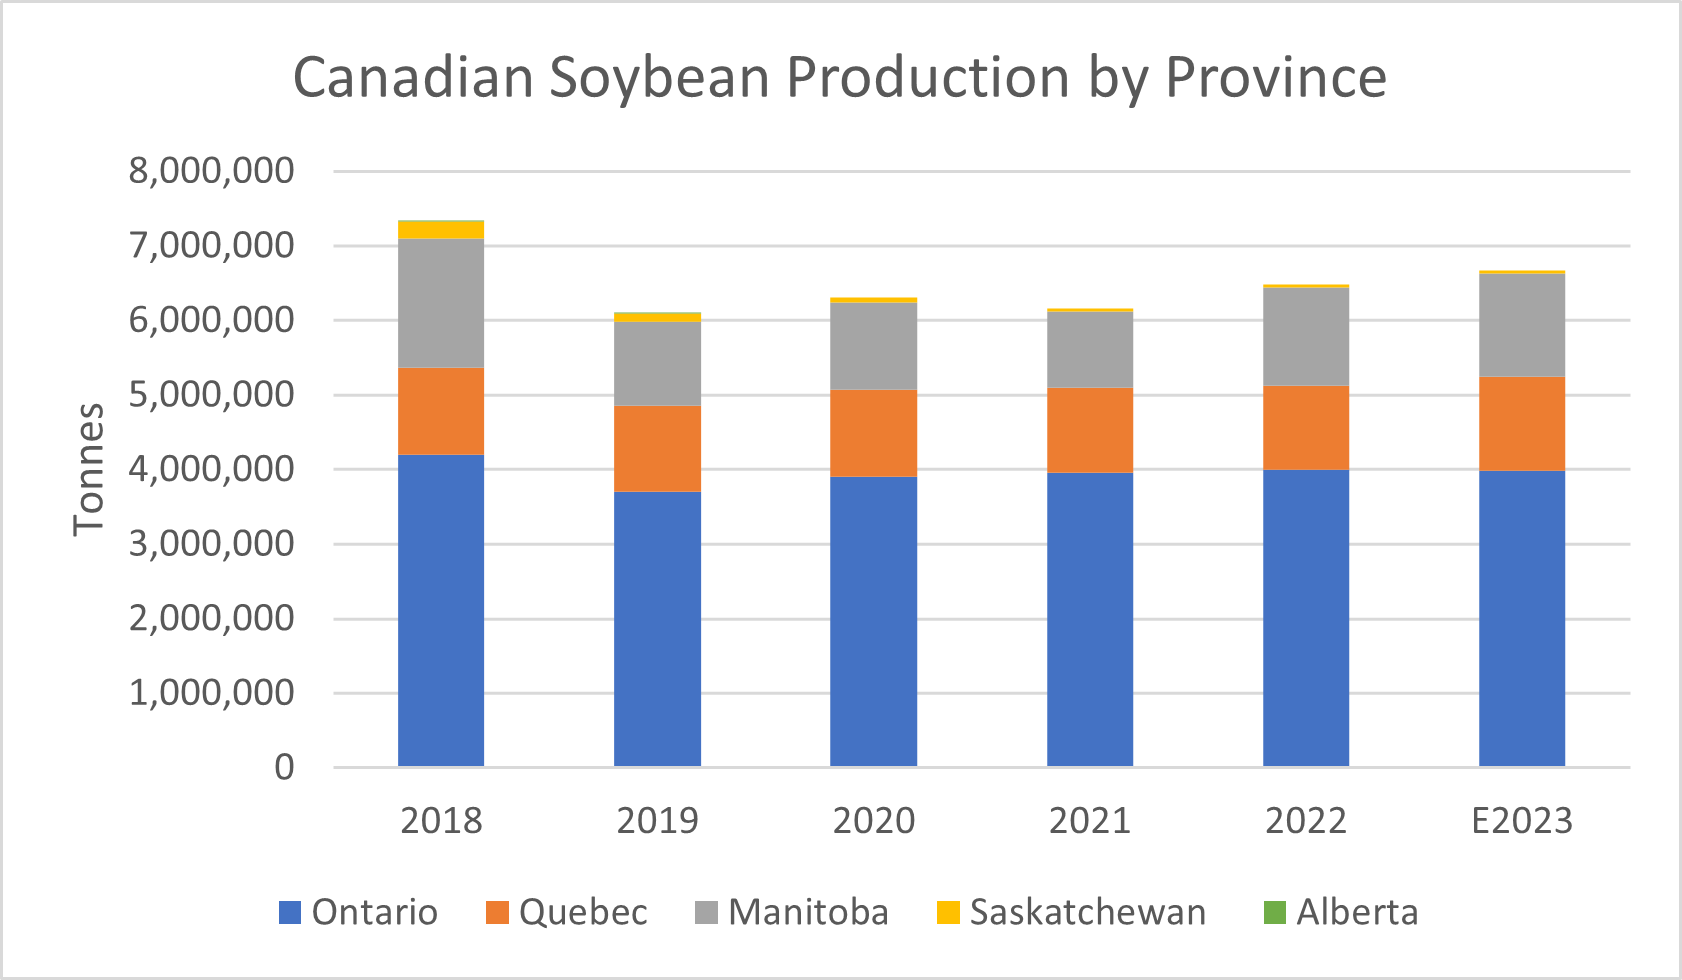
In their latest Sept. 14 estimate, Statistics Canada (StatCan) estimated Canadian soybean production at 6.733 million tonnes up 2.7% from last year. This is due to the 6.7% increase in acreage this year and despite a drop in yield. About 38,000 tonnes are expected to come from Saskatchewan.
Canadian Soybean Production by Province
| Production (tonnes) | ||||||
| 2018 | 2019 | 2020 | 2021 | 2022 | 2023 | |
| Maritimes | n/a | |||||
| Ontario | 4,200,500 | 3,708,200 | 3,908,700 | 3,955,870 | 3,996,015 | 3,984,600 |
| Quebec | 1,164,000 | 1,146,000 | 1,159,700 | 1,146,934 | 1,126,353 | 1,261,900 |
| Manitoba | 1,731,600 | 1,122,300 | 1,162,800 | 1,015,853 | 1,318,459 | 1,378,000 |
| Saskatchewan | 231,800 | 107,200 | 68,800 | 44,502 | 36,883 | 38,100 |
| Alberta | 11,600 | 4,900 | n/a | n/a | n/a | n/a |
| Canada | 7,416,600 | 6,145,000 | 6,358,500 | 6,224,029 | 6,543,158 | 6,722,400 |

The Canadian soybean supply should rise to 7.5 million tonnes this crop year from 7.3 million tonnes last crop year (+2.6% over last year).
On the demand side, about two thirds of total demand is for export (either as raw soybeans or processed for end use), while domestic demand comprises one third (industrial use, feed-waste-dockage, seed). Regarding exports, Canada has traditionally exported top-quality food-grade soybeans with specialty traits for edamame, tofu, soy sauce, and miso. The industry is continuing to serve this premium market, while also increasing its production of commodity soybeans for processing into soy protein, vegetable oil, animal feed, and a growing range of industrial products. Most of the soybeans produced in the West will end up as commodity soybeans marketed into Asia via the West Coast.
The top bulk soybean market for Canadian soybeans in 2022 was China (1.1 million tonnes), while Iran (477,000 tonnes), Italy (434,000 tonnes), Japan (339,000 tonnes), and Belgium (165,000 tonnes) also purchased substantial volumes from Canada, mostly for edible purposes.
Top 10 Canadian Soybean Export Destinations
| 2018 | 2019 | 2020 | 2021 | 2022 |
2023 (Jan-July) |
|
| Algeria | 69,689,846 | 255,537,371 | 281,706,259 | 278,261,168 | 42,421,398 | |
| Bangladesh | 71,874,370 | 579,649,122 | 297,746,179 | 260,523,106 | 81,758,112 | |
| Belgium | 35,166,110 | 263,133,584 | 262,987,533 | 164,508,151 | 165,058,501 | 35,833,342 |
| China | 3,510,857,932 | 55,737,831 | 449,648,874 | 584,432,664 | 1,116,371,807 | 371,663,125 |
| Indonesia | 53,390,550 | 177,128,380 | 234,460,784 | 311,693,117 | 274,980,691 | 141,506,202 |
| Iran | 122,179,379 | 736,395,168 | 779,982,321 | 597,162,596 | 476,704,273 | 137,326,341 |
| Italy | 262,110,417 | 376,725,927 | 303,747,294 | 292,316,916 | 434,007,213 | 804,767 |
| Japan | 340,377,182 | 304,579,692 | 282,821,762 | 254,651,507 | 338,864,584 | 209,555,137 |
| Netherlands | 85,230,755 | 261,637,635 | 273,313,876 | 191,962,146 | 127,046,444 | 5,873,716 |
| United States | 192,872,544 | 134,600,176 | 139,069,628 | 154,079,416 | 141,465,991 | 40,281,847 |
| Grand Total | 4,674,059,239 | 2,959,277,361 | 3,279,315,622 | 3,093,035,878 | 3,434,518,784 | 985,265,875 |
As the tables below exhibit, within the international context of soybean production and trade, Canada is a small player with about 1.7% of global production and 2.7% of global exports. Regarding production, the big players are Brazil (163 million tonnes), the USA (113 million tonnes), and Argentina (48 million tonnes). Within commodity soybean exports, the determinant players are Brazil (97 million tonnes), the USA (49 million tonnes) and Paraguay (6 million tonnes). Being a relatively small participant in the markets, Canada is mostly price taker.
Global Soybean Production
| Production (thousand tonnes) | 2019/20 | 2020/21 | 2021/22 | 2022/23 | F2023/24 |
| Brazil | 128,500 | 139,500 | 130,500 | 156,000 | 163,000 |
| United States | 96,667 | 114,749 | 121,528 | 116,377 | 112,837 |
| Argentina | 48,800 | 46,200 | 43,900 | 25,000 | 48,000 |
| China | 18,092 | 19,602 | 16,395 | 20,280 | 20,500 |
| India | 9,300 | 10,456 | 11,889 | 12,411 | 12,000 |
| Paraguay | 10,553 | 9,642 | 4,183 | 9,050 | 10,000 |
| Canada | 6,145 | 6,359 | 6,224 | 6,543 | 6,700 |
| Other | 23,139 | 22,460 | 25,524 | 24,448 | 28,288 |
| Total | 341,196 | 368,968 | 360,143 | 370,109 | 401,325 |
| % Canada | 1.8% | 1.7% | 1.7% | 1.8% | 1.7% |
Global Soybean Exports
| Exports (thousand tonnes) | 2019/20 | 2020/21 | 2021/22 | 2022/23 | F2023/24 |
| Brazil | 92,135 | 81,650 | 79,063 | 95,000 | 97,000 |
| United States | 45,800 | 61,664 | 58,571 | 54,159 | 48,716 |
| Paraguay | 6,619 | 6,330 | 2,273 | 5,800 | 6,000 |
| Argentina | 10,004 | 5,195 | 2,861 | 4,000 | 4,600 |
| Canada | 3,909 | 4,554 | 4,284 | 4,240 | 4,550 |
| Other | 7,115 | 5,490 | 6,839 | 6,885 | 7,553 |
| Total | 165,582 | 164,883 | 153,891 | 170,084 | 168,419 |
| % Canada | 2.4% | 2.8% | 2.8% | 2.5% | 2.7% |
Global soybean production is up significantly this crop year (+8%), while export demand for the crop is forecast to be down this year (-1%), albeit still at the second highest level. However, this is assuming that China will still import 100 million tonnes of soybeans, which may well be optimistic.
In addition, the soybean and canola markets have been very oil-driven over the past two years, but in our view, there is sufficient vegetable oil available this season and soybeans do not justify their current premium to feed grains. Coupled with economic weakness in China, the main buyer, we therefore expect further weakness in this market.
Faba Beans
The Canadian faba bean acreage has remained small, ranging from 72,000 to 121,000 acres across Canada over the past few years. Saskatchewan and Alberta remain the determinant provinces with roughly 34,000 and 44,000 acres seeded to faba beans this year.
Canadian Faba Bean Seeded Acres by Province
| Seeded Acres | ||||||
| 2018 | 2019 | 2020 | 2021 | 2022 | 2023 | |
| Ontario | 2,100 | 2,000 | 805 | 800 | ||
| Quebec | 700 | 1,000 | 700 | 663 | 1,300 | |
| Manitoba | 6,600 | 7,100 | 7,600 | 9,349 | 2,000 | 5,000 |
| Saskatchewan | 37,000 | 50,000 | 55,900 | 61,301 | 27,700 | 37,000 |
| Alberta | 34,700 | 35,000 | 32,500 | 48,972 | 42,600 | 47,300 |
| Canada | 81,100 | 93,100 | 99,200 | 121,394 | 72,300 | 91,400 |
Blue: adjusted.

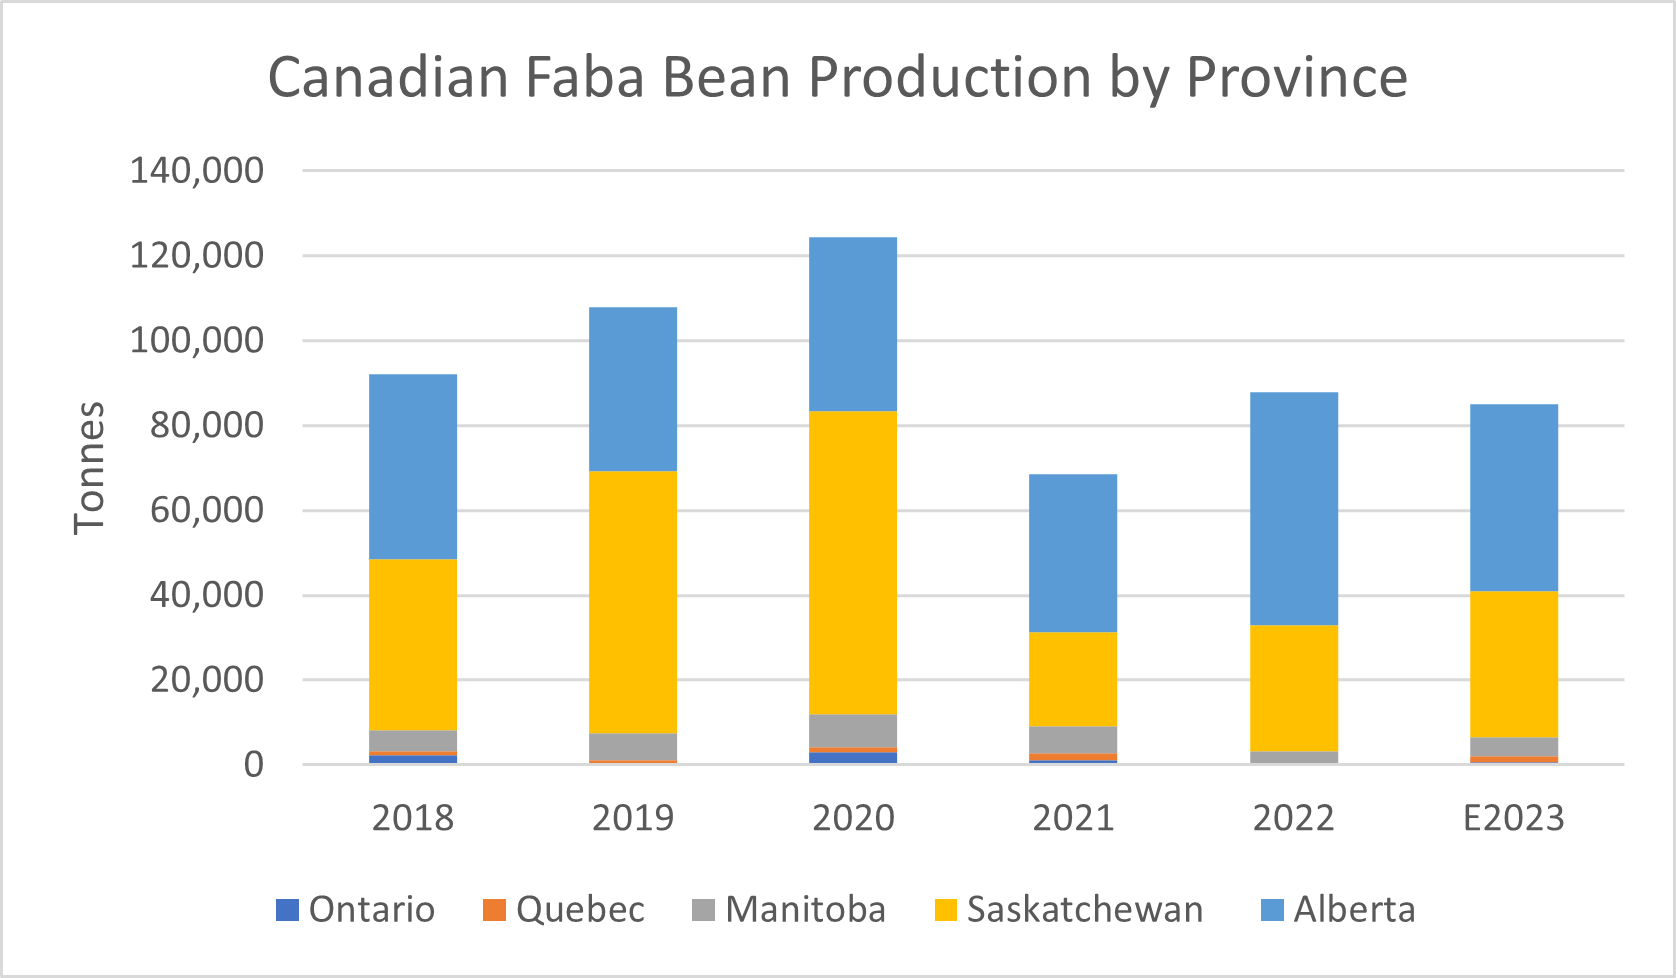
Production has ranged from 68,000 to 125,000 tonnes over the same period. We project this year’s production at approximately 85,000 tonnes, with 34,000 tonnes in Saskatchewan and 44,000 tonnes in Alberta.
Canadian Faba Bean Production by Province
| Production (tonnes) | ||||||
| 2018 | 2019 | 2020 | 2021 | 2022 | E2023 | |
| Ontario | 2,300 | 3,100 | 1,065 | 745 | ||
| Quebec | 1,000 | 1,200 | 1,100 | 1,800 | 1,210 | |
| Manitoba | 5,000 | 6,300 | 7,800 | 6,278 | 3,202 | 4,654 |
| Saskatchewan | 40,300 | 61,800 | 71,500 | 22,202 | 29,819 | 34,439 |
| Alberta | 43,400 | 38,500 | 41,000 | 37,130 | 54,773 | 44,027 |
| – | ||||||
| Canada | 92,000 | 107,800 | 124,500 | 68,475 | 87,794 | 85,075 |
| Yields (kg/ha) | 2,968 | 3,071 | 3,236 | 1,490 | 3,007 | 2,300 |
Blue: adjusted/estimates.
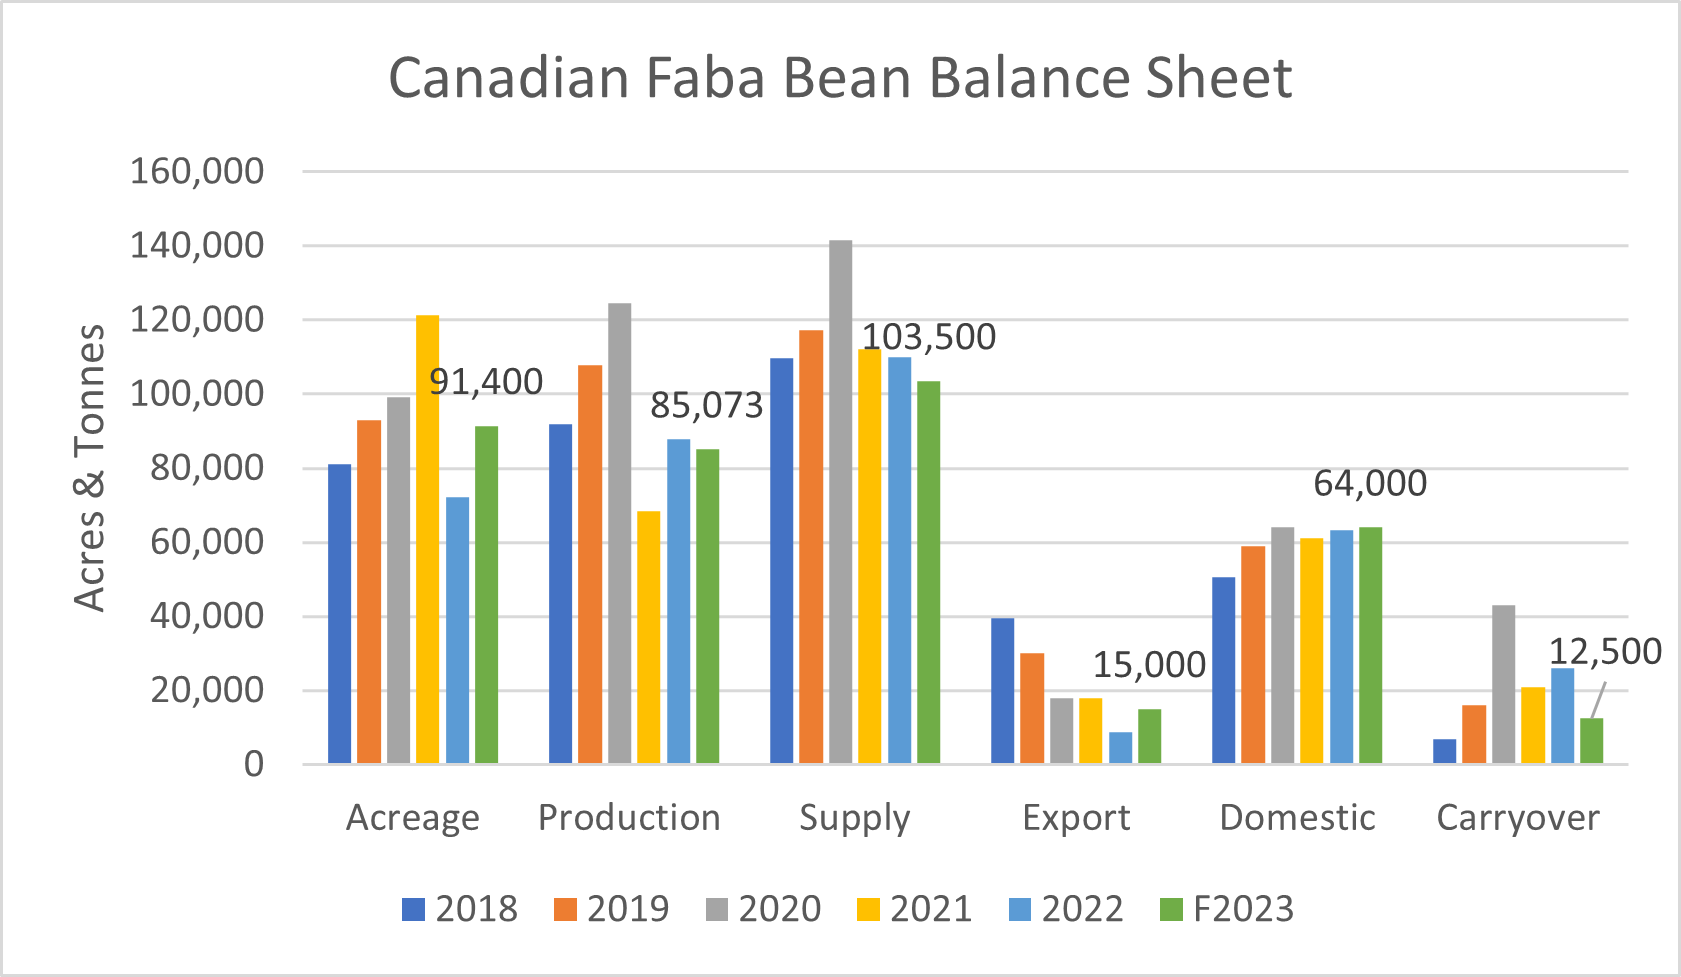
Given about 25,000 tonnes of carry-in this year, we expect a faba bean supply this year in Canada at approximately 104,000 tonnes, 6% smaller than in the previous year. On the demand side, we project total usage of fabas at 91,000 tonnes. Our usage projection is comprised of 15,000 tonnes exports, 12,000 tonnes seed & waste, and approximately 64,000 tonnes domestic usage, mostly for feed. If these numbers prove correct, then ending stocks will drop to a relatively small 12,500 tonnes, still a 17% stock-use ratio.
The area of demand for faba beans has remained the challenge for the crop and requires some clarification. At over 4 million tonnes, global consumption of faba beans is actually quite large. About 41% of total consumption is consumed in China, which is also the largest producer at 1.5 to 2 million tonnes annually. Other large consumers are Egypt, Ethiopia, Sudan, and Morocco. The biggest producers are China, Ethiopia, the United Kingdom (U.K.), Australia, and France.

United Nations Food and Agriculture Organization (FAO) numbers.
About 20% of the consumed faba beans (750,000-800,000 tonnes) are imported, with Egypt by far the biggest importer at 500,000-550,000 tonnes annually. All other buyers purchase much smaller volumes; these include Saudi Arabia, Norway, Sudan, and Italy.
Egypt imports primarily from the U.K., Australia, and France.
Quality requirements in Egypt are strict, and medium to large seed size with high tannin are preferred for food use as well as for processing into concentrated protein fractions. It is hard for Canadian product to compete with U.K., Australian, and French faba beans on quality and also on freight costs.
This is why most Canadian-grown faba beans are primarily used domestically for feed (mostly hog and poultry, though there is potential for cattle as well) and in pet food. This also means that prices are mostly determined in the feed markets.
Given the higher protein content of faba beans compared to peas, there also still is the prospect of faba beans being used for fractioning, but this has not yet taken off, partly due to the vicine content of faba beans.
Current bids range from $10-10.50 per bushel (/bu) free on board (FOB) farm for feed quality, and from $13.50 to $14.00/bu for #2 faba beans for export.
Marlene Boersch is a managing partner in Mercantile Consulting Venture Inc. More information can be found at www.mercantileventure.com.