By Marlene Boersch, Mercantile Consulting Venture Inc.
October 2022
Canadian peas generally make up roughly 25-30% of the global pea production, and provide 45-60% of pea exports, so we will look at the Canadian production outlook first.
Regarding Canadian peas, it has been well noted that pea acres have dropped the past three years in a row, and this trend is concerning pea processors and traders. High prices for major commodities (i.e., bigger competition for acres) and the build-up of diseases (like root rot) are seen as the causes, and we do not see these pressures ease over the next while. Beyond the acreage trend, we are also concerned about long term yield trends. “Regular” yield gains seem to have stalled. It is not clear if this is due to climatic factors and/or increasing disease pressure.
Canadian Pea Production, 2012 to 2022
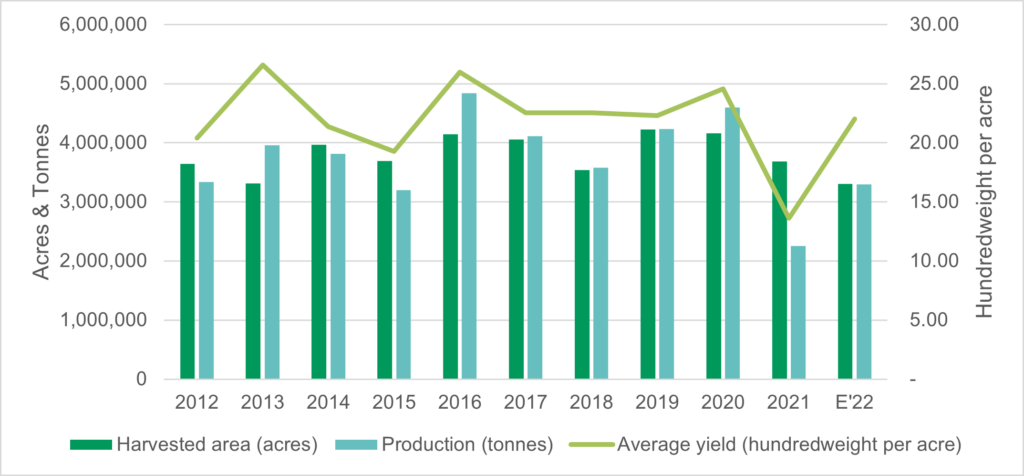
This year’s yields again vary widely by region, and there is no consensus about the final average yield at the time of writing. Indeed, the production estimates discussed for peas at this year’s Canadian Pulse and Special Crops Trade Association (CPSC) conference ranged from 3.1 to 3.6 million (M) tonnes, which represents a significant 5.5 bushels per acre (bu/ac) yield variance. The Mercantile yield estimate is currently at 39.4 bu/ac, which seems supported by the weighted provincial ag department yield of 39.5 bu/ac (see below). Our yield puts the 2022 pea production number at 3.6 M tonnes, the higher end of the estimates.
Table 1
| Peas | Thousand Acres | % by Province 2022 | 2022 Production Est. (thousand tonnes) | |||||
| 2018 | 2019 | 2020 | 2021 | Est. 2022 | Est. 2022Yield | Est. 2022Produ-ction | ||
| MB | 85 | 126 | 175 | 224 | 189 | 5.6% | 60.0 | 308 |
| SK | 1,935 | 2,335 | 2,332 | 2,099 | 1,809 | 53.9% | 34.0 | 1,674 |
| AB | 1,511 | 1,800 | 1,650 | 1,428 | 1,324 | 39.5% | 44.0 | 1,585 |
| BC | 70 | 52 | 65 | 49 | 32 | 1.0% | 44.0 | 38 |
| Total for Western Canada | 3,602 | 4,313 | 4,212 | 3,800 | 3,353 | 88.2% | 39.5 | 3,605 |
| % SK | 54% | 54% | 55% | 55% | 53% | vs. 2021 | ||
| % AB | 42% | 42% | 39% | 38% | 41% | |||
Competition to Canadian peas in the export markets looks to increase from last year’s, especially by higher supplies from Russia. Some traders put the Russian pea crop as high as 3.7 M tonnes, though we think that is 200,000-300,000 tonnes too high. Significant volumes of Russian peas tend to disappear in the domestic feed markets, and this year there is the additional handicap of war-restricted fobbing space and ocean freight. The ongoing war makes forecasting Russian pea exports near impossible and adds significant uncertainty to the export market outlook. However, if Russian shippers can secure the fobbing space and ocean freight for peas, then Russian peas will again feature into Bangladesh and Pakistan, and potentially into China. Remember that last crop year, Canada sold no peas at all into Bangladesh (compared to a 5-year average export performance during 2016/17 to 2020/21 of 444,000 tonnes).
Competition to Canadian Peas
Table 2
| 2021 Est.Production (thousand tonnes) | 2022 Est.Production (thousand tonnes) | ||
| United States (U.S.) | 390 | 747 | U.S. Dry Pea and Lentil Council est. |
| Ukraine | 578 | 250 | |
| Russia | 2,700 | 3,500-3,700 | Range of estimates |
| Australia | 261 | 269 | |
| European Union (EU) | 1,826 | 2,056 | European Commission est., mostly used domestically |
| Total | 5,755 | 6,822-7,022 |
On Canadian exports, the consensus is that ~2.6 M tonnes of exports are expected for this year. However, the big potential change factor is the question if China will buy feed peas, or only peas for human consumption. China’s edible pea market is open for about 1.3 M tonnes annually, but Canada has also shipped as many as 1.3 M tonnes of peas for feed. So, the inclusion of feed peas will make the clear difference between a balanced versus a much tighter supply situation. We are currently using 1.5 M tonnes for China, which is not overly aggressive, unless China starts accepting Russian peas (we do not expect this for this year; there are not phytosanitary agreements in place between China and Russia). We are also disappointed by the fact that the EU is allowing Russian peas (and other agriculture products) into the EU, as food products are exempt from EU sanctions against Russia. However, it is not clear, how acceptable Russian goods are to EU importers.
Improved domestic and U.S. demand over the past two years for domestic fractioning and for pet food have also added a new competitive component, helping to stabilize the market when export movement is slow. We figure that (including seed) close to 1 M tonnes of peas disappear to the latter markets. There also is a recognition that pea prices will have to be relatively strong to attract acres next spring, so the market will have to demonstrate at that time how much it wants ample pea acres for the next year.
The current production and export assumptions would leave Canadian peas with relatively small ending stocks of 300,000-430,000 tonnes, a 9-13% stock-use ratio. However, there are still several unanswered questions in the export/usage numbers that could change the outlook materially.
Lentils
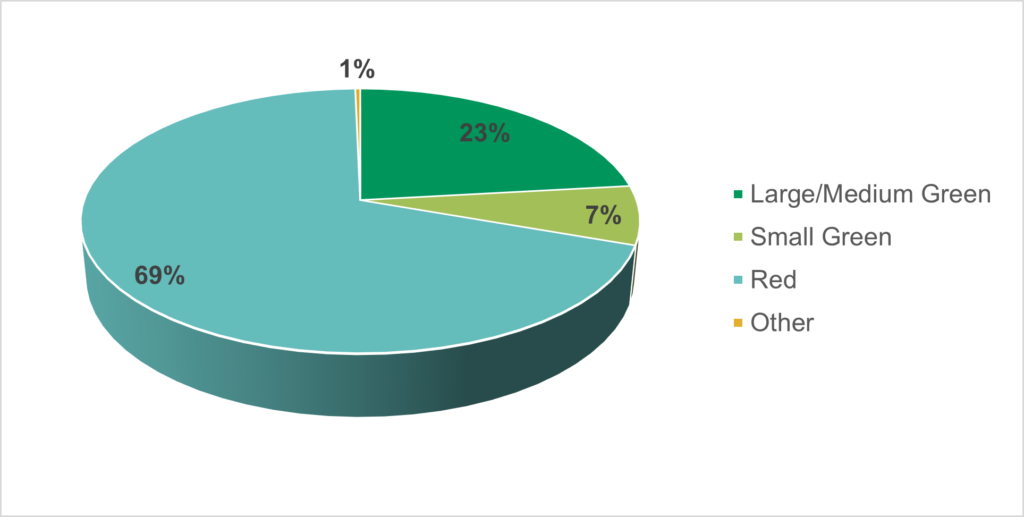
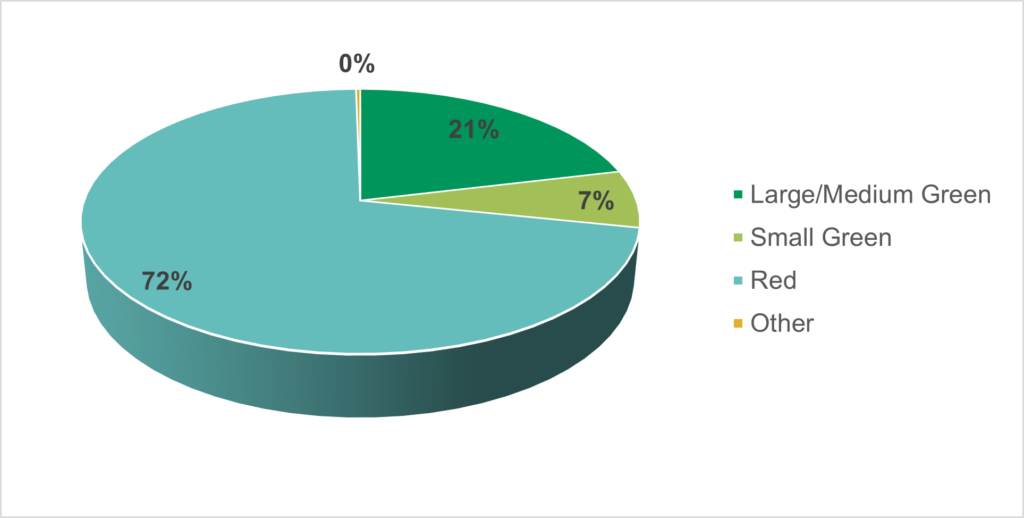
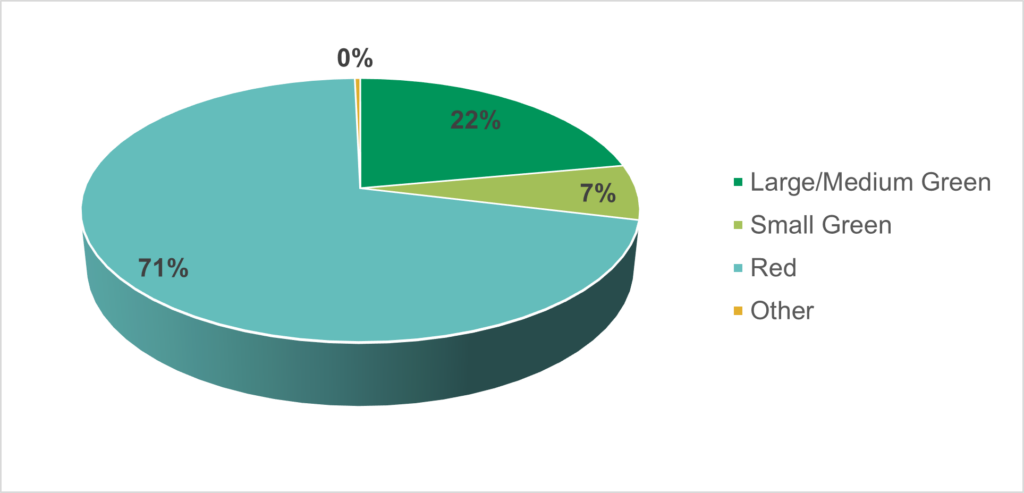
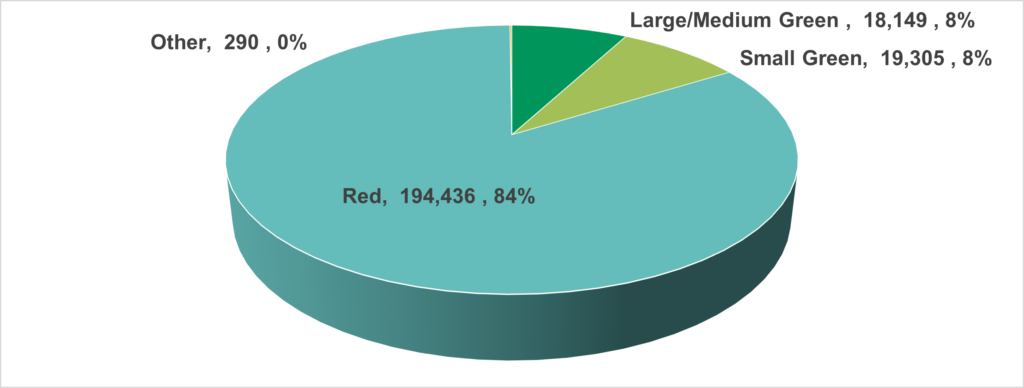
There is no final agreement on the overall lentil production number, and there is the additional uncertainty about the acreage allocation by type of lentil. Some seem to think that our green lentil acreage is too high. However, while these acreage numbers are very hard/almost impossible to verify, our take is that we have ~69% of lentil acres in red lentils, compromising 72% of the 2.6 M tonnes of lentil production due to the higher red lentil yield.
Lentil Acreage by Type, 2022
Lentil Production by Type, 2022
Lentil yields have again been variable this year, depending on region and rainfall received. The provincial yield assessments have been stable over the past two weeks at a weighted average of only 1,208 pounds per acre (lb/ac) (see below), but Mercantile is still using a 1,300 lb/ac average yield. Meanwhile, Statistics Canada posted a 1,438 lb/ac yield in their September report (which is considered too high). AAFC last week adopted that number for a 2.78 M tonnes production projection. Final changes in yield will be important to the green lentil side as green lentils are tight, but especially when combined with the ample Australian production, red lentils look to be well supplied.
Table 3
| Lentils | Thousand Acres | % 2022 Acres | 2022 Production Est. (thousand tonnes) | |||||
| 2018 | 2019 | 2020 | 2021 | 2022 | Est. 2022 Yield | Est. 2022 Production | ||
| MB | 7 | 11 | 0.3% | 1,200 | 6 | |||
| SK | 3,346 | 3,388 | 3,807 | 3,788 | 4,009 | 89.4% | 1,174 | 2,135 |
| AB | 420 | 388 | 423 | 511 | 465 | 10.4% | 1,500 | 317 |
| BC | ||||||||
| Total for Western Canada | 3,766 | 3,776 | 4,230 | 4,305 | 4,486 | 104.2% | 1,208 | 2,458 |
| % SK | 89% | 90% | 90% | 88% | 89% | vs. 2021 | ||
| % AB | 11% | 10% | 10% | 12% | 10% | |||
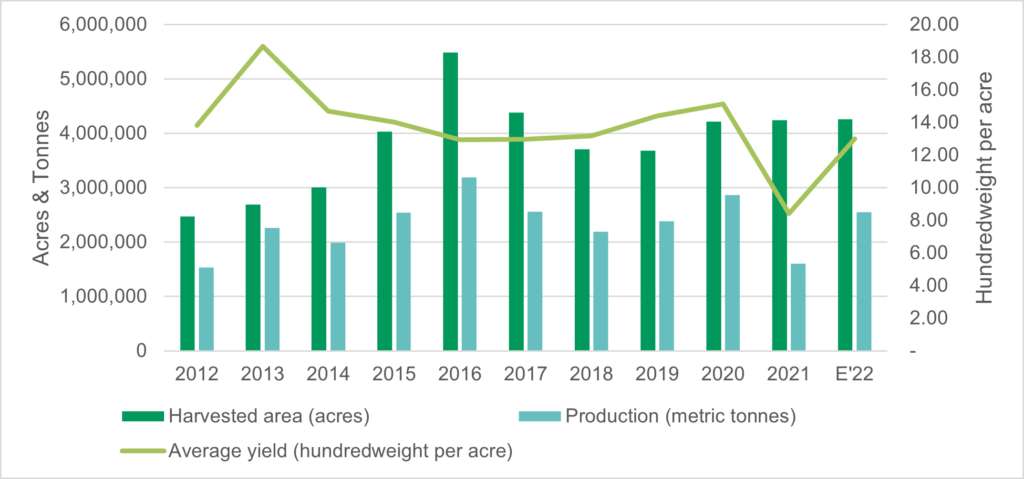
Canadian Lentil Production, 2012 to 2022
Forward buying for lentils during the summer has been relatively slow as buyers have been hoping that new crop prices will drop during harvest. However, fewer production contracts and relatively tight grower holding have (so far) prevented prices from falling over the past month. The result is that buyers are not well covered, and we think they will come to Canada to buy additional tonnage over the next month, or so. However, tight buying time frames might become problematic because of the lingering uncertainties in container freight execution. There are still very few containers coming inland, and the majority of containers arriving in Vancouver (~75%) are still returned to Asia empty. There is no doubt that this will again impact pulse and special crops export execution this crop year. Our advice to buyers is to work with much longer timelines than in the past, as shippers are simply unable to “control” container freight.
There were some bulk forward sales on the books for September and October this fall for India, Turkey, and the United Arab Emirates (UAE), which are currently being executed. This is supporting a decent start to the shipping season, especially since there were fewer production contracts signed than in the past. It is interesting to note in this context that India is currently buying some green lentils to compensate for a smaller pigeon pea crop, further supporting the green lentil market. Demand from India for lentils should reach 1 M tonnes this year (reds and greens combined), but this is for all origins. With another big Australia crop lentil crop coming up that will reach the markets in November and December, there will be ample competition to Canadian red lentils. Any Canadian reds not yet sold before that time, will likely have to wait for the next sales window in February and March 2023 (for comparison, India bought a total of 1.1 M tonnes of lentils from all origins during calendar year 2020, with approximately two thirds coming from Canada). Additional important destinations for Canadian lentils are Turkey, the UAE, Bangladesh, and Pakistan.
We expect total Canadian lentil exports to reach 2.15 M tonnes this year, up from 1.6 M tonnes last crop year, but below the 2020/21 exports of 2.3 M tonnes due to the competition by Australia.
Canadian Lentil Exports by Destination, 2015/16 to Projected 2022/23
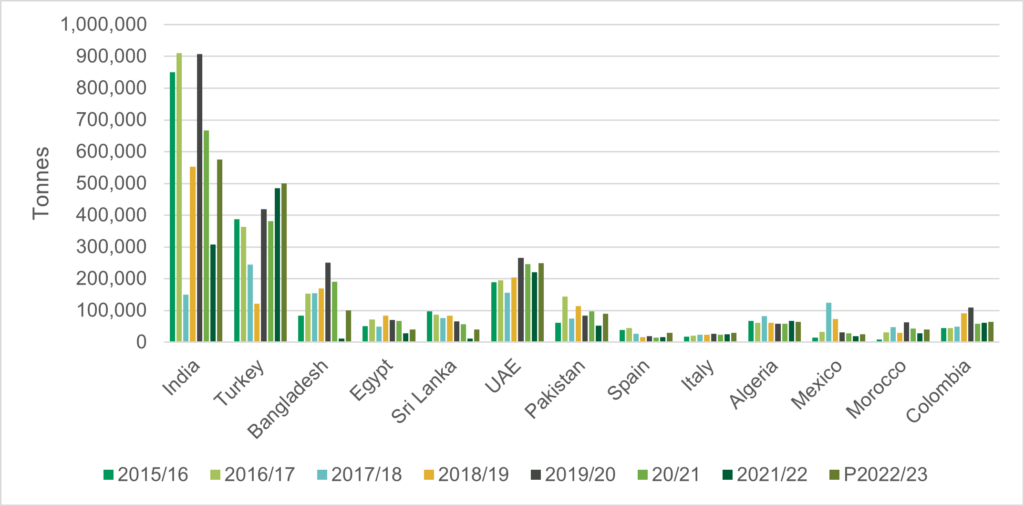
Competition to Canadian reds into the Indian subcontinent has increased over the past year because of the increasing lentil production in Australia, combined with the latest ability by Australian exporters to ship lentils in bulk, thus lowering their costs and bypassing the problems with container availability. Some additional competition might come from Russia and Kazakhstan, but here logistics remain a big unknown.
Global Lentil Production, 2020/21 to Projected 2022/23
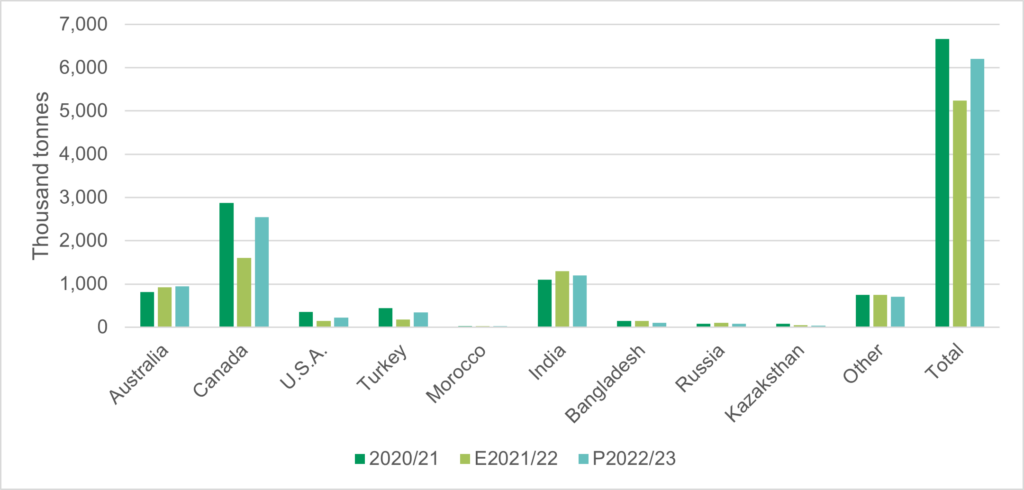
Projected ending stocks for lentils by type point towards tight green lentil markets, with some slack in red lentils. Export volumes to India and to Turkey are the ones to watch.
Lentil Exports by Type, 2022
Lentil Ending Stocks by Type, 2022
Marlene Boersch is a managing partner in Mercantile Consulting Venture Inc. More information can be found at www.mercantileventure.com.
