By Marlene Boersch, Mercantile Consulting Venture Inc
October 2025
Most Canadian pulses are in the bin at the time of writing, so this is a good time to recap the results and firm up the balance sheets.
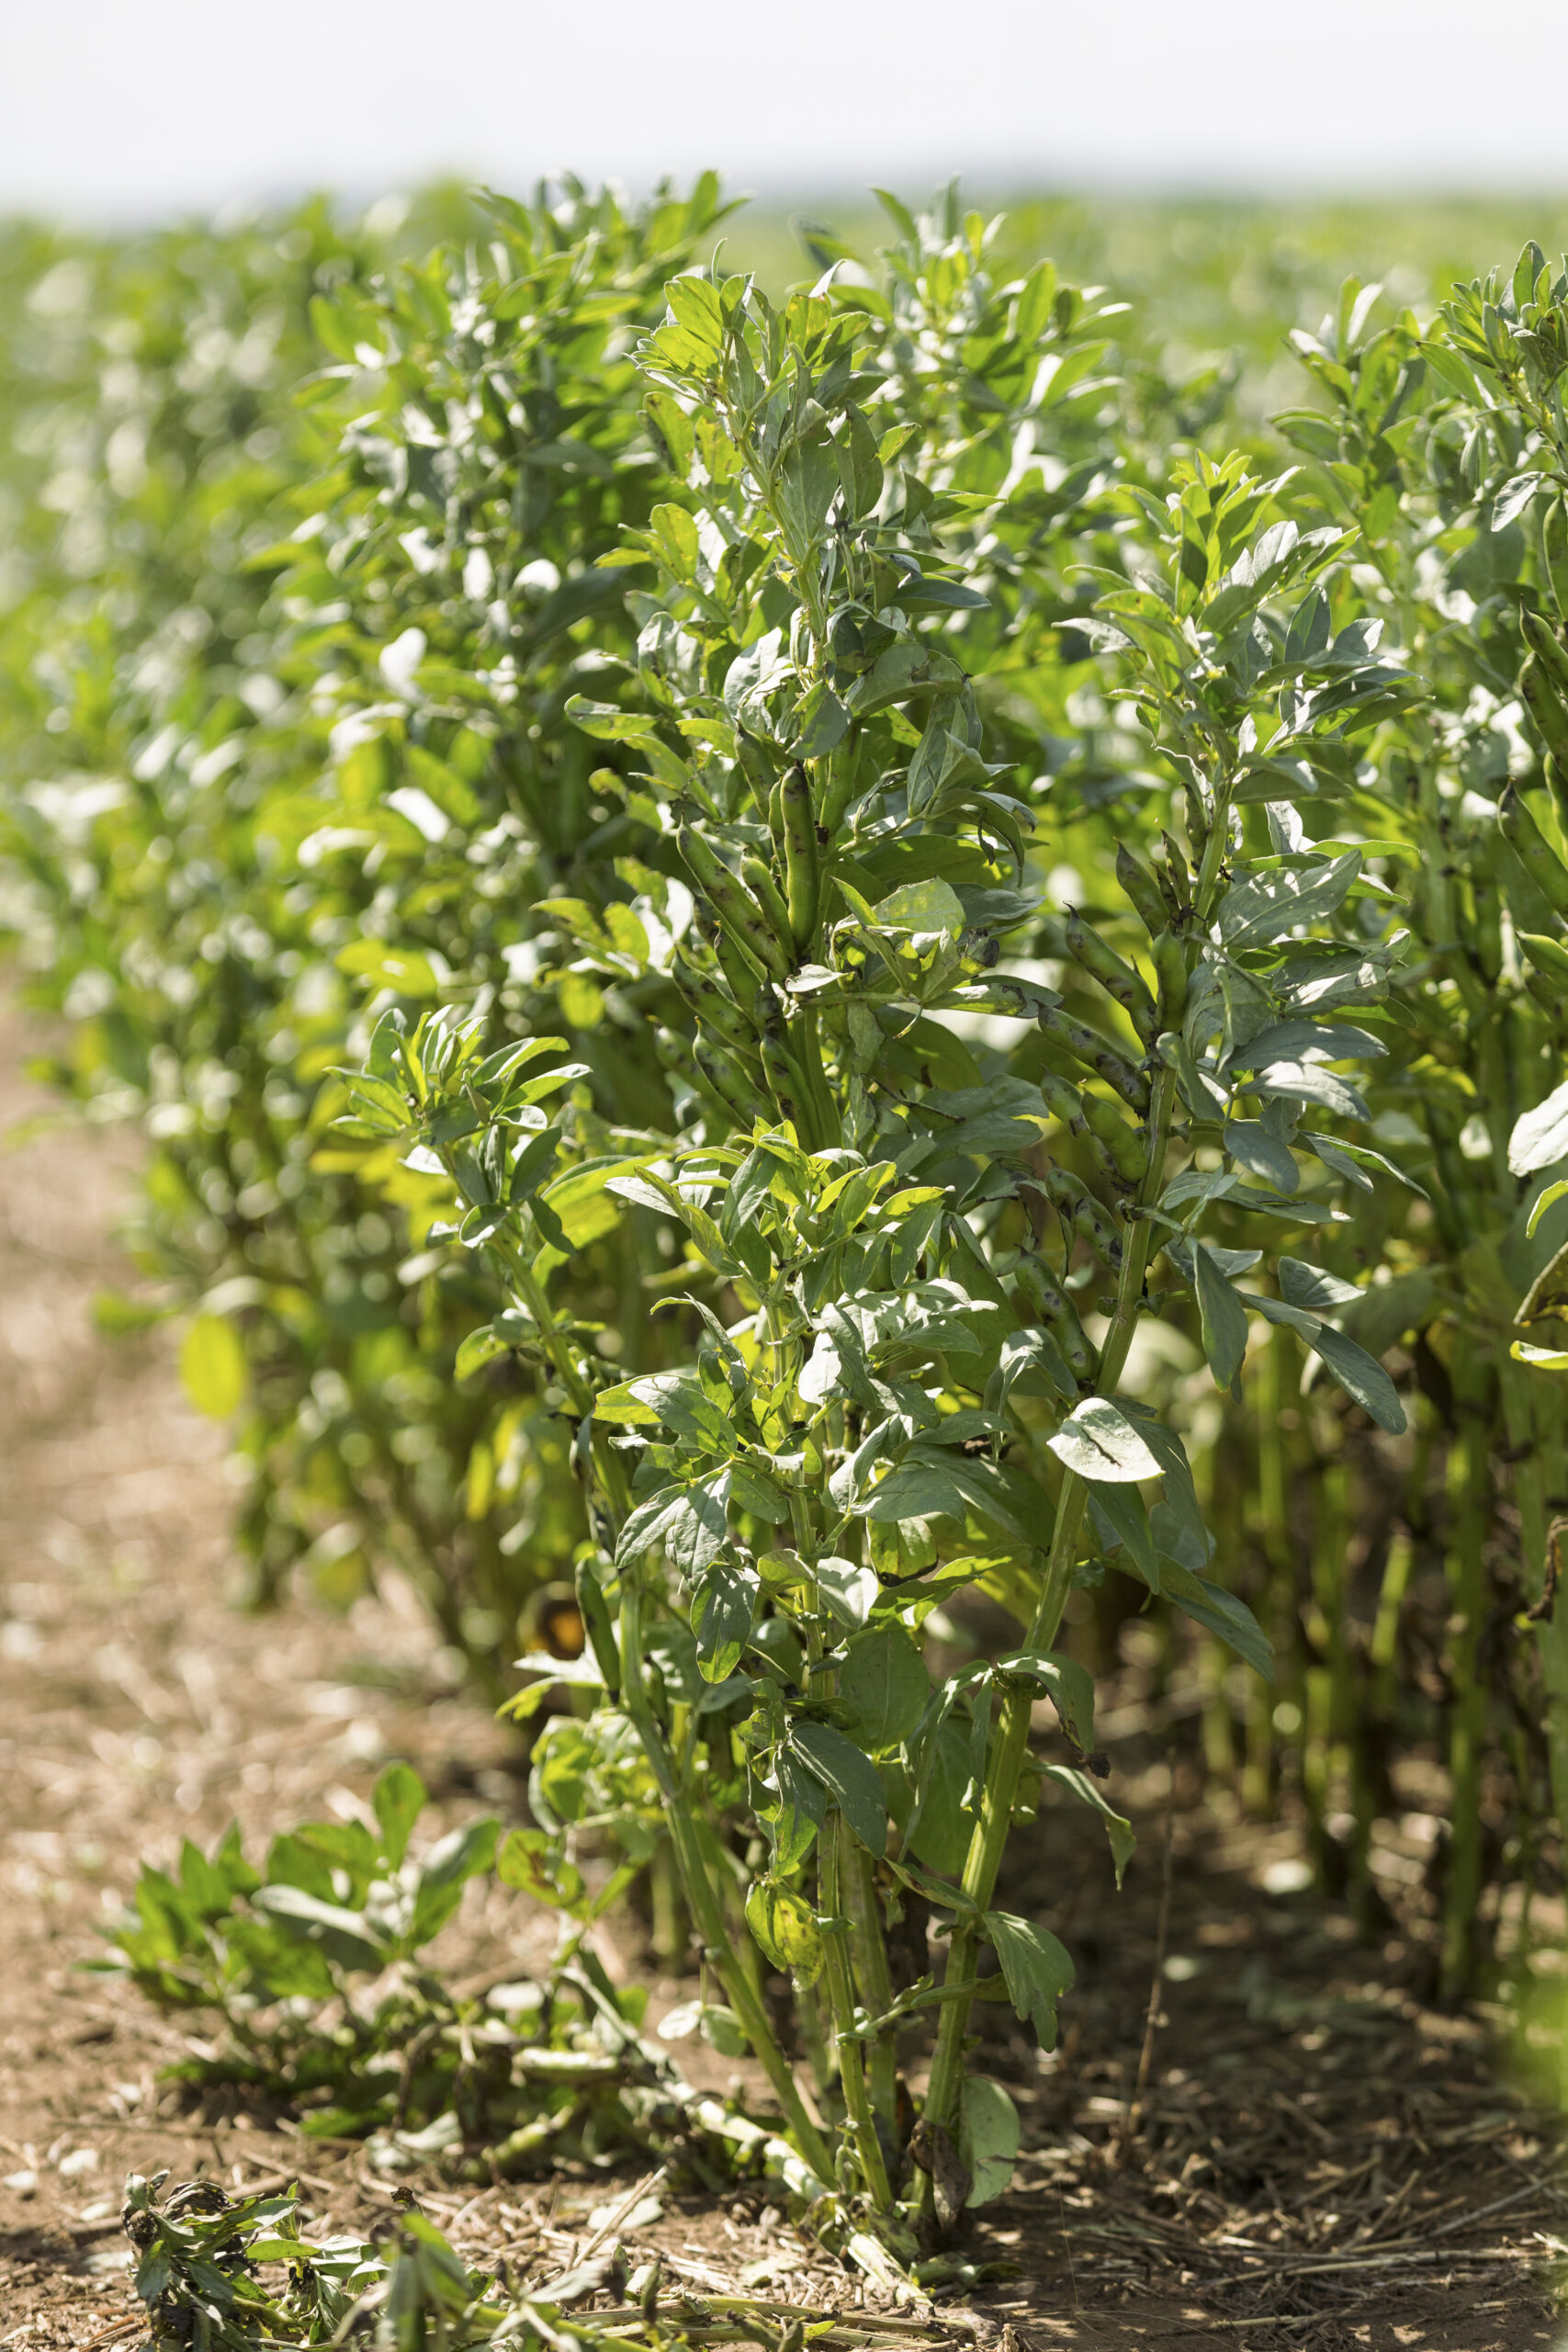
Peas
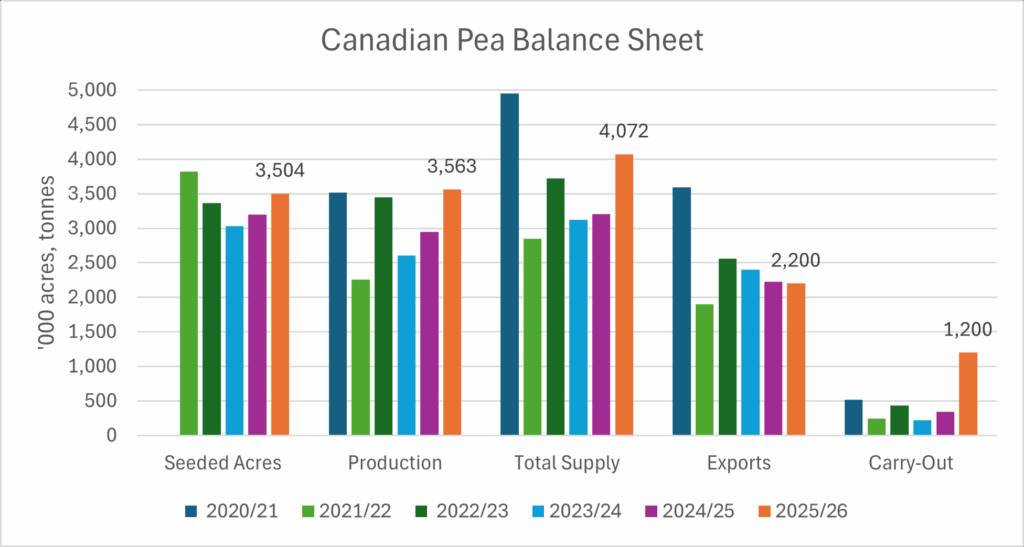
I think we can all agree that average yields were a positive surprise and came in better than expected. This should help with profitability within the setting of generally lower commodity prices. The September Statistics Canada (StatCan) estimate showed average Canadian pea yields at 38.3 bushels per acre (bu/ac), and production at 3.56 million tonnes for 2025. This was close to the Mercantile estimate at 3.6 million tonnes but might still be shy of the real outcome. However, the trade seems to have settled on using around 3.6 million tonnes of production for this year. This comprises roughly:
- 2.8 million tonnes yellow peas (compared to 3 million tonnes last year),
- ~550,000 tonnes greens (350,000 tonnes last year),
- plus about 200,000 tonnes other peas (mostly maples).
Pea supply in Canada (production plus carry-in) has risen to about 4 million tonnes (compared to 3.2 million tonnes last year).
The quality also seems surprisingly good given the earlier provincial crop condition assessments. The Saskatchewan Ministry of Agriculture (SK Ag) contended that peas grade mainly 2 Canada at 53%, with 42% at 1 Canada (this is similar to the ten-year average of 51% 2 Canada and 42% 1 Canada). This would leave just 5% for lower grades.
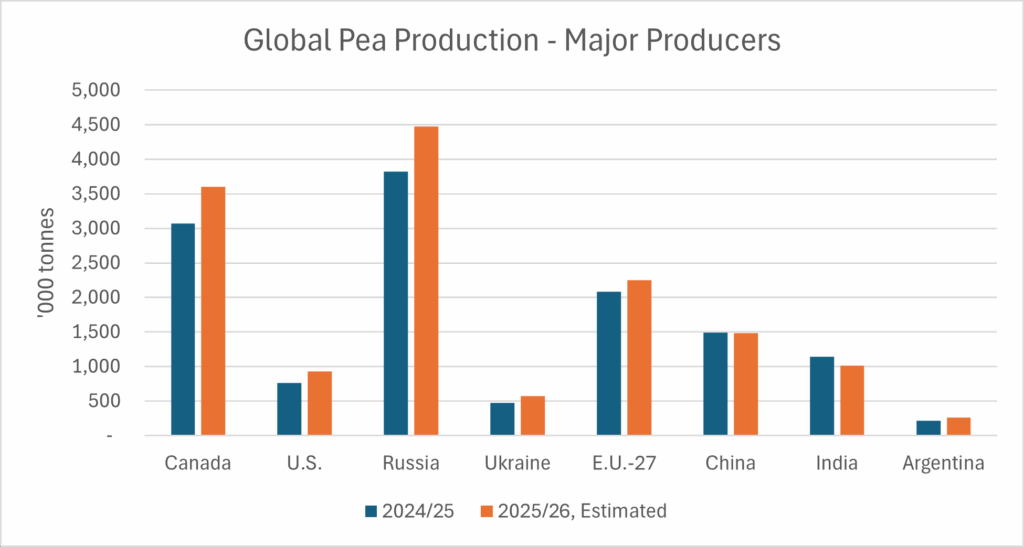
Now that we have established our supply status for the year, what about competing pea production and the demand outlook? Our main competition in pea exports markets comes from Russia, Ukraine, the United States (U.S.), and to a small degree from Argentina. Russia has developed into the main competitor into China and remains a threat into India, Bangladesh, and Pakistan.
Russia is estimated to have produced about 4.7 million tonnes of peas, with an additional 550,000 tonnes coming from Ukraine. The U.S. crop should have roughly 800,000 tonnes, with about 225,000 tonnes of greens. Given the strong production results in Canada, Russia, the U.S. and the European Union this crop year, we estimate that pea production by the world’s major producers increased by 12% over last year’s to an estimated 14.58 million tonnes.
In other words supply seems assured, and like for many crops this year the final production numbers definitely exceeded earlier expectations that are generally based on average or just below average yield assumptions.
What does the demand side look like? Coming into the harvest period, Canadian exporters had estimated forward sales on the books for fall shipments at about 700,000 tonnes, mainly for India and Bangladesh. According to data from the Canadian Grain Commission (CGC), about 458,000 tonnes have already been loaded year-to-date (week 7). Nevertheless, exports have already fallen behind the export pace seen last fall by 125,000 tonnes (-21%). Last year, Canada’s main pea buyers were India, China, Bangladesh, and the U.S., which collectively bought 85% (1.9 million tonnes) of Canadian peas. Here is a closer look at the export outlook to the main destinations:
China has bought as much as 2.6 million tonnes of peas a year from Canada (2020/21), but China’s import volume from Canada was down to 733,000 tonnes last crop year because of competition by Russian and the U.S., and because of China’s retaliation against the 100% Canadian tariff on Chinese electric vehicles. China’s 100% tariff on Canadian peas started in March this year. Canada will need some action on Canada-China trade relations to keep the bulk pea export flow going. The following table shows the recent buying history by China from the major origins by calendar year. The table also highlights the fact that even if China re-opens to Canadian pea imports, Canada will have to be competitive with Russian and Ukrainian peas (which are now also eligible to be shipped into China), and (potentially) U.S. peas.
CHINA – Pea Imports by Origin (tonnes)
| 2023 | 2024 | 2024 (January-July) | 2025 (January-July) | |
|---|---|---|---|---|
| Russia | 908,268 | 646,458 | 369,054 | 408,547 |
| Canada | 1,579,158 | 529,596 | 244,997 | 402,327 |
| USA | 74,820 | 51,274 | 24,296 | 27,956 |
| Other | 93,734 | 163,179 | 83,599 | 104,622 |
| All Imports | 2,655,980 | 1,390,507 | 721,946 | 943,452 |
The second big bulk buyer is India, and here demand for yellow peas will hinge on the level of success (or failure) of the Indian domestic production of desi chickpeas and on pigeon peas. Pigeon peas are grown in the kharif season (seeded May, harvested September-October), and wet weather seems to have compromised their yield potential. We should be able to get better data on the production outcome over the coming weeks. Chickpeas and lentils are grown in the rabi season (seeded October-December, harvested April-June), and the rains that hampered kharif crops may actually benefit rabi crops. We will have to follow how many acres are being seeded for each crop, and how well these crops develop. In other words, there is no ready answer at this stage to the outlook of demand from India.
However, last year, yellow peas accounted for almost 45% of India’s total pulse imports and effectively served as a substitute for both pigeon peas and chana. Accordingly, import demand for peas over the coming months will revolve around the availability of pigeon peas and chickpeas (chana) in India. Should domestic production of these crops be ample, import requirements will ease. If they are not ample, then the gap will likely be filled through imports of yellow peas and lentils.
Imports of Canadian peas by Bangladesh and the U.S. vary widely from year to year. Over the past ten crop years, Bangladesh has bought from 127,000 tonnes to 606,000 tonnes annually, while the U.S. has bought from 91,000 tonnes to 377,000 tonnes annually. For this coming year, we expect them import 250,000 and 100,000 tonnes, respectively.
Agriculture and Agri-Food Canada (AAFC) projects Canadian pea exports to reach 2.2 million tonnes this crop year, which would be similar to last year’s. Assuming around 700,000 tonnes for domestic use, this would leave Canada with about 1.2 million tonnes of ending stocks, a very big 42% stock-use ratio. We think it will be a challenge to reach the 2.2 million tonnes export number, and this will require a rapprochement between Canada and China rather sooner than later.
Lentils
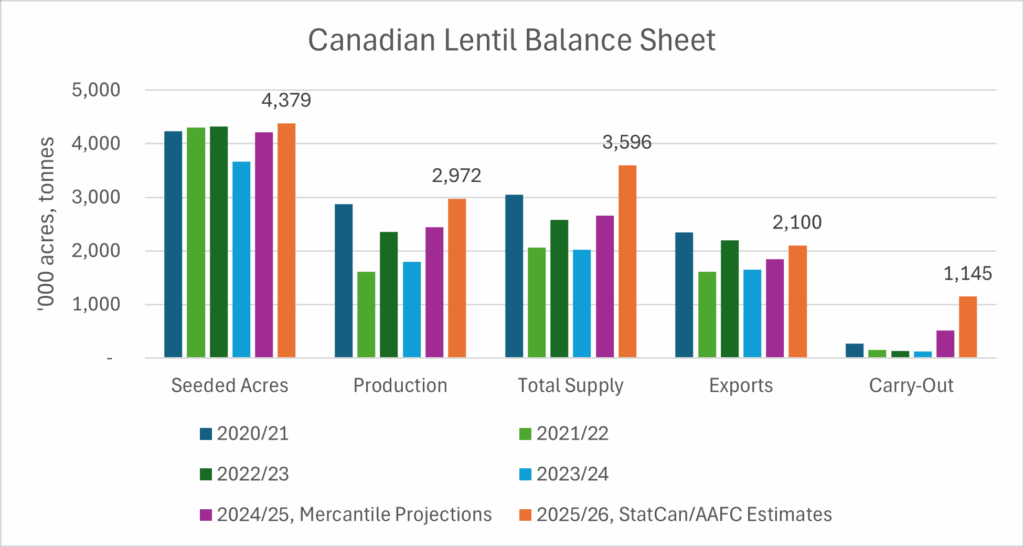
Lentils are all harvested, and yields ended up being exceptionally good. Canadian lentil production seems to be close to 3 million tonnes (compared to 2.4 million tonnes last year), and supply could reach 3.6 million tonnes (2.7 million tonnes last year).
Per our latest calculations, we peg this year’s red lentil production at 1.54 million tonnes, large/medium greens at 972,000 million tonnes, and small greens at 455,000 tonnes.
This year, green lentils are much better supplied than over the past three years, which is why we have seen the price spread between greens and reds narrow. Meanwhile, we think the 2025 red lentil production in Canada is about 180,000 tonnes smaller than last year’s red lentil crop because of the significant shift in acres towards green lentils.
Lentil quality also looks surprisingly good. Per SK Ag, lentils grade mainly 2 Canada at 60%, with 26% at 1 Canada (this is similar to the ten-year average of 51% 2 Canada and 31% 1 Canada). If correct, this would leave just 14% for lower grades.
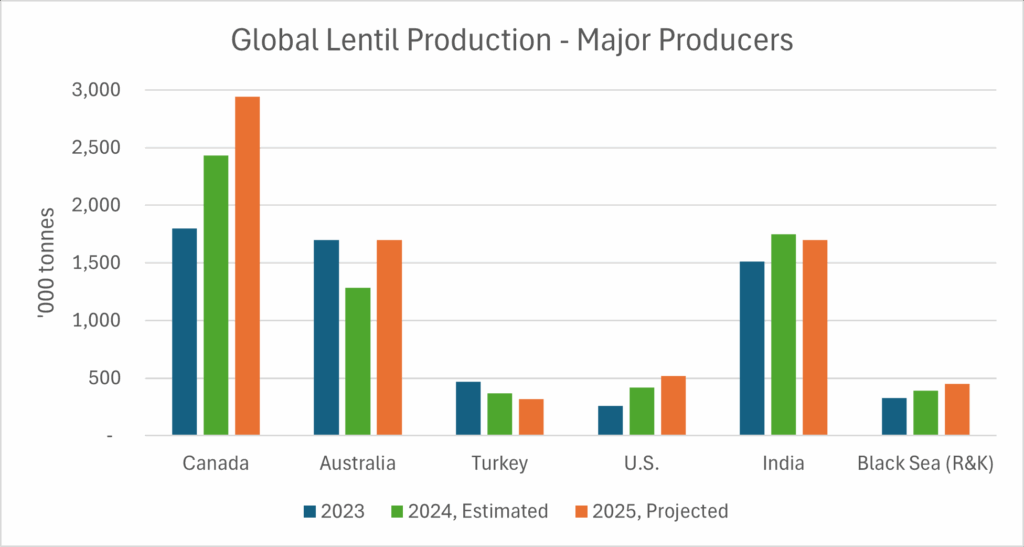
Regarding lentil production by the major producers, it seems that this year’s production exceeded last year’s in Canada, Australia, Russia, and in Kazakhstan. The final verdict for Australian lentils (mostly reds) is still out there but should reach 1.7 million tonnes (1.3 million tonnes last year). Regarding green lentils, U.S. lentil production reached 520,000 tonnes (425,000 tonnes last year). We estimate that global production is up by close to 15% to 7.6 million tonnes from 6.7 million tonnes last year. Again, the supply of lentils is all but assured, and now the depth of demand will determine price developments.
Canadian export shipments so far have been good, with another 127,000 tonnes of bulk lentils loaded in Vancouver during weeks 6 and 7. In fact, bulk lentil shipments are currently 112,000 tonnes ahead of last year’s.
Canadian export demand for lentils is quite diversified, but the biggest buyers are India, Turkey and the United Arab Emirates (U.A.E.). Last crop year, the top three buyers bought just over 1 million tonnes of Canadian lentils, or 57% of total exports. Regarding India, see our comments on Indian domestic production in the pea section. Final import demand will depend on India’s domestic production outcome and on import policies. But as the table below reminds us, there will be competition in the Indian market by Australia, the U.S., and potentially Russia.
INDIA – Lentil Imports by Origin (tonnes)
| 2023 | 2024 | 2024 (January-July) | 2025 (January-July) | |
|---|---|---|---|---|
| Canada | 855,182 | 464,777 | 195,650 | 334,119 |
| Australia | 776,092 | 502,957 | 363,480 | 257,400 |
| USA | 480 | 54,965 | 20,038 | 35,969 |
| Other | 49,443 | 37,435 | 30,493 | 36,095 |
| All Imports | 1,681,197 | 1,060,134 | 609,661 | 663,583 |
Regarding Turkey, Canada will see increased competition by Russia and by Kazakhstan. We expect India to buy about 650,000 tonnes of Canadian lentils this year, Turkey 325,000 tonnes, and the U.A.E. should buy about 220,000 tonnes of Canadian lentils.
We expect total lentil export demand to reach 2.1 million tonnes this crop year, which is the same number that AAFC is currently using, and which is bigger than the 1.84 million tonnes shipped in 2024/25. Even so, given about 350,000 tonnes of domestic usage, Canadian lentil ending stocks this crop year could potentially surpass the 1 million tonnes mark, roughly a big 45% stock-use ratio (see the Canadian Lentil Balance Sheet).
If you do not want to carry lentil or pea stocks into next year, make sure to watch for opportunities that yield profitable sales based on the improved yield profile.
Marlene Boersch is a managing partner in Mercantile Consulting Venture Inc. More information can be found at www.mercantileventure.com.