The Benefits of Doing a Harvest Yield Estimate
Conducting a harvest yield estimate offers several benefits to producers across various domains of food production. It enables a timely understanding of the changing trends in crop harvest and production, provides a reference for product control, and helps support annual security by informing policies for food pricing, storage, and seeding. The advantages of performing a harvest yield estimation can be summarized into three key areas:
- Financial Management: Estimating harvest yield provides valuable financial planning and budgeting information. It produces a baseline value in which producers can project their potential revenue and make informed decisions on cash flow and expenses. This allows profitability to be assessed and financing to be secured. Having an idea of potential yield also means producers can predict the impact of weather conditions, pests, diseases, and other factors on their production.
- Production Planning and Resource Optimization: A harvest yield estimate allows producers to make informed decisions regarding planting, crop rotation, and resource allocation. A yield estimate will allow an estimation of fertilizer, pounds of seed, and other requirements for optimal production, resource management, and cost control. Yield estimates will also allow producers to optimize their use of labour resources, machinery, and storage facilities.
- Benchmarking and Performance Optimization: Yield estimates provide producers with a benchmark to evaluate their performance and compare it with industry standards or historical data. They allow producers to identify areas for improvement and implement better agronomic practices. More experience producing and comparing quantified yearly values with estimated yields will encourage more long-term stability in the agricultural industry.
Therefore, conducting a harvest yield estimate goes beyond providing a general understanding of crop production trends, and conducting harvest yield estimations gives producers a significant advantage in their agricultural activity.
Conducting a Harvest Yield Estimate
There are multiple ways to conduct a harvest yield estimate, ranging in simplicity, speed, and accuracy. Two common methods are described below, as well as relevant resources and examples.
The Square-Metre Method
A relatively quick and easy method is known as the seeds per square metre (m²) method (Equation 1).
Equation 1
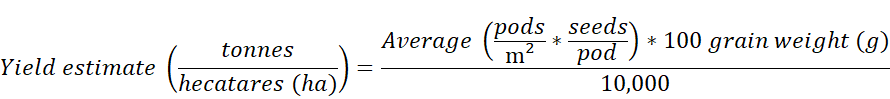
This method requires the selection of an area that is representative of the overall state of the field. The selected area must be free from any anomalies or areas of high variability in condition as this could affect the overall measurement. A m² area is then measured using a tape measure or other suitable tool to mark the boundaries and count the number of pods within. Repeating this several times will allow an average number of pods per m² of the overall crop to be determined. Next, count the number of seeds in at least 20 heads or pods to find the average number of seeds per pod. Multiplying these values will give the estimated number of seeds per m². The final step requires an understanding of the average weight of the crop concerned to determine the potential yield. The weight of 100 grains of the crop is commonly used (Table 1), or if the thousand kernel weight is known, it can be converted to 100-grain weight (Equation 2).
Equation 2

These values can be multiplied by the estimated number of seeds per square metre to obtain an estimated yield in tonnes per hectare (t/ha), which can then be converted to tonnes per acre (t/ac) by a multiplying factor of 0.4047, or pounds per acre (lb/ac) by a factor of 892.1791.
Table 1. Grain Weights for Registered Saskatchewan Varieties
| Crop Type | Average weight of 100 grains (grams) |
|---|---|
| Lentils | 3 – 5 |
| Lupin (narrow) | 16 |
| Lupin (broadleaf) | 30 |
| Chickpea (Desi) | 27 |
| Chickpea (Kabuli) | 40 |
| Field pea | 23 |
| Faba bean | 50 |
Source: Agriculture Victoria
This method is considered one of the simplest methods for crop yield estimation, however, factors such as soil fertility, weather conditions, and crop management practices can significantly impact the actual yield. Therefore, an allowance for a 5–10% loss is recommended in the final calculations.
Using the 1/1000 Acre Row Method
While simple, the use of the square meter method can become complicated when estimating the yield of small grain crops such as wheat, barley, and oats. In these cases, the Thousand Kernel Weight (TKW) or seeds/pound method may be more appropriate. This method requires the determination of the feet of a row needed to make 1/1000 of an acre (Equation 3).
Equation 3
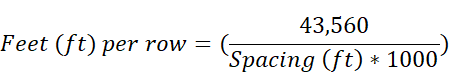
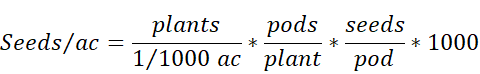
Where 43,560 is the number of square feet in an acre, and spacing is the distance between rows in feet. For example, with a 9-inch row spacing, the length required for 1/1000th of an acre would be 58’1”, while for a 12-inch row spacing, the length required would be 43’7”. Once determined, count the number of plants in that length of the row and find the average number of pods per plant from 10 plants within that row. Collect two pods from each of the 10 plants to get an average number of seeds per pod or use a known crop estimate, soybeans, for example, are often 2.3 seeds/pod. Multiply your plant counts in the 1/1000 ac row by the pods/plant and seeds/pod average to determine your seeds per 1/1000 ac. Multiply by 1000 to get seeds per acre (Equation 4). Do this in a few areas of the field to get an average. Pounds per acre are determined by dividing the seeds per acre value by the seeds per pound. The seeds per pound value can either be a known average value for a specific crop (Table 2) or converted to seeds/pound using known TKW values (Equation 5).
Equation 4
Equation 5
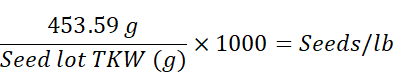
Table 2. Estimate Averages for Seed Lot TKW
| Crop | TKW Average (grams) | Average seeds/lb |
|---|---|---|
| Small red lentils | 40 | 11,340 |
| Large green lentils | 73 | 6,214 |
| Yellow pea | 240 | 1,890 |
| Green pea | 220 | 2,062 |
| Kabuli chickpea | 375 | 1,210 |
| Desi chickpea | 265 | 1,712 |
| Black bean | 185 | 2,452 |
| Pinto bean | 360 | 1,260 |
| Faba bean | 500 | 907 |
Finally, the estimated pounds per acre can be converted to estimated yield by dividing by a known bushel weight for the crop being estimated. For peas, lentils, and soybeans, this value is often 60 pounds per bushel. The final value estimate will then be bushels per acre. Keep in mind that as seeds mature, they lose moisture, and this could affect the calculations. The closer to harvest the estimation is completed, the more accurate it will be.
The Economics of Harvest Loss
Calculating harvest loss is a crucial step for farmers to make informed decisions and minimize potential future harvest losses. The bushels per acre equation is a valuable tool that allows harvest loss to be estimated. It involves measuring the amount of crop left in the field after harvest and converting it into bushels per acre. The equation used considers the area of the field and the weight of the crop to determine potential financial loss.
To use this method, the total amount of acres of the field is required. If not already known, this value can be determined by physically measuring the length and width of the field, or by using field maps. Determination of the amount of crop left un-harvested is like yield estimation. In brief, randomly selected areas representative of the overall field are chosen, and the unharvested crop is collected. The samples are then weighed, averaged, and converted to a one-acre measurement and then multiplied by the size of the field in acres. Once an accurate weight of the un-harvested crop is known in pounds per acre, it can be divided by the known weight of a bushel. The bushel weight can be directly determined by measuring an average bushel collected during the harvest, or by using a known value. The estimated financial loss can then be determined by multiplying the bushels per acre of crop loss by the crop price per bushel and by the size of the field in acres (Equation 6). The current crop price can be obtained from market prices or contract agreements.
Equation 6

Generally, acceptable loss rates are around 1 bushel per acre, although this can vary depending on the crop. Heavier feed crops like barley are prone to be left behind during combining compared to canola, flax, or other small grains. In Western Canada, the total number of bushels lost per year carries a cost of $500 million CAD for primary producers, and therefore, it is essential to observe an economic threshold when considering the application of field resources to minimize such losses.
Types of Harvest Losses and Ways to Mitigate Them
There are many types of harvest losses which can be caused by numerous factors; however, they can be characterized into three main groups: (1) pre-harvest losses, (2) harvesting and handling losses, and (3) post-harvest losses.
Pre-Harvest Losses
These are losses that occur before harvest, from seeding to just before when the actual harvesting process begins. Pre-harvest losses can occur from weather events, pests, diseases, and loss to wildlife over the crop growth period, and can also be due to poor crop management and season planning. The days leading to the maturity of the crop are some of the most important in ensuring high-quality grains.
For pulse crops specifically, examples of pre-harvest losses can include:
- Lodging, shattering, stubble loss, over-ripe shelling, and loose stock loss. Strong winds and heavy rain can cause pulse crops like lentils and chickpeas to bend and break, whereas others such as peas and soybeans can have mature pods split open, releasing the seeds before harvest. Also known as over-ripe shelling, this can also occur when a crop is left too long and is harvested beyond its optimal maturity stage, as the grains and seeds may begin to separate from the plant naturally and shatter or drop on their own. Stubble loss and loose stock loss refer to the pods, seeds, or grains that remain on the stock after combining, that were cut but not gathered, or that remain on plants that were not cut at all.
- Bleaching and sprouting. These losses occur most often in crops that are harvested in swaths or windrows such as cereals and oilseeds. They are primarily associated with adverse weather conditions including prolonged periods of rain or high humidity during the ripening or drying phase of the crop but may also occur on a standing crop. Bleaching, which refers to the lightening of a crop’s seed colour, typically occurs when crops are exposed to excessive moisture or high humidity for extended periods that cause the protective outer layers of the seed to soften, allowing enzymes to break down the pigments responsible for natural coloration. Sprouting, also known as germination, refers to new growth or roots from the seeds while still attached to the plant. High moisture exposure triggers the seeds to enter the germination phase and can lead to reduced grain quality, crop yield, and increased susceptibility to diseases and pests.
- Aphids, nematodes, and other pests and diseases can cause significant damage to pulse crops and reduce yield. The susceptibility to such pests and the estimated impact will depend on the location of the field, the environmental conditions during the growing season, and the pulse crop being grown. In Saskatchewan, plant diseases like Ascochyta blight, bacterial blight, and root rot are common in peas, lentils, and chickpeas. Pests like aphids, grasshoppers, and weevils are also common, particularly for field peas, chickpeas, faba beans, and lentils. Wildlife feeding on the growing crop is also a concern and can lead to noticeable reductions in yield. The Wildlife Damage Compensation Program administered through Saskatchewan Crop Insurance Corporation (SCIC) compensates producers for crop damage due to wildlife predation and preventative measures. Based on the information given by SCIC, the 2021 Saskatchewan crop year saw an early harvest completion resulting in very little overwintered crop and minimal waterfowl and big game damage claims, and prevention expenditures were quantified at $372, 185. As of March 31, 2022, they received 178 waterfowl claims, 2,382 big game claims, and 2,196 predation claims, resulting in $23.3 million in compensation paid.
- Poor crop management that leads to non-optimal seeding densities, improper weed control, inadequate nutrient management, and lack of pest control will ultimately increase yield loss.
Therefore, due to the range of factors that can lead to yield losses, mitigating pre-harvest loss can be one of the most important steps producers take to increase harvest yield. There are many strategies and mitigating efforts that can be taken to reduce the impact of harvest losses above, some of which are described below.
- Calculate the seeding rate to achieve optimal target crop densities. Optimal plant densities for crops depend on the crop type, the intended use for the crop, the region, and the growing conditions. Cereals intended for silage, greenfeed or grazing often use higher target densities than grain crops. Similarly, cereals grown as cover crops with forages are seeded at lower plant densities than what is used normally for grain production, and targeted densities are generally lower in areas of limited rainfall (Table 3).
Table 3: Optimal Plant Densities for Different Pulse Crops
| Crop | Plant Population Target (Range) plants ft-2 | Typical TKW Range (grams) |
|---|---|---|
| Chickpea | 4 (3-4) | 220-425 |
| Field pea | 8 (7-9) | 125-300 |
| Lentil | 12 (10-17) | 25-80 |
Once a target density is chosen, the seedling survival rate and TKWs need to be determined. Seedling survival can be calculated as the germination percentage minus a small amount (usually 5–20%) to account for seedling mortality from previous known records on germination, or it can be broadly estimated from common values. A generally acceptable range for cereal and pulse seedling survival is 80–90%, but this value can be decreased due to factors such as seeding date, soil temperature, moisture, and texture, seeding speed, fertilizer type and placement, pests, and weather events. Once these values are known, the optimal seeding rate (lbs/ac) can be calculated (Equation 7).
Equation 7

- Use of weed and pest control and pre-harvest aids: The use of chemical control measures such as pesticides and herbicides can help manage the presence of harmful organisms that can impact crop yield. Not only can the presence of weeds impact the growth of pulse crops, but they can also impact the grade of the collected seeds. Green weed material in a straight-cut operation can cause extra wetness in the threshing areas of the combine, resulting in moisture on the seed coat that can impact its storage and cause it to collect an earth tag. Green seeds can also continue to respire, resulting in heating of the grain in storage leading to hotspots that can become spoilage zones. Likewise, pest control will reduce the populations of damaging pests that harm plants during their growing period. However, there is also a cost to using chemical treatments to remove unwanted pests and weeds; often they will also remove beneficial symbionts from the field area. As well, many applications require adherence to specific parameters such as seed moisture, plant life stage, and pre-harvest intervals.
- Field monitoring: Pre-harvest field monitoring will help determine which harvest system to consider and is important in determining when to begin harvest operations. Harvesting too early will result in immature seeds while harvesting too late may increase shatter and lodging losses and will increase the risk of poorer quality seed. Factors to consider when deciding on when to harvest include:
- Crop maturity: The ideal crop maturity for harvest is dependent on the specific crop and its ideal use. Lentils are typically harvested when the crop begins to turn yellow and the pods are drying down, indicating physiological maturity. Chickpeas should be brown, the seeds dried and separated from the plant, and dry beans are harvested when the pods have fully dried and are crisp.
- Seed moisture content: Seed moisture is also dependent on the specific crop and intended use of the crop, but generally, a moisture content of around 15% is acceptable. For example, in lentil varieties, the optimal seed moisture percentages at which minimum damage was observed was 17.5% for green lentil and 15% for red lentil. For chickpeas, a moisture content of 12–15% is preferred, while for dry beans, a moisture content between 18 and 22% is acceptable. In some cases, higher moisture content is required. However, safe harvest moisture content can be dictated by what storage and drying conditions are available, as will be discussed.
- Presence of weed growth: As discussed above, the presence of weeds can reduce the grading of collected seeds and grains.
However, not all factors that affect harvest yield can be accounted for or mitigated. Therefore, producers should always include a 10–15% yield reduction in their expectations that creates a buffer between the yield they need, and the yield they can expect to achieve.
Harvest Losses
These are the losses that occur during the actual harvesting process and subsequent handling activities. The most common cause associated with harvest loss is the mechanical damage incurred by the crop due to equipment inefficiencies, improper techniques, or improper equipment. According to Seeds Lab Inc., in 2021 over half of pulse crops tested for germination showed evidence of mechanical damage, and research focusing on mechanical damage of seeds has stated that most of the damage occurs during the harvest and transportation processes. Different types of mechanical losses are discussed below.
- Header losses. These are losses that occur at the cutting mechanism or header of the harvesting equipment. These losses are caused by improper header height adjustment that leads to poor cutting and the subsequent gathering of the crop, misaligned or damaged skid plates that push the crop down rather than gather it to be cut, or other equipment malfunctions in the header components such as the sickle bars, guards, or reel fingers. Operating speed also has significant impacts on header losses and often amplifies the above issues.
- Gathering losses. While these losses also occur at the header mechanism, they are differentiated as the losses that occur when the crop material is not effectively gathered and fed into the harvesting equipment after being cut and can occur due to poor gathering reel adjustment, crop lodging, uneven or non-uniform crop stand, or excessive ground speed of the harvester.
- Threshing and separation losses. These losses are often associated with the rotor system in the harvesting equipment, and factors that contribute to these losses include inadequate rotor speed; too high and more grain may be lost due to cracking and splitting, but too low and unthreshed or partially threshed grain may remain in the straw. Improper concave settings mean the concave clearance is too wide or too narrow and failure to optimize clearance may lead to increased grain cracking, dirty samples, or blockage of the components.
- Cleaning and winnowing losses. These occur when the grain seed is separated from the chaff, straw, or other debris. Ineffective adjustment of the cleaning components such as sieves or fans can result in loss of grain or seed along with unwanted materials.
Overall, minimizing mechanical harvest losses requires proper adjustment, maintenance, and operation of the harvesting equipment. Additional machines can also be used to decrease yield losses. The use of a flex header or a swather with float has been shown to reduce yield losses by 50% in solid-seeded soybeans and lentils compared to a conventional swather. Other mitigating efforts to reduce yield loss depend on the specific crop being harvested (Table 4). For example, lentils are easily threshed, so concave clearances on harvesters should be opened, and speed reduced, while speeds for chickpeas and field peas can be increased.
Table 4: Harvester Settings for Pulses
| Chickpea | Faba bean | Green lentil | Red lentil | Lupin | Field pea | Vetch | |
|---|---|---|---|---|---|---|---|
| Reel speed | Medium | Slow | Slow | Slow | Slow | Medium | Slow |
| Spiral clearance | High | High | Low | Low | High | Standard | Low |
| Thresher speed | 400–600 | 400–600 | 350–450 | 350–450 | 400–600 | 400–600 | 400–600 |
| Concave clearance (mm) | 10–30 | 15–35 | 20–30 | 10–20 | 10–30 | 10–30 | 10–30 |
| Fan speed | High | High | High | High | High | High | Medium |
| Bottom sieve (mm) | 32 | 32–38 | 32 | 16 | 32 | 25 | 5 |
| Rotor speed (RPM) | 700–900 | 700–900 | 350–450 | 350–450 | 700–900 | 700–900 | Slow |
Source: Grain Legume Handbook Committee
Adapted from J. Lamb (2008), Grain Legume Handbook for the Pulse Industry.
Post-Harvest Losses
These are losses that refer to the reduction in the quality and quantity of agricultural products after they have been harvested. Post-harvest losses can have significant economic and food-security implications and can be devastating to the financial stability of the producer if the reduced income associated with the post-harvest loss is unable to support the previous harvest activities. Post-harvest losses can occur at any stage: storage, transportation, processing, and marketing.
Inadequate storage facilities can lead to spoilage, pest infestation, and physical damage to the harvested crops. If the crop is not stored in a safe condition, the losses can be significant. Mitigating storage losses begin immediately. Microorganisms responsible for spoilage thrive in hot and moist conditions, so both temperature and moisture content must be controlled. Generally, the lower the seed temperature and moisture of the seeds when they enter the bin, the more reduced the risk of spoilage. However, different crops have different favourable starting conditions (Figure A). For example, barley spoilage occurs when initial temperatures range from 5˚C to 20˚C and the respective moisture content is 20% and 10%, whereas canola spoilage occurs from 10˚C to 50˚C with a respective moisture content of 12% and 7%. If temperature and moisture parameters are within the ‘no spoilage’ zone, grains and seeds can be considered at reduced spoilage risk for up to five months, but this is highly dependent on maintaining adequate conditions within the bin for that period. There are multiple strategies for maintaining temperature and moisture in-bin (Table 5). The key difference between these management strategies is the airflow rate, described as cubic feet per minute per bushel (cfm/bu).
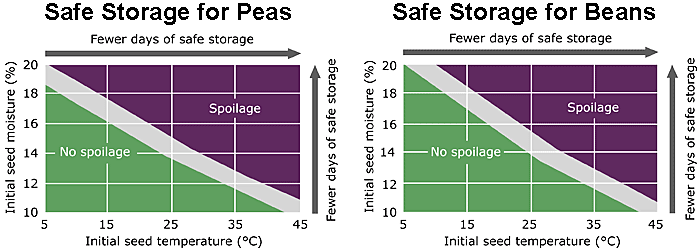
Source: Dr. Noell White, AAFC as originally posted by Grains Canada
Table 5: Strategies for Maintaining Temperature and Moisture Conditions In-bin
| Description | Pros | Cons | |
|---|---|---|---|
| Aeration |
|
|
|
| Natural air drying (NAD) |
|
|
|
| NAD with supplemental heat |
|
|
|
| Heated air drying |
|
|
|
Source: Comprehensive Natural-Air-Grain-Drying Factsheet
Grain quality beyond temperature and moisture can also have a significant impact on storage success. Higher-grade grains and seeds will be more resistant to spoilage and pest infestation. While many of the efforts to increase grade must be made before storage, and are dependent on factors like harvest timing, harvester choice, and pre-harvest mitigation efforts, grading factors to look for before storage include:
- Cracked seed coats and splits
- Shrivelled seeds
- Bleaching
- Earth tag
- Diseased seeds and grains
These grading factors will be important for the other post-harvest stages of transportation, processing, and market. Poor handling and transportation and inadequate processing techniques can lead to more mechanical damage to the grains, contamination with bacteria and fungi if the materials are not properly cleaned and decreases in nutritional value if the product is not properly sorted. How the product is graded will impact its value on the market, and how it is cleaned and packaged will make it more or less likely to be damaged by pests. If done properly, post-harvest management of the crop will increase its market value and make it more resilient to economic factors that may increase or decrease market accessibility.
Managing Myths
The importance of an accurate harvest yield estimate cannot be understated and is a key annual consideration for producers. Given its importance and the significant negative impacts a poor estimate can result in, many myths exist for dictating ways to increase yield. While some of these myths have gained popularity, at best, employing these suggested practices has no impact on harvest yield, but at worst, they can actively reduce yield despite the producers’ best intentions. This section will address some of the most common myths surrounding harvest yield estimation.
There is a common belief that machines running lower amounts of material do not harvest as effectively. Machine harvesting efficiency is not solely determined by the amount of material harvested, and most modern machines are equipped with advanced and adjustable settings that allow them to operate optimally, regardless of the amount of material being harvested. Unless the machine is calibrated to run higher amounts of material, doing so could reduce yield or the quality of the collected grains. Further, harvest efficiency is not only dictated by the amount of product collected but also by the amount of time it takes to collect. Machines running lower amounts of material may finish the harvest process more quickly than those running higher amounts, making them more efficient. In the end, you want to match combined ground speed to crop throughput to achieve a smooth, even flow of crop through the machine.
As well, it is sometimes believed that increasing seeding rates will always increase yield and may act as a buffer against seeding loss due to uncontrollable variables. This is a myth that could actively work to decrease producers’ yields and result in a harvest yield that is significantly lower than the estimated value. Each type of crop has an optimal density for maximum yields, and often, plants can compensate for lower densities by increasing branches or tillers, heads or flowers, or kernel sizes. When the density is too high, however, plants may suffer due to competition for nutrients, space, sunlight, and water, and may also be more susceptible to disease and pest infestation. The crop yield and plant density relationship typically follow a pattern (Figure B), characterized by a rapidly increasing yield with increasing plant density, before the yield plateaus, and eventually begins to decrease. More information on the optimal seeding density of various crops can be found at the Alberta Ag-Info Center and the Saskatchewan Pulse Growers.

Originally published by Alberta Ag-Info Centre.
Finally, there is a belief that indiscriminate use of pesticides, expensive genetically modified plants (GMO), and implementing the newest technologies and controls will always increase yield. While pesticide use has an important and beneficial role in pest control, indiscriminate use can also remove beneficial organisms and lead to negative consequences. Similarly, while the use of GMOs and modern technology can lead to benefits such as increased drought tolerance, pest resistance, and a reduction in mechanical damage, yield potential is an integrated problem, and depends on numerous factors. The suitability of modern techniques will depend on specific local conditions and the ability to complete proper implementation. The overall agronomic package must be considered before more capital is spent on more pesticides, more GMOs, or more equipment.