Published March 2022
Overview
The plant health issue impacting Saskatchewan chickpea production was observed for a third consecutive year during the 2021 growing season. This issue was initially reported during July of 2019 and recurred during the 2020 growing season. More information on symptomology and evaluations during the 2019 and 2020 growing seasons can be found in the 2020 Saskatchewan Chickpea Plant Health Issue Report.
A wide range of evaluations are currently in progress to identify the causative factors contributing to the chickpea health issue and better understand the impact it has on chickpea crops. These investigations have analysed foliar and root pathogens, plant nutrition, soil and plant microbial profiles, nematode populations, herbicide residues, environmental conditions, and crop management factors; however, results have remained inconclusive and a single cause of the chickpea health issue has not been identified to date.
2021 Field Surveillance & Monitoring
Widespread chickpea field monitoring, surveying, and sample collection was conducted again during the 2021 growing season. A survey of 78 chickpea fields across 36 RMs was led by Dr. Michelle Hubbard, Research Scientist with Agriculture and Agri-Food Canada (AAFC) in Swift Current. These fields were assessed in late June
to July and aboveground chickpea growth was rated for severity of symptoms associated with the chickpea health issue on a scale of 0-5. Samples from the associated rating spots within these fields were also collected and submitted to Dr. Hubbard’s research team and colleagues for further analysis. Detailed field histories were also obtained from growers as part of the chickpea survey to try to better understand possible connections between the severity and distribution of the chickpea health issue with environmental conditions and management factors.
Survey rating scale (0-5) based percent plant area affected (PAA) by symptoms of chickpea health issue:
| 0 | NONE | no symptoms |
| 1 | LOW | <10% PAA, new growth wilted, some leaf tip chlorosis |
| 2 | MODERATE | 10 to 30% PAA chlorotic/necrotic |
| 3 | HIGH | 30 to 60% PAA chlorotic/necrotic |
| 4 | VERY HIGH | 60 to 90% PAA chlorotic/necrotic |
| 5 | DEAD | >90% PAA necrosis |
In conjunction with the larger chickpea health field survey, Saskatchewan Pulse Growers (SPG) also collected 60 plant samples from 28 different fields across 16 rural municipalities (RMs) and submitted them to a commercial laboratory for in-season diagnostic evaluations. These chickpea specimens were collected as paired samples of healthy and unhealthy chickpea plants from each field such that pathogen profiles could hopefully be attributed to symptoms.
SPG closely monitored five of these 28 fields throughout the growing season in a collaborative project with Crop Intelligence. These five fields were located in the core of Saskatchewan’s chickpea growing region and in areas considered to be the most severely impacted by the chickpea health issue in previous seasons. Weather stations, equipped with soil moisture probes, were installed at these field locations to collect site-specific environmental data and sites were monitored
by a SPG summer field intern on a weekly basis. The intent of this collaboration was to gain an understanding of how environmental conditions and soil moisture impacts the onset of the chickpea health issue and the subsequent crop responses. Insights into chickpea growth, rooting depth, water uptake, and heat tolerance were also gained and are summarized in The Chickpea Project: 2021 Report.


Source: Saskatchewan Pulse Growers
Environmental Conditions
The 2021 growing season was characterized by drought and extreme temperatures across much of the pulse growing region in the province, with many areas within the chickpea growing region receiving less than 150 mm of in-season precipitation (May‒August). Environment Canada weather station data indicated that many of these regions also received the bulk of this moisture in late August which was likely too delayed to have significant impacts on chickpea growth and yield in most field locations.
Table 1. In-season precipitation and temperature recorded at Environment Canada weather stations located within the survey region (May 1-August 31, 2021).
| District | RM | Location | Monthly In-Season Precipitation (mm) | Total In-Season Precipitation (mm) | Monthly In-Season Mean Maximum Temperature (°C) | ||||||
| May | June | July | August | May | June | July | August | ||||
| 2B | 161 | Moose Jaw | 66.2 | 77.1 | 5.5 | 157.5 | 306.3 | 18.4 | 26.3 | 29.6 | 25.6 |
| 3AS | 11 | Coronach | 51.6 | 55.8 | 21.7 | 79.2 | 208.3 | 17.4 | 26.9 | 31.3 | 26.5 |
| 12 | Rockglen | 43.9 | 21.8 | 6.3 | 59.3 | 131.3 | 15.8 | 26.2 | 30.4 | 24.8 | |
| 72 | Assiniboia | 47.9 | 33.7 | 32.6 | 100.5 | 214.7 | 17.2 | 26.1 | 29.6 | 24.8 | |
| 3BN | 137 | Swift Current1 | 30.0 | 26.8 | 36.6 | 53.5 | 146.9 | 16.2 | 25.5 | 29.2 | 24.4 |
| 225 | Lucky Lake | 35.0 | 22.8 | 12.9 | 50.3 | 121.0 | 17.2 | 26.0 | 30.5 | 24.7 | |
| 4A | 111 | Maple Creek | 62.5 | 15.8 | 29.0 | 20.3 | 127.6 | 16.5 | 26.9 | 30.7 | 26.1 |
| 4B | 231 | Leader | 33.8 | 33.3 | 18.6 | 30.4 | 116.1 | 17.5 | 27.1 | 31.1 | 26.0 |
| 6B | 284 | Outlook2 | 44.1 | 13.1 | 1.5 | 37.7 | 96.4 | 17.9 | 26.2 | 29.9 | 24.5 |
| 7A | 290 | Kindersley3 | 32.4 | 36.8 | 16.2 | 76.0 | 161.4 | 17.0 | 26.0 | 28.9 | 25.7 |
1 Swift Current weather station is not located in an RM that was surveyed but is bordering RMs that were surveyed (106, 107, 136).
2 Outlook weather station is not located in the surveyed RM in crop district 6B, but is located in adjacent RM (284)
3 Kindersley weather station is not located in an RM that was surveyed but does represent the closest weather station in crop district 7A in nearest proximity to RM 261.
In previous seasons, symptoms of the chickpea health issue were generally reported after a moisture event when it had been dry during the early part of the season. The rainfall patterns of the 2021 season typically presented different than 2020 and 2019 in that early season moisture in May was generally in better alignment with the thirty-year historical mean. Instead of moisture increasing heading into June and July, it tended to diminish and then increase again in August, at the sites enrolled in the Chickpea Project with Crop Intelligence weather stations.

Source: Crop Intelligence
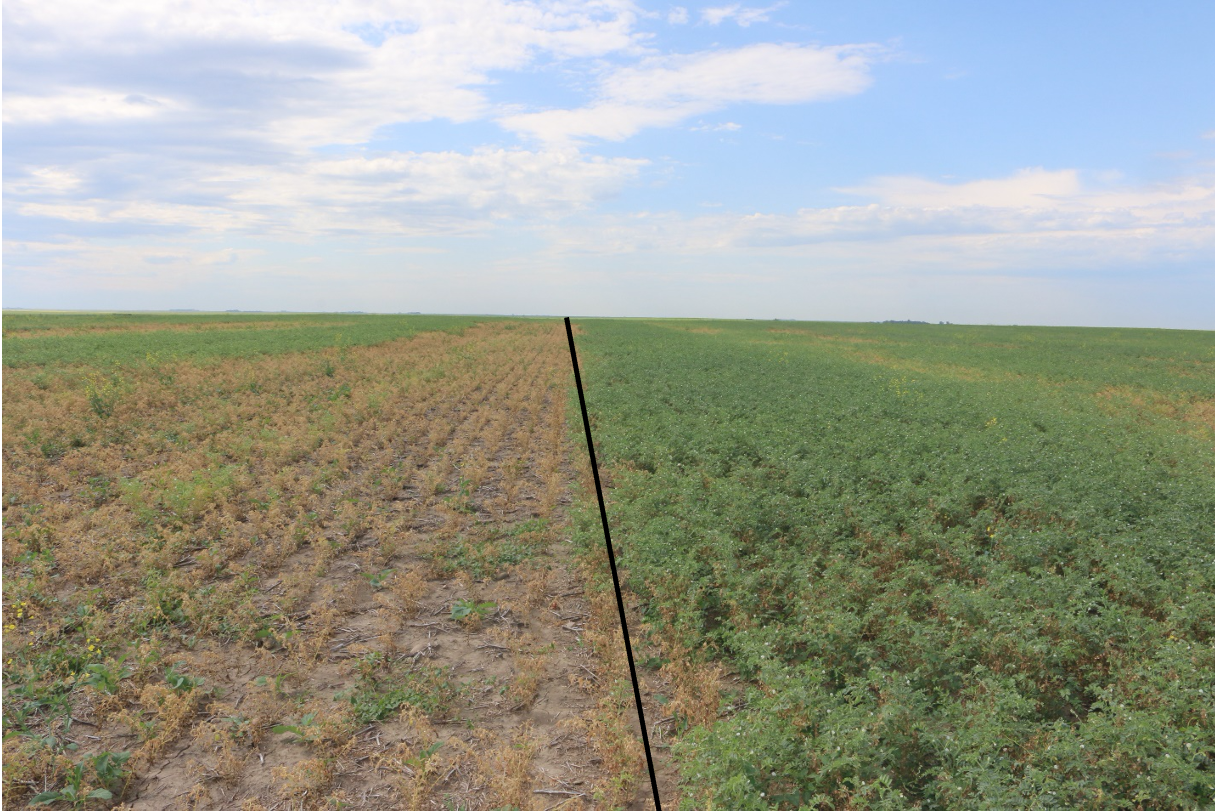
Field Symptoms
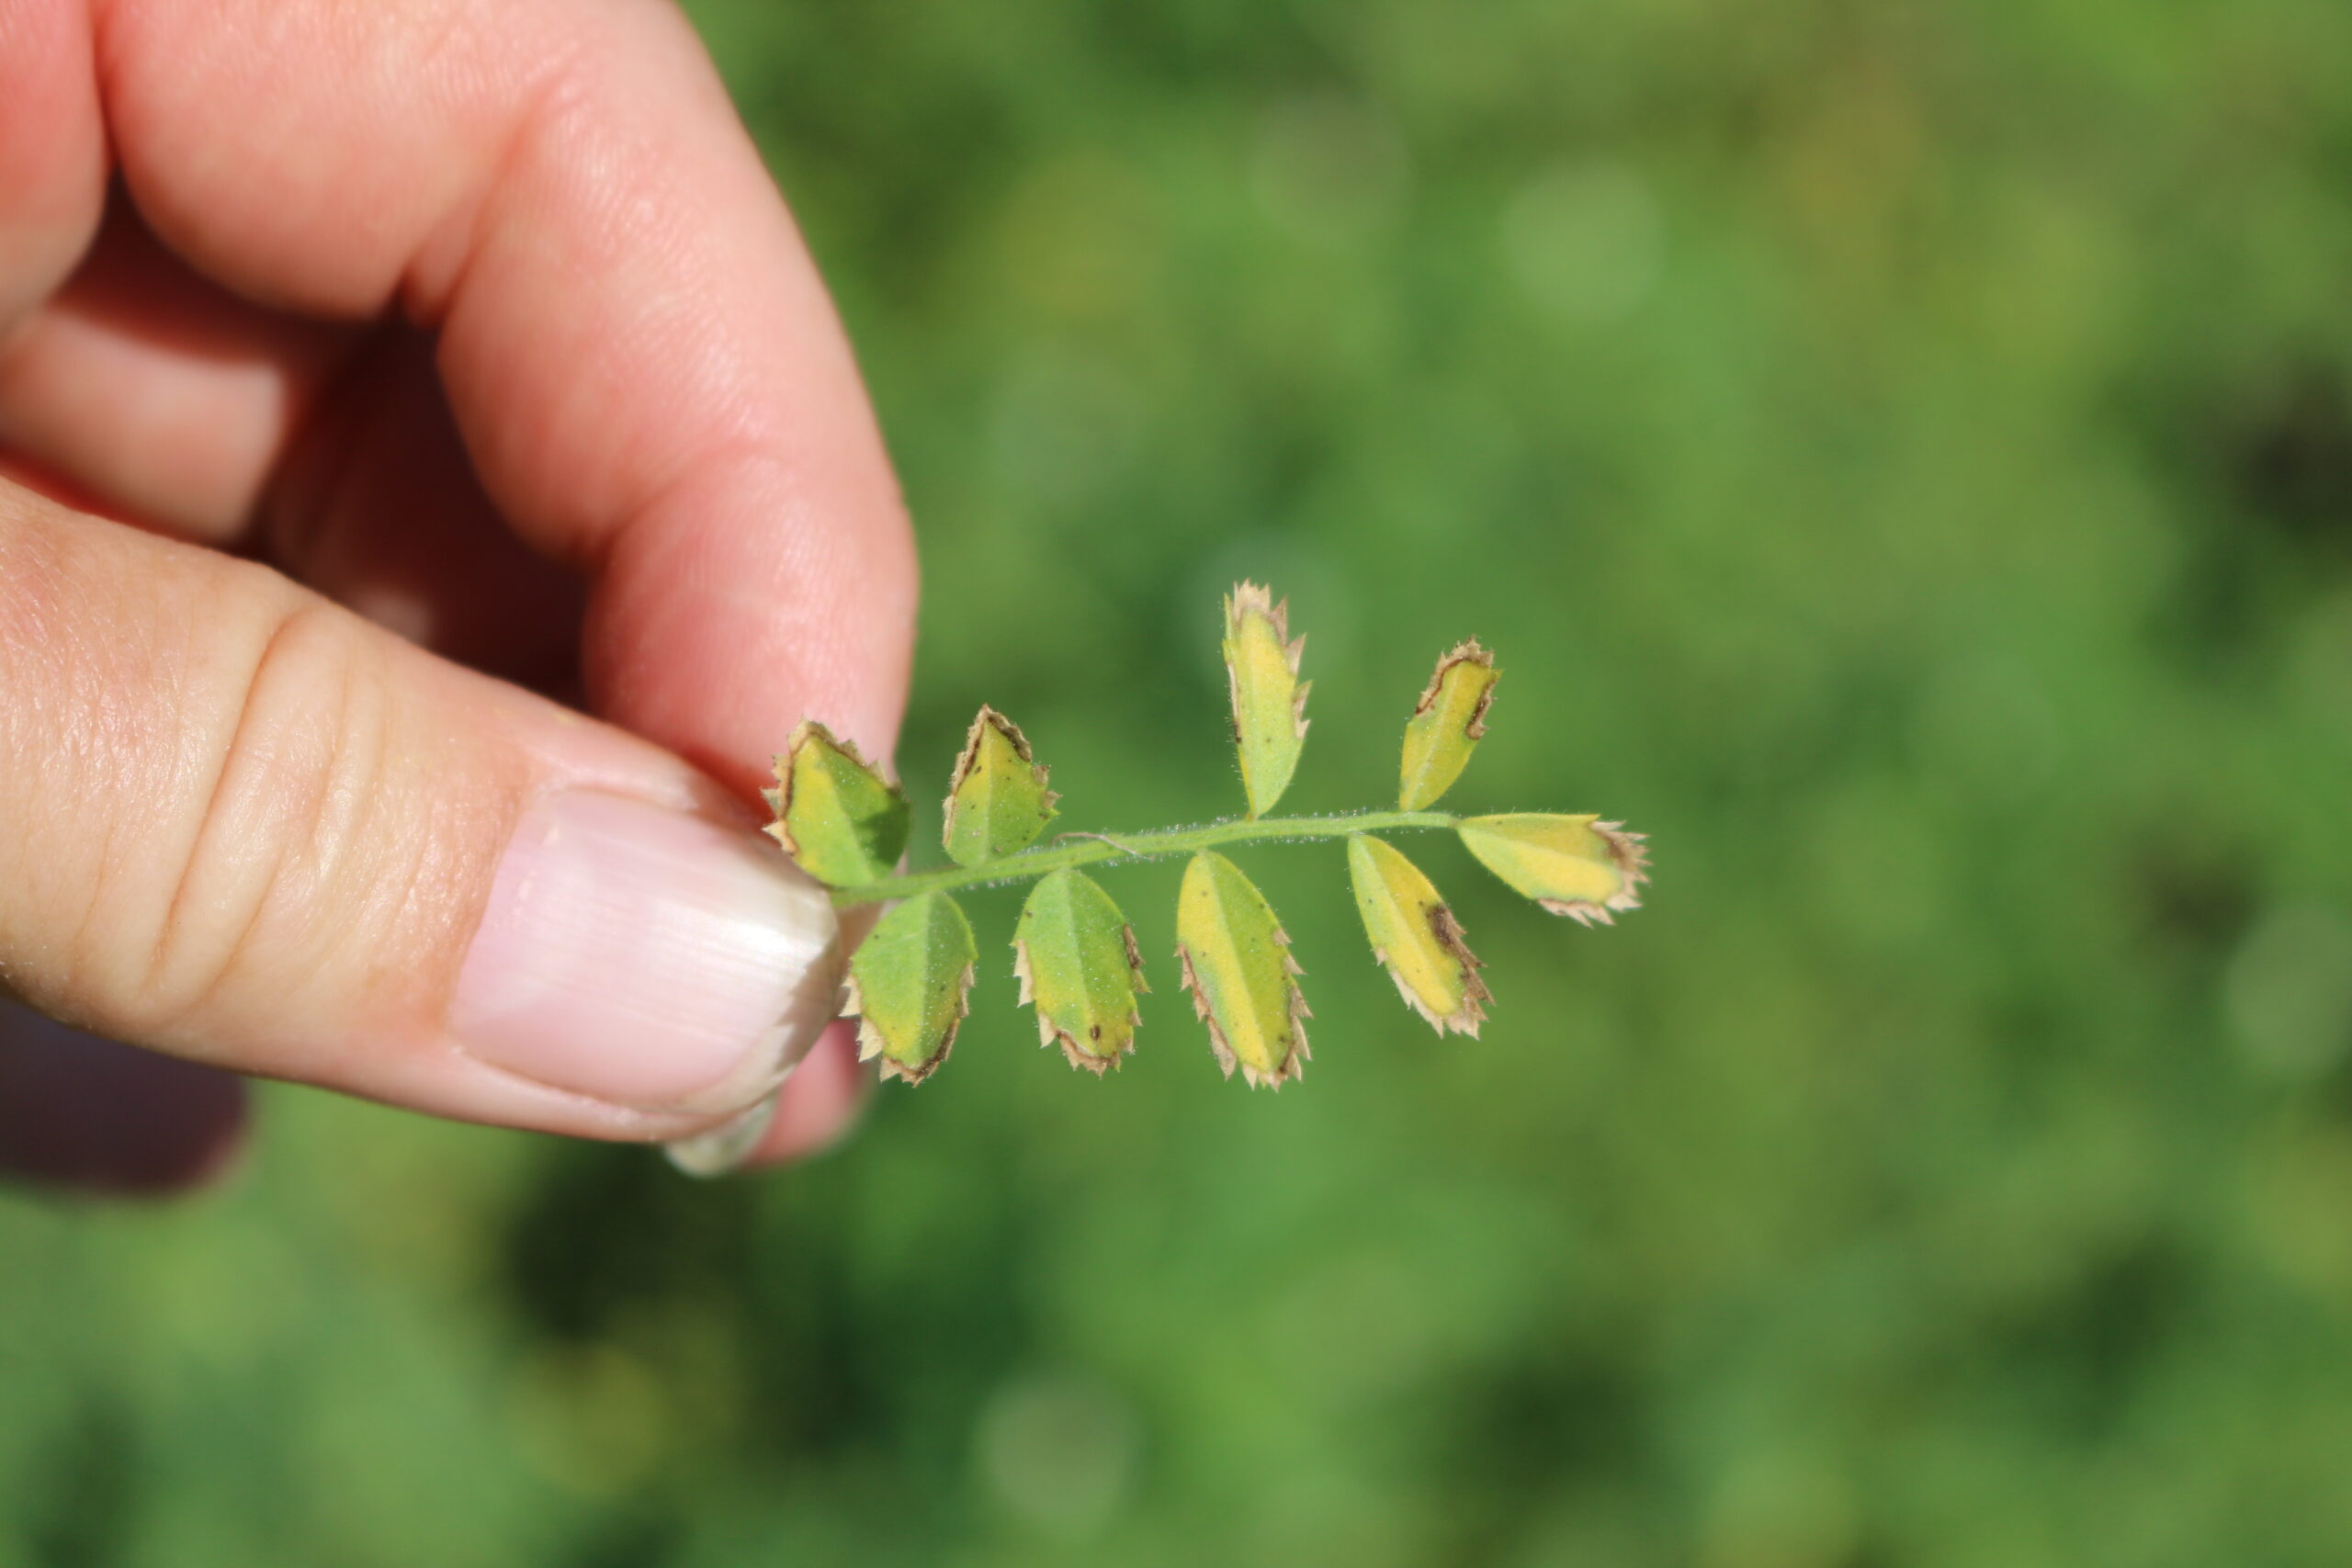
The first chickpea field exhibiting symptoms of the health issue was reported to SPG at the very end of June during the 2021 season. This early seeded chickpea field was located near Caron, SK and had received rainfall prior to the quick onset of symptoms during early stages of flowering. Symptoms were in alignment with previous years’ symptomology of the chickpea health issue including blighting of select leaflets and characteristics wilting of newest growth. Leaf tip chlorosis was noted on impacted leaflets and some unhealthy nodules observed on affected plants. Symptoms were distributed throughout this field.
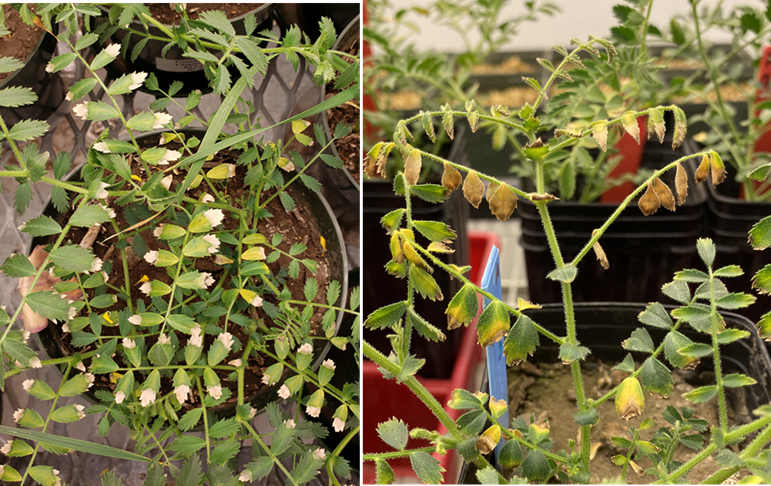
The chickpea health issue was observed in additional fields throughout the first three weeks in July of the 2021 season. This time frame generally coincided with flowering and podding stages as observed in previous seasons, but overall were observed at slightly more advanced crop stages than in 2019 and 2020. However, this could also be attributed to an environmental effect with generally hotter and drier conditions leading to more rapid advancement in crop development. Wilting of upper growth and leaf tip chlorosis were the most consistently reported symptoms across all evaluated chickpea fields. Care was taken to avoid sampling or assessing plant symptomology specifically associated with drought stress or root rot (premature senescence and lower leaf drop, yellowing from bottom up) or ascochyta blight infection. Unlike previous seasons where symptoms were distributed consistently throughout the field or in non-specific large patches, distribution of chickpea plants with health issue was more likely to be random and isolated in 2021. Symptomatic chickpea plants were frequently surrounded by healthy ones and advancement of symptoms did not appear to progress at a rapid rate like had been observed in 2019 and 2020.

Source: Carolyn Wilson

Source: Angie Berner (left), Saskatchewan Pulse Growers (right)
Severity of the health issue was generally lower than observed in seasons prior with many fields being considered as primarily healthy in the context of the chickpea health issue. However, symptoms could be found in majority of chickpea fields surveyed once they were specifically sought out. The overall average rating of severity in the 2021 survey was 2.3 ± 0.83 (0‒5 scale) with the highest mean severity ratings being assessed in crop districts 2B, 3AN, 3AS, and 3BN.

Source: Michelle Hubbard, AAFC
Field Management
Variety Effect
Symptoms of the emerging chickpea health issue do not seem to be variety specific. When the chickpea health issue was initially reported in 2019, symptoms appeared to be more severe in CDC Orion compared to CDC Leader. However, a direct variety effect has generally been dismissed since the earliest observations and the differences between the two dominate kabuli varieties is likely due to differences in flowering periods. Although CDC Orion is later maturing that CDC Leader, it flowers about four days earlier and, therefore, may reach a susceptible stage earlier or stay in it longer. Since 2020, CDC Leader has been the dominate chickpea variety and while symptoms of the health issue do typically appear earlier in CDC Orion they are also observed in CDC Leader slightly later in the season.
Characteristic health issue symptoms were observed on both kabuli and desi chickpea classes including the varieties CDC Orion, CDC Leader, and CDC Consul during the 2021 growing season. Of the 44 fields surveyed with corresponding variety information, symptoms were significantly more severe in CDC Leader (2.5 ± 0.12) than in CDC Orion (1.7 ± 0.33). The mean severity of desi chickpea (CDC Consul) was lower than the kabuli varieties but the sample size was much lower with fields being located outside of the primary chickpea sampling region in crop district 4B.

Source: Carolyn Wilson (left), Angie Berner (middle), and Saskatchewan Pulse Growers (right)
Table 2. Severity of symptoms of health issue by chickpea variety1.
| Chickpea Class | Variety | Sample Number | Mean Severity Rating |
|---|---|---|---|
| Kabuli | CDC Leader | 35 | 2.5 ± 0.12 |
| CDC Orion | 7 | 1.7 ± 0.33 | |
| Desi | CDC Consul | 2 | 1.0 ± 0.0 |
| Total chickpea varieties identified in survey and overall mean severity | 44 | 2.3 ± 0.83 | |
1 Includes rating data from fields with associated variety information (44/78 fields surveyed).
Agronomic Management
In addition to variety data, the survey also gathered information on crop rotation history and proximity to chickpea fields in 2020, fertilizer and inoculant applications, herbicide history of in-season and previous season applications, fungicide use including application timing and product choice, seeding date and approximate seed source age. Field history information is still being analysed but there has not been conclusive findings linking agronomic management or field history to the chickpea health issue to date.
Group 14 herbicide active ingredients including sulfentrazone, carfentrazone, flumioxazin, and saflufenacil found in Authority® (applied to 20 fields), Aim® (six fields), Valtera™ (three fields), and Heat® (two fields), respectively, were the most widely used across surveyed fields with associated crop input data currently available. Metribuzin (i.e. Sencor®) was also applied in 23 of the 38 chickpea fields for which herbicide information was reported during the 2021 season. Average symptom severity was slightly, and significantly, higher for fields receiving applications of metribuzin relative to those that did not.
Recent Sample Analysis
Foliar & Root Pathogens
Disease analysis has been completed on the subset of samples collected by SPG during the 2021 field survey. This DNA-based analysis was completed by a commercial lab (AFL, University of Guelph) and included paired healthy and unhealthy samples from the same field for comparisons of pathogen profiles and relative pathogen abundance.
Results indicate that there was no apparent differences between healthy and unhealthy chickpea samples. One exception to this trend was the presence of Cylindrocladium spp. which was statistically significantly higher on unhealthy samples compared to healthy samples; however, this pathogen was found in only a small number of samples (six unhealthy, one healthy). Clylindrocladium organisms can cause black rot and leaf spot diseases which sometimes have a similar brown and/or purple appearance as noted in some previous observations of chickpea health issue symptoms.
Table 3. Pathogens detected on root and crown of healthy and unhealthy chickpea plants collected during July 2021 using DNA hybridization techniques1.
| Field | Symptoms | Aphanomyces euteiches | Bipolaris spp. | Cylindrocladium spp. | Didymella spp. | Fusarium spp. | F. culmorum | F. oxysporum | F. solani | Olpidium brassicae | Olpidium virulentu | Penicillium spp. | Phytophthora spp. | Plectosphaerella cucumerina | Pythium spp. | P. dissotocum | P. graminicola | P. irregulare | P. intermedium | P. sylvaticum | P. tracheiphilum (group) | P. ultimum | Thielaviopsis basicola | Trichoderma spp. | T. hamatum | T. harzianum |
|---|---|---|---|---|---|---|---|---|---|---|---|---|---|---|---|---|---|---|---|---|---|---|---|---|---|---|
| 1 | UNHEALTHY | 0 | 0 | 0 | 0 | 10 | 0 | 6 | 6 | 0 | 4 | 0 | 0 | 0 | 5 | 0 | 0 | 10 | 0 | 0 | 0 | 0 | 0 | 0 | 0 | 0 |
| HEALTHY | 0 | 0 | 0 | 0 | 10 | 0 | 8 | 10 | 0 | 6 | 0 | 0 | 0 | 10 | 0 | 0 | 2 | 0 | 0 | 0 | 1 | 0 | 0 | 0 | 0 | |
| 2 | UNHEALTHY | 0 | 0 | 10 | 0 | 10 | 0 | 10 | 10 | 0 | 3 | 0 | 0 | 3 | 10 | 0 | 0 | 0 | 0 | 0 | 0 | 10 | 0 | 0 | 0 | 0 |
| HEALTHY | 0 | 0 | 0 | 0 | 10 | 1 | 9 | 7 | 0 | 1 | 1 | 0 | 3 | 10 | 0 | 0 | 4 | 0 | 0 | 0 | 10 | 0 | 0 | 0 | 0 | |
| 3 | UNHEALTHY | 0 | 1 | 0 | 0 | 10 | 1 | 10 | 6 | 0 | 4 | 2 | 0 | 1 | 10 | 0 | 0 | 7 | 0 | 0 | 0 | 10 | 1 | 0 | 0 | 0 |
| HEALTHY | 0 | 1 | 0 | 0 | 10 | 0 | 10 | 4 | 0 | 0 | 1 | 0 | 0 | 10 | 0 | 0 | 7 | 0 | 0 | 0 | 10 | 0 | 1 | 0 | 1 | |
| 4 | UNHEALTHY | 0 | 1 | 0 | 0 | 10 | 1 | 7 | 10 | 0 | 0 | 9 | 0 | 2 | 10 | 0 | 0 | 2 | 0 | 0 | 0 | 10 | 0 | 0 | 0 | 0 |
| HEALTHY | 0 | 3 | 0 | 0 | 10 | 1 | 7 | 6 | 0 | 4 | 1 | 0 | 1 | 10 | 0 | 0 | 0 | 0 | 0 | 0 | 10 | 0 | 0 | 0 | 0 | |
| 5 | UNHEALTHY | 0 | 4 | 10 | 0 | 10 | 1 | 10 | 4 | 0 | 4 | 0 | 0 | 1 | 10 | 0 | 0 | 6 | 0 | 0 | 0 | 10 | 1 | 0 | 0 | 0 |
| HEALTHY | 0 | 1 | 1 | 0 | 10 | 1 | 7 | 4 | 0 | 3 | 3 | 0 | 3 | 8 | 0 | 0 | 5 | 0 | 0 | 0 | 10 | 0 | 0 | 0 | 0 | |
| 6 | UNHEALTHY | 0 | 1 | 0 | 0 | 10 | 1 | 8 | 8 | 0 | 1 | 0 | 0 | 1 | 10 | 0 | 0 | 1 | 0 | 0 | 3 | 10 | 3 | 0 | 0 | 0 |
| HEALTHY | 0 | 1 | 0 | 0 | 10 | 2 | 1 | 10 | 0 | 4 | 4 | 0 | 3 | 10 | 0 | 0 | 1 | 3 | 4 | 0 | 10 | 0 | 0 | 0 | 0 | |
| 7 | UNHEALTHY | 0 | 0 | 0 | 0 | 10 | 0 | 7 | 6 | 0 | 1 | 2 | 0 | 1 | 10 | 0 | 0 | 0 | 0 | 0 | 0 | 10 | 0 | 0 | 0 | 0 |
| HEALTHY | 0 | 1 | 0 | 0 | 8 | 0 | 3 | 6 | 0 | 4 | 1 | 0 | 0 | 9 | 0 | 0 | 0 | 0 | 0 | 0 | 10 | 0 | 0 | 0 | 0 | |
| 8 | UNHEALTHY | 0 | 0 | 1 | 0 | 10 | 1 | 7 | 5 | 0 | 1 | 0 | 0 | 1 | 8 | 0 | 0 | 7 | 0 | 0 | 0 | 9 | 0 | 0 | 0 | 0 |
| HEALTHY | 0 | 2 | 0 | 0 | 9 | 4 | 1 | 4 | 0 | 0 | 0 | 0 | 1 | 4 | 0 | 1 | 4 | 0 | 0 | 0 | 1 | 0 | 0 | 0 | 0 | |
| 9 | UNHEALTHY | 0 | 1 | 0 | 0 | 10 | 1 | 8 | 10 | 0 | 1 | 0 | 0 | 2 | 10 | 0 | 0 | 0 | 0 | 0 | 0 | 10 | 0 | 0 | 0 | 0 |
| HEALTHY | 0 | 1 | 0 | 0 | 10 | 1 | 5 | 6 | 2 | 6 | 1 | 0 | 0 | 10 | 0 | 0 | 0 | 0 | 0 | 0 | 10 | 0 | 0 | 0 | 0 | |
| 10 | UNHEALTHY | 0 | 1 | 0 | 0 | 10 | 0 | 8 | 6 | 0 | 10 | 0 | 0 | 1 | 10 | 0 | 0 | 0 | 0 | 0 | 1 | 10 | 0 | 0 | 0 | 0 |
| HEALTHY | 0 | 1 | 0 | 0 | 10 | 1 | 3 | 3 | 0 | 10 | 1 | 0 | 1 | 7 | 0 | 0 | 0 | 0 | 0 | 4 | 2 | 0 | 0 | 0 | 0 | |
| 11 | UNHEALTHY | 0 | 1 | 0 | 0 | 10 | 0 | 6 | 2 | 0 | 1 | 0 | 0 | 1 | 5 | 6 | 0 | 4 | 0 | 0 | 0 | 4 | 0 | 0 | 0 | 0 |
| HEALTHY | 0 | 1 | 0 | 0 | 7 | 2 | 2 | 1 | 0 | 1 | 0 | 1 | 1 | 10 | 5 | 0 | 6 | 0 | 0 | 0 | 10 | 0 | 0 | 0 | 0 | |
| 12 | UNHEALTHY | 0 | 1 | 0 | 0 | 9 | 0 | 5 | 6 | 0 | 1 | 0 | 0 | 0 | 5 | 0 | 0 | 4 | 0 | 0 | 0 | 4 | 0 | 0 | 0 | 0 |
| HEALTHY | 0 | 0 | 0 | 0 | 8 | 0 | 4 | 6 | 0 | 5 | 0 | 1 | 1 | 4 | 0 | 0 | 2 | 0 | 0 | 1 | 6 | 0 | 0 | 0 | 0 | |
| 13 | UNHEALTHY | 0 | 1 | 0 | 0 | 6 | 0 | 1 | 3 | 0 | 0 | 1 | 0 | 1 | 7 | 0 | 0 | 7 | 0 | 5 | 0 | 10 | 0 | 0 | 0 | 0 |
| HEALTHY | 0 | 0 | 0 | 0 | 10 | 0 | 5 | 5 | 0 | 0 | 3 | 0 | 1 | 6 | 0 | 0 | 6 | 0 | 1 | 1 | 4 | 0 | 0 | 0 | 0 | |
| 14 | UNHEALTHY | 0 | 1 | 0 | 0 | 10 | 0 | 4 | 5 | 0 | 0 | 1 | 0 | 0 | 10 | 0 | 0 | 8 | 0 | 0 | 0 | 10 | 0 | 0 | 0 | 0 |
| HEALTHY | 3 | 1 | 0 | 0 | 10 | 0 | 5 | 6 | 0 | 1 | 1 | 0 | 0 | 9 | 0 | 0 | 9 | 0 | 0 | 0 | 10 | 0 | 0 | 0 | 0 | |
| 15 | UNHEALTHY | 0 | 0 | 0 | 0 | 10 | 0 | 8 | 5 | 0 | 1 | 0 | 0 | 1 | 10 | 0 | 0 | 10 | 0 | 0 | 0 | 10 | 0 | 0 | 0 | 0 |
| HEALTHY | 0 | 0 | 0 | 0 | 10 | 0 | 7 | 7 | 0 | 1 | 1 | 0 | 1 | 10 | 0 | 0 | 3 | 0 | 0 | 0 | 10 | 0 | 0 | 0 | 0 | |
| UNHEALTHY | 0 | 0 | 0 | 0 | 10 | 0 | 10 | 3 | 0 | 1 | 1 | 0 | 0 | 9 | 1 | 0 | 8 | 0 | 0 | 0 | 10 | 0 | 0 | 0 | 0 | |
| HEALTHY | 0 | 0 | 0 | 0 | 10 | 0 | 6 | 10 | 0 | 1 | 1 | 0 | 0 | 10 | 0 | 0 | 8 | 0 | 0 | 0 | 10 | 0 | 1 | 0 | 1 | |
| 16 | UNHEALTHY | 0 | 1 | 0 | 1 | 4 | 0 | 1 | 10 | 0 | 1 | 2 | 0 | 1 | 7 | 0 | 0 | 0 | 0 | 5 | 0 | 0 | 0 | 1 | 1 | 0 |
| HEALTHY | 0 | 1 | 0 | 0 | 6 | 0 | 1 | 4 | 0 | 4 | 1 | 0 | 0 | 6 | 0 | 0 | 4 | 0 | 0 | 0 | 10 | 0 | 0 | 0 | 0 | |
| 17 | UNHEALTHY | 0 | 0 | 1 | 0 | 10 | 1 | 6 | 5 | 0 | 3 | 1 | 0 | 0 | 5 | 2 | 0 | 7 | 0 | 0 | 0 | 0 | 0 | 0 | 0 | 0 |
| HEALTHY | 0 | 0 | 0 | 0 | 10 | 1 | 7 | 8 | 0 | 5 | 3 | 0 | 1 | 10 | 4 | 0 | 6 | 0 | 0 | 0 | 10 | 0 | 0 | 0 | 0 | |
| 18 | UNHEALTHY | 0 | 0 | 0 | 0 | 8 | 1 | 3 | 10 | 0 | 0 | 2 | 0 | 1 | 8 | 0 | 0 | 0 | 0 | 0 | 0 | 8 | 0 | 0 | 0 | 0 |
| UNHEALTHY | 0 | 0 | 0 | 0 | 9 | 1 | 2 | 9 | 0 | 0 | 6 | 0 | 0 | 6 | 0 | 0 | 5 | 0 | 0 | 2 | 5 | 0 | 0 | 0 | 0 | |
| HEALTHY | 0 | 0 | 0 | 0 | 4 | 0 | 1 | 3 | 0 | 0 | 3 | 0 | 0 | 7 | 0 | 0 | 9 | 0 | 0 | 0 | 9 | 0 | 0 | 0 | 0 | |
| 19 | UNHEALTHY | 0 | 0 | 0 | 0 | 8 | 0 | 3 | 4 | 0 | 2 | 0 | 0 | 0 | 9 | 0 | 0 | 0 | 0 | 0 | 0 | 10 | 0 | 0 | 0 | 0 |
| HEALTHY | 0 | 1 | 0 | 0 | 6 | 1 | 1 | 4 | 0 | 2 | 1 | 0 | 0 | 5 | 0 | 0 | 0 | 0 | 0 | 0 | 5 | 0 | 0 | 0 | 0 | |
| 20 | UNHEALTHY | 0 | 0 | 0 | 0 | 8 | 0 | 4 | 6 | 0 | 6 | 2 | 0 | 1 | 10 | 0 | 0 | 8 | 0 | 1 | 0 | 0 | 0 | 0 | 0 | 0 |
| HEALTHY | 0 | 0 | 0 | 0 | 10 | 0 | 5 | 6 | 0 | 1 | 1 | 0 | 0 | 7 | 1 | 1 | 7 | 0 | 1 | 1 | 0 | 0 | 1 | 0 | 1 | |
| 21 | UNHEALTHY | 0 | 0 | 0 | 0 | 9 | 0 | 1 | 2 | 0 | 1 | 2 | 0 | 0 | 8 | 0 | 0 | 0 | 0 | 0 | 0 | 0 | 0 | 0 | 0 | 0 |
| UNHEALTHY | 0 | 1 | 0 | 0 | 5 | 0 | 1 | 2 | 0 | 0 | 5 | 0 | 0 | 6 | 0 | 0 | 0 | 0 | 0 | 0 | 8 | 0 | 1 | 1 | 1 | |
| HEALTHY | 0 | 0 | 0 | 0 | 7 | 0 | 1 | 9 | 0 | 0 | 5 | 0 | 0 | 7 | 0 | 0 | 0 | 0 | 0 | 0 | 1 | 0 | 0 | 0 | 1 | |
| 22 | UNHEALTHY | 0 | 0 | 0 | 0 | 8 | 0 | 3 | 8 | 0 | 0 | 0 | 0 | 0 | 10 | 0 | 0 | 0 | 0 | 0 | 0 | 10 | 0 | 0 | 0 | 0 |
| HEALTHY | 0 | 0 | 0 | 0 | 8 | 0 | 1 | 6 | 0 | 7 | 5 | 0 | 0 | 7 | 0 | 0 | 1 | 0 | 0 | 0 | 4 | 0 | 0 | 0 | 0 | |
| 23 | UNHEALTHY | 0 | 0 | 0 | 0 | 10 | 0 | 8 | 1 | 0 | 0 | 0 | 0 | 0 | 7 | 0 | 0 | 2 | 0 | 0 | 0 | 10 | 0 | 0 | 0 | 0 |
| HEALTHY | 0 | 0 | 0 | 0 | 10 | 1 | 7 | 4 | 0 | 0 | 1 | 0 | 0 | 10 | 0 | 0 | 6 | 0 | 0 | 0 | 10 | 0 | 0 | 0 | 0 | |
| 24 | UNHEALTHY | 0 | 0 | 0 | 0 | 10 | 0 | 6 | 5 | 0 | 2 | 0 | 0 | 1 | 4 | 0 | 0 | 0 | 0 | 0 | 0 | 7 | 0 | 0 | 0 | 0 |
| HEALTHY | 0 | 0 | 0 | 0 | 8 | 0 | 4 | 6 | 0 | 3 | 0 | 0 | 1 | 8 | 0 | 0 | 0 | 0 | 0 | 1 | 7 | 0 | 0 | 0 | 0 | |
| 25 | UNHEALTHY | 0 | 1 | 5 | 0 | 7 | 1 | 4 | 4 | 0 | 6 | 1 | 0 | 1 | 7 | 0 | 0 | 3 | 0 | 0 | 0 | 7 | 0 | 0 | 0 | 0 |
| HEALTHY | 0 | 1 | 0 | 0 | 10 | 0 | 6 | 5 | 0 | 7 | 0 | 0 | 1 | 7 | 0 | 0 | 0 | 0 | 0 | 0 | 8 | 0 | 0 | 0 | 0 | |
| 26 | UNHEALTHY | 0 | 1 | 0 | 0 | 10 | 0 | 10 | 10 | 0 | 7 | 1 | 0 | 0 | 10 | 0 | 0 | 7 | 0 | 0 | 0 | 10 | 0 | 0 | 0 | 0 |
| HEALTHY | 0 | 1 | 0 | 0 | 10 | 0 | 5 | 10 | 0 | 2 | 1 | 0 | 0 | 9 | 0 | 0 | 5 | 0 | 0 | 0 | 10 | 0 | 0 | 0 | 0 | |
| 27 | UNHEALTHY | 0 | 0 | 0 | 0 | 10 | 0 | 7 | 9 | 0 | 2 | 0 | 8 | 0 | 7 | 0 | 0 | 1 | 0 | 0 | 0 | 8 | 0 | 0 | 0 | 0 |
| HEALTHY | 0 | 0 | 0 | 0 | 9 | 0 | 4 | 10 | 0 | 1 | 1 | 0 | 0 | 4 | 0 | 0 | 0 | 0 | 0 | 0 | 8 | 0 | 0 | 0 | 0 | |
| 28 | UNHEALTHY | 0 | 1 | 4 | 0 | 10 | 1 | 7 | 10 | 0 | 1 | 0 | 0 | 1 | 10 | 0 | 0 | 3 | 0 | 0 | 0 | 8 | 0 | 0 | 0 | 0 |
| HEALTHY | 0 | 0 | 0 | 0 | 10 | 1 | 10 | 6 | 0 | 1 | 1 | 0 | 1 | 10 | 0 | 0 | 0 | 0 | 0 | 0 | 10 | 0 | 0 | 0 | 0 |
1 If DNA of a target plant pathogen is detected, the hybridization signal strength is compared to that of a standard detection control. A high level (red) indicates that the target pathogen in the sample was found to be ~70% the strength of the detection control signal. A moderate level (orange) indicates 40-69%, and a low level (yellow) means 2-39%. Any signal lower than 2% is considered to be negative. This method should be considered qualitative (presence/absence) and not quantitative (measured) as the correlation between these levels and actual disease severity on the plant host has not been determined.
There were also no significant differences in overall pathogen loading on between healthy and unhealthy root and crown chickpea samples submitted to the commercial lab for analysis. Average pathogen score (sum of all pathogens detected on sample DNA screen) and average number of pathogens were similar in healthy and unhealthy samples, with healthy samples actually having a slightly higher mean number of pathogens detected relative to unhealthy.
A fungal plating method was used to isolate Fusarium spp. from the roots and crowns of fresh chickpea samples submitted to the commercial lab. Identification to the species level was completed using Elongation Factor DNA sequencing. Fusarium redolens was the most prevalent Fusarium species sequenced and was identified on 33 of the 60 samples. However, F. redolens was identified equally on healthy (17) as unhealthy (16) samples and was only present in only the unhealthy samples in 27% of the fields. F. redolens is a pathogen of concern as it has been identified as a causal agent of wilt and yellowing in chickpea.
Pathogens detected on foliar tissue were identified using microscopy and included Alternaria spp., Ascochyta rabiei, Cladoporium spp., Fusarium spp., Rhizopus spp., Sclerotinia spp., and Stemphylium spp. Alternaria was by far the most prevalent and was identified on 36 of the 60 samples. Although it was identified in both healthy and unhealthy samples, Alternaria was slightly more prevalent in unhealthy (21) samples compared to healthy 15).
A chickpea root rot survey, led by Dr. Sabine Banniza at the University of Saskatchewan, was conducted concurrently with the chickpea health survey in a cross section of fields. Molecular testing revealed that Fusarium solani, F. avenaceum, and F. redolens were the most prevalent root rot species in the chickpea fields surveyed. There was also detection of F. culmorum and F. sporotrichioides in some fields as well as Verticillium dahlia in several fields. Phytophthora, Verticillium albo-atrum or Thielaviopsis were not detected in any of the samples. Although F. oxysporum generally identified in both commercial lab testing and analysis by Dr. Banniza’s lab, there was no presence of the specific sub-species F. oxysporum f.sp. ciceris detected in the chickpea samples. Additional testing for pathogenicity and screening chickpea germplasm for resistance will be done in the future.
Nutrient Analysis
Macro and micro nutrient content comparisons of healthy and unhealthy chickpea plants are not available at this time. Chickpea samples collected during the 2021 field survey and submitted to Dr. Hubbard’s lab have been air dried and ground for further processing. These samples will be further analyzed for tissue nutrient content by Dr. Jeff Schoenau’s lab at the University of Saskatchewan.
Nemotodes
Three fields with high pin nematode extraction numbers identified during the 2020 chickpea season were resampled by SPG in the spring of 2021 and submitted to Dr. Mario Tenuta’s Soil Ecology Lab at the University of Manitoba. Three separate soil samples were collected in each of the three fields and despite variability in pin nematode numbers the extraction analysis again revealed relatively high pin nematode levels in all three fields. Resampled fields at Bateman and Coronach retained total pin nematode counts in the thousands whereas Verwood nematode levels were significantly lower during the second sampling period. The vast majority of nematodes extracted in spring 2021 soil samples from all three fields were identified as juveniles (stylet absent).
Table 4. Follow-up nematode extractions1 from previous chickpea fields resampled in spring 2021 identified with high nematode counts during 2020 anlaysis.
| 2020 Chickpea Field Location | Paratylenchus | Ditylenchus | Tylenchorhynchus | Total Nematodes |
| (mean no. per 100g dry soil) ± SD | ||||
| Coronach, SK | 2521 ± 2593 | 31 ± 28 | 33 ± 49 | 2585 ± 2528 |
| Bateman, SK | 4653 ± 1626 | 75 ± 29 | 0 ± 0 | 4729 ± 1648 |
| Verwood, SK | 203 ± 232 | 9 ± 2 | 14 ± 6 | 226 ± 234 |
1 Cobb’s Sieving-Decanting and Sugar Flotation and Genus Counts (Dr. Mario Tenuta, University of Manitoba)

Source: Dr. Mario Tenuta, University of Manitoba
Root and soil samples from six chickpea fields in 2021 were collected post-harvest by SPG and submitted to Dr. Tenuta’s lab. Eight samples, representing an equal split of healthy and unhealthy sample collection points (GPS referenced), were obtained from these fields located near Mossbank (2 separate sites), Gravelbourg, Ogema, Coronach, and Leader, SK. Results are not finalized, but initial analysis suggests a trend toward higher quantities of pin nematodes (Pratylenchus spp.) in soil and root samples associated with areas of field with chickpea exhibiting symptoms of health issue during 2021 growing season.
Reported symptoms of the chickpea health issue do not align perfectly with expected nematode damage. However, it may be possible that drought conditions are aggravating nematode damage on chickpea. Further greenhouse studies need to be conducted to understand the potential impact and associated symptomology of nematodes on chickpea as well as determine the rotational effect of chickpea on nematode populations.
Microbiome
A microbiome analysis was conducted on chickpea soil and plant samples collected during the 2020 growing season by Dr. Jennifer Town and Dr. Tim Dumonceaux, Research Scientists with AAFC in Saskatoon, SK. Low sample size and an imbalance between healthy and unhealthy samples made it difficult to ascertain conclusive associations between microbiome profiles and plant health, however, a summary of the analyses is as follows:
- No significant correlation between plant health status and differences in bacterial, fungal, or oomycete community was detected.
- A significant correlation between nematode counts and the differences in bacterial and oomycete community composition was detected. This suggests a relationship between microbial community composition in soil and the abundance of nematodes.
- The majority of the oomycetes sequences amplified from both plant and soil samples were classified as Pythium spp.
- In the plant samples, there were two fungal sequences that were significantly associated with healthy plants but no sequences that were significantly associated with unhealthy plants.
- In the soil samples, there were several microorganisms associated with healthy fields, as well as one fungus (Mortierella spp.) and one oomycete (Pythium spp.) that were significantly associated with unhealthy fields.
On-Going & Upcoming Investigations
Soil Bioassay Greenhouse Experiments

Source: Dr. Shaun Sharpe, AAFC
A series of greenhouse experiments examining the response of chickpea exposed to various herbicide residues, soil-borne fusarium and nematode pressures, and moisture regimes have been initiated by Dr. Shaun Sharpe, Research Scientist with AAFC in Saskatoon. These experiments have been designed in an attempt to reproduce symptomology associated with the chickpea health issue with the rationale for treatments informed by data collected during the 2019 and 2020 seasons. For instance, clopyralid carryover was chosen as a potential contributor of the health issue as there was some indication of its use one to two years before chickpea in some of the fields reported in the 2020 survey. Additionally, clopyralid can persist on crop stubble for long periods and then become activated when leached into the soil following rainfall and be damaging to chickpea.
Experiments did induce significant chlorotic and necrotic vegetative tissue in the chickpeas but only for water stress treatments. There was a very clear injury gradient from defoliated to healthy when water stress was relieved and the plants were large enough to recover; however, there was no impact of field soil treatments in clopyralid, fusarium, or general soil bioassay experiments. Plant height was impacted by slope position in the fusarium infested soil bioassay study with chickpea plants grow in depression positions measuring 32 cm compared to chickpea plants grown in knoll position or control soils measuring only 27 cm. Initial replicates of the metribuzin and general field soil assay studies are still ongoing, but early observations have noted abnormal growth (symptoms not congruent with chickpea health issue) in nematode infested soil and a potential wilting response in the chickpea metribuzin study.
Table 5. Description of greenhouse experiments examining chickpea response to various stress factors (Dr. Shaun Sharpe, AAFC)
| Experiment | Description |
|---|---|
| Clopyralid Carryover x Water Stress Interaction | Chickpea (CDC Leader) was grown in a soil that was treated with clopyralid during the 2020 season and collected during the spring of 2021. Various irrigation regimes (none, intermittent, and full) were imposed on chickpea grown in the clopyralid bioassay with percent plant chlorosis and plant height evaluated 7, 22, and 36 days after water stress initiation. |
| Fusarium Infested Soil x Water Stress Interaction | Chickpea (CDC Leader) was grown in a soil from a field near Kayville, SK, that was identified as having a combination of healthy and unhealthy chickpea plants during the 2020 season. Plant samples from this field and tested in 2020 revealed presence of various Fusarium spp. including Fusarium redolens. Soil samples from this field were collected in spring of 2021 from knoll and depression slope positions to compare expected landscape differences in soil water content. Soil samples were also collected from a 2020 chickpea field near Maple Creek, SK did not exhibit that symptoms of the health issue and was established as a control soil treatment in this study. Various irrigation regimes (intermittent and full) were imposed on chickpea grown in the fusarium infested soil (knoll and depression positions) and control soils with percent plant chlorosis and plant height evaluated 7, 22, and 36 days after water stress initiation. |
| Field Soil Bioassay x Water Stress Interaction | Chickpea (CDC Leader) are currently being grown in a number of soils from fields identified during the 2020 chickpea survey and selected for expected soil-borne fusarium infestation (two separate field sites and landscape positions near Corderre, and Kayville, SK), high nemotode counts (Verwood, SK) and as a healthy control soil (Maple Creek, SK). Similar water stress regimes as described above were layered on top of soil bioassay treatments. |
| Metribuzin Rate x Water Stress Interaction | Four rates of metribuzin (0, 0.5, 1 and 2X) have been applied to chickpea (CDC Leader) grown as potted plants. Treatments with and without water stress have also been overlaid on metribuzin dose treatments. |
Note: No Irrigation = minimally watered to simulate drought conditions; Intermittent Irrigation= soil brought down to permanent wilting point and re-irrigated to bring soil moisture back up to field capacity; Full Irrigation= continuously watered to maintain soil moisture at field capacity.
A sugar beet root and shoot length bioassay was also conducted separately on the soils included in the previously described general soil bioassay by Dr. Jeff Schoenau and Dr. Anna Szmigielski of the University of Saskatchewan. Sugar beet was used as a bioindicator species in this experiment due to the previously established protocol with this testing method for the detection of soil-applied herbicide residues and the sensitive response of sugar beet root growth to soil stresses.
Table 6. Root and shoot length (cm) of sugar beet plants gown for seven days in various field soils1.
| Soil Description | Sample Collection | Mean Root Length | Mean Shoot Length | No. of Plants (/18 planted) |
| (cm) ± SD | ||||
| Fusarium Infested (Corderre, SK) | Depression (Benchmark) | 6.8±0.42 | 3.5±0.61 | 11 |
| Fusarium Infested (Ogema, SK) | Depression (Benchmark) | 6.0±0.14 | 3.0±0.45 | 12 |
| Fusarium Infested (Corderre, SK) | Knoll (Benchmark) | 5.1±0.56 | 3.0±0.32 | 12 |
| Fusarium Infested (Ogema, SK) | Knoll (Benchmark) | 6.3±0.28 | 2.9±0.14 | 11 |
| Control (Maple Creek, SK) | Entire FIeld (Random Composite) | 5.8±0.532 | 1.8±0.202 | 5 |
| Nematode Infested (Verwood, SK) | Entire FIeld (Random Composite) | 1.0±0.23 | 1.8±0.48 | 12 |
Chickpea Response to Potash Fertilizer
A research project entitled Improving Chickpea, Mustard, and Durum Yield, Crop Health, and Soil Fertility with Potassium Chloride Fertilizer led by Dr. Jeff Schoenau (University of Saskatchewan) will be established during the 2022 field season. This research aims to generate information on how chickpea responds to the addition of potassium chloride (KCl) fertilizer at the landscape scale in southern Saskatchewan and gain a better understanding of the interaction between soil fertility status and chickpea crop health, specifically disease incidence.
2022 Field-Scale Monitoring & Investigations
The chickpea plant health survey is proposed to continue for another season in 2022. The protocol is expected to remain similar to the 2021 survey with an emphasis on larger plant sample volumes and more paired sampling of healthy and unhealthy samples collected from the same field. If you are a chickpea grower who would like to participate in the 2022 chickpea health survey please enroll your farm in the provincial pest monitoring program via this online sign-up form. For more information on the survey please contact Dr. Michelle Hubbard.
Saskatchewan Pulse Growers will again have a summer field intern on staff for the 2022 growing season. Located in southern Saskatchewan, this student will have a primary role in monitoring and surveillance of chickpea fields including five key sites that will be established for a second year of the collaborative field project with Crop Intelligence. Saskatchewan Pulse Growers is also interested in working with agronomists and growers to implement field-scale trials focusing on chickpea agronomy and the potential mitigation of the chickpea health issue.
Acknowledgements
Saskatchewan Pulse Growers would like to thank the many individuals who have contributed their time and expertise to understanding the chickpea health issue in the past seasons. Special acknowledgment is extended to the many surveyors and agronomists who collected samples during the 2021 season including: Saskatchewan Ministry of Agriculture, Saskatchewan Crop Insurance, Saskatchewan Association of Rural Municipalities, Soils and Such, Prairie Plains Agro, Richardson Pioneer, and Syngenta. Thank you to all the growers who supported the surveys by providing access to their fields and contributing field history information. Funding support contributed towards various aspects of these research projects and field investigations has been provided by the Agriculture Development Fund (Saskatchewan Ministry of Agriculture), Crop Intelligence, Saskatchewan Pulse Growers, and Western Grains Research Foundation.
Contributors/Authors:
- Dr. Anna Szmigielski—Research Scientist (Soil Science), University of Saskatchewan
- Dr. Jeff Schoenau—Professor (Soil Science), University of Saskatchewan
- Dr. Jennifer Town—Research Scientist (Soil Microbiology), AAFC
- Dr. Mario Tenuta—Professor (Soil Ecology), University of Manitoba
- Dr. Michelle Hubbard—Research Scientist (Pulse Pathology), AAFC
- Dr. Sabine Banniza—Professor (Pathology), University of Saskatchewan
- Dr. Shaun Sharpe—Research Scientist (Weeds), AAFC
- Dr. Tim Dumonceaux—Research Scientist (Soil Microbiology), AAFC
- Sarah Anderson—Agronomy Manager, Saskatchewan Pulse Growers
- Skylee Woodley—Summer Field Intern (2021), Saskatchewan Pulse Growers
- Vanessa Bell—Agronomist, Crop Intelligence