Published November 2020
Overview
A plant health issue was brought to the attention of Saskatchewan Pulse Growers (SPG) in late July of 2019 and occurred again in 2020. Samples from 2019 were evaluated by researchers Dr. Sabine Banniza from the Crop Development Centre (CDC) at the University of Saskatchewan and Dr. Michelle Hubbard from Agriculture and Agri-Food Canada (AAFC) Swift Current. Due to the late sampling in 2019 the samples all had a high level of Ascochyta rabiei that was insensitive to strobilurin fungicides, while no other foliar pathogens were identified. Some root samples did show signs of root rot with
high prevalence of Fusarium solani and Fusarium redolens identified. In 2020, local growers and agronomists conducted extensive sampling on behalf of SPG for analysis of herbicide residues, nutrient levels, and foliar and root pathogens, performed at a commercial lab. Results from these tests have not identified any one cause of the chickpea health issue and it is likely that a combination of factors are involved. Further evaluations are currently underway.
Field Symptoms
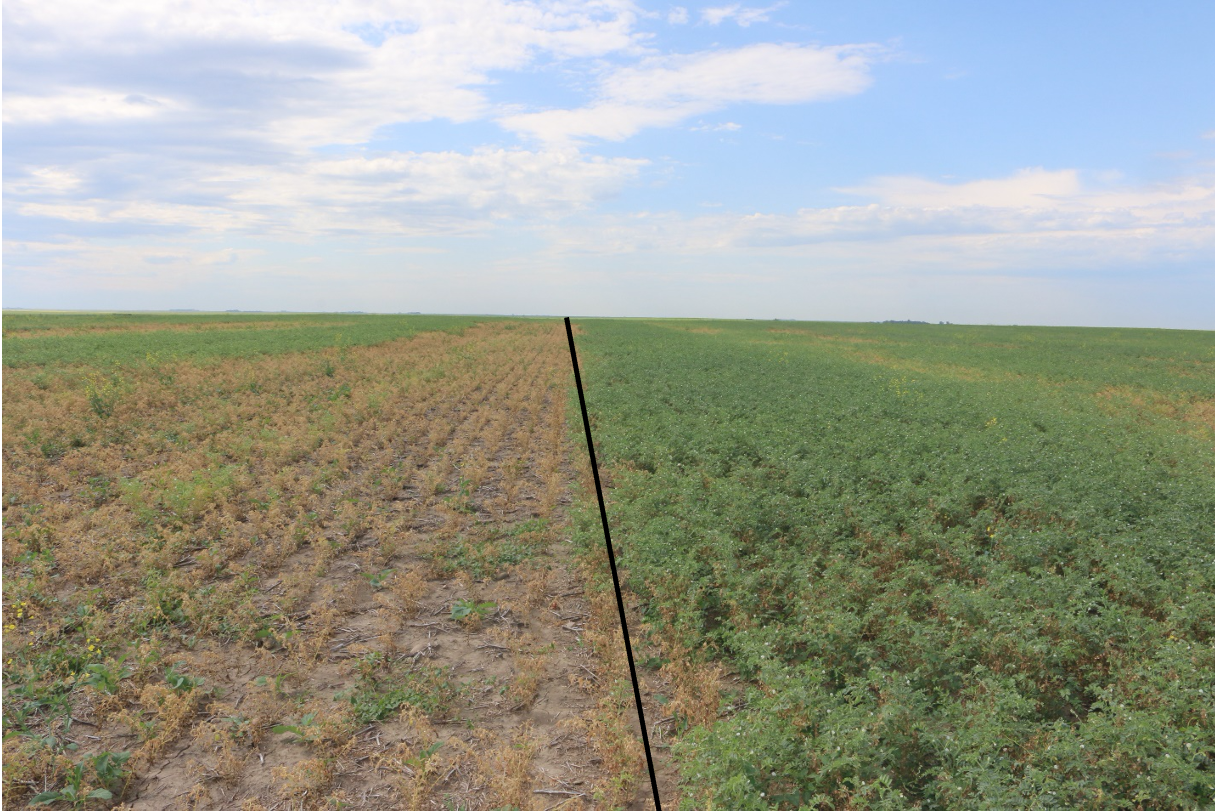
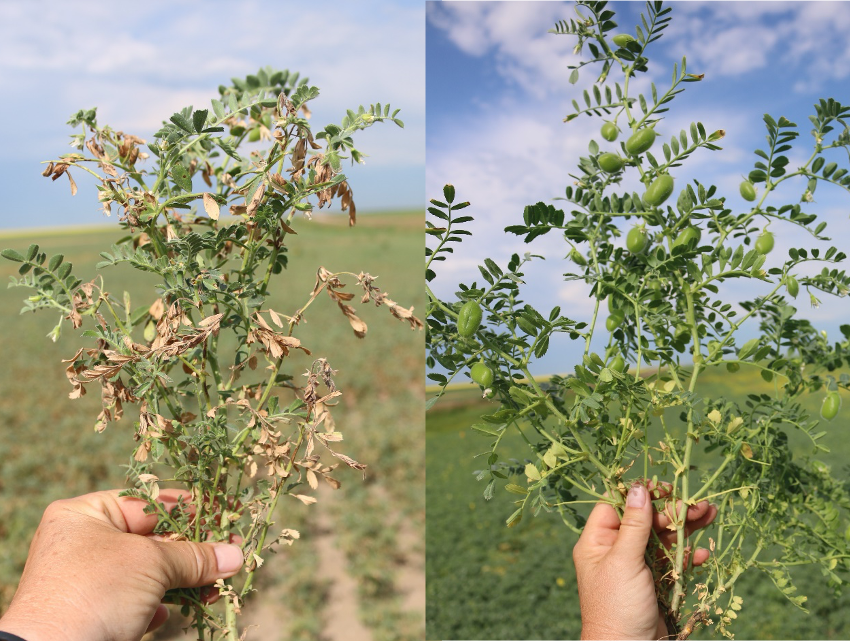
Chickpea fields in 2019 and 2020 showed unusual symptoms in early- to late-July across southern Saskatchewan during flowering/early podding. Initial symptoms started as wilting and chlorosis of the top growing point. In some cases the secondary growth in the leaf axils of the main branch was also wilted and chlorotic (Figures 1 and 2).
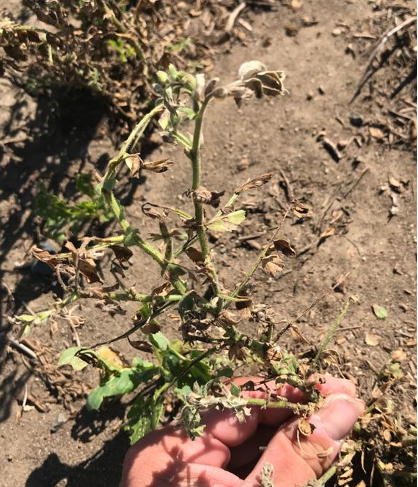
Source: Eric McPeek, Coronach.
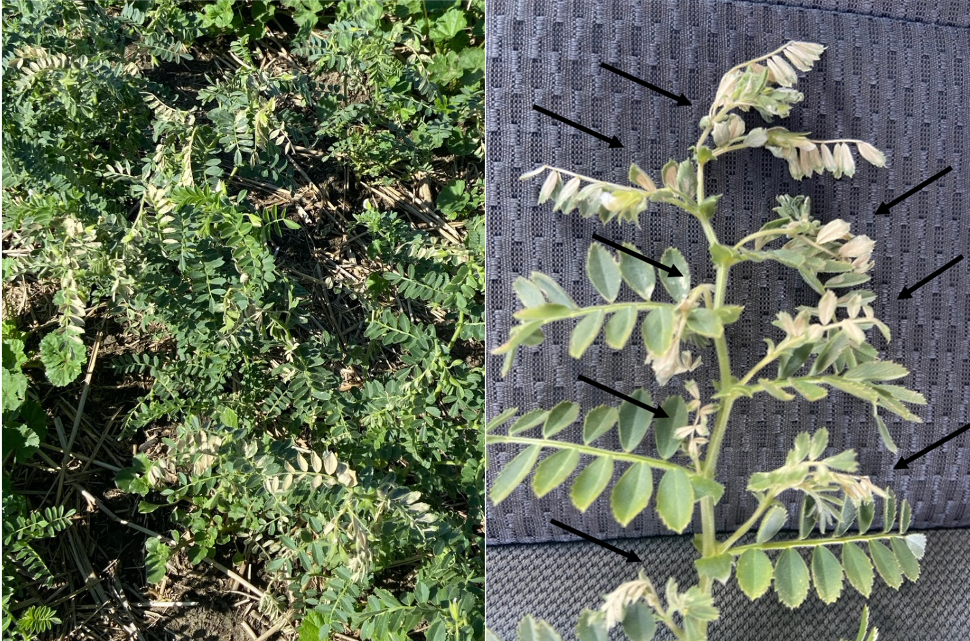
Source: Kelsey Hutchinson, 2020.
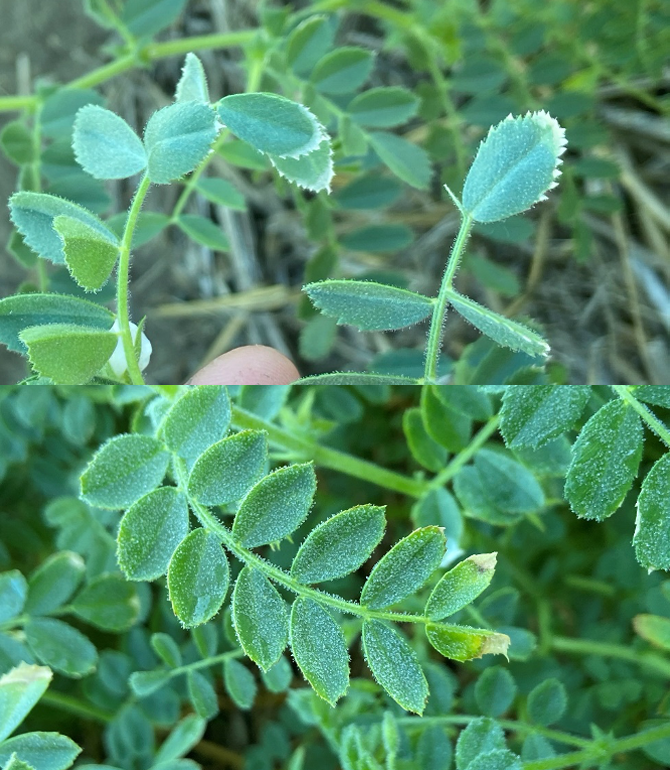
Source: Kelsey Hutchinson, 2020.
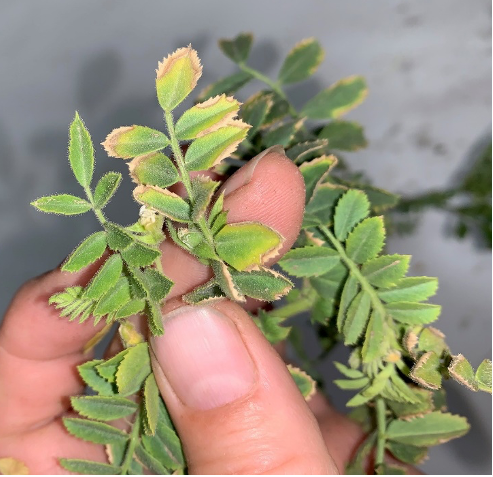
Source: Sherrilyn Phelps, SPG.
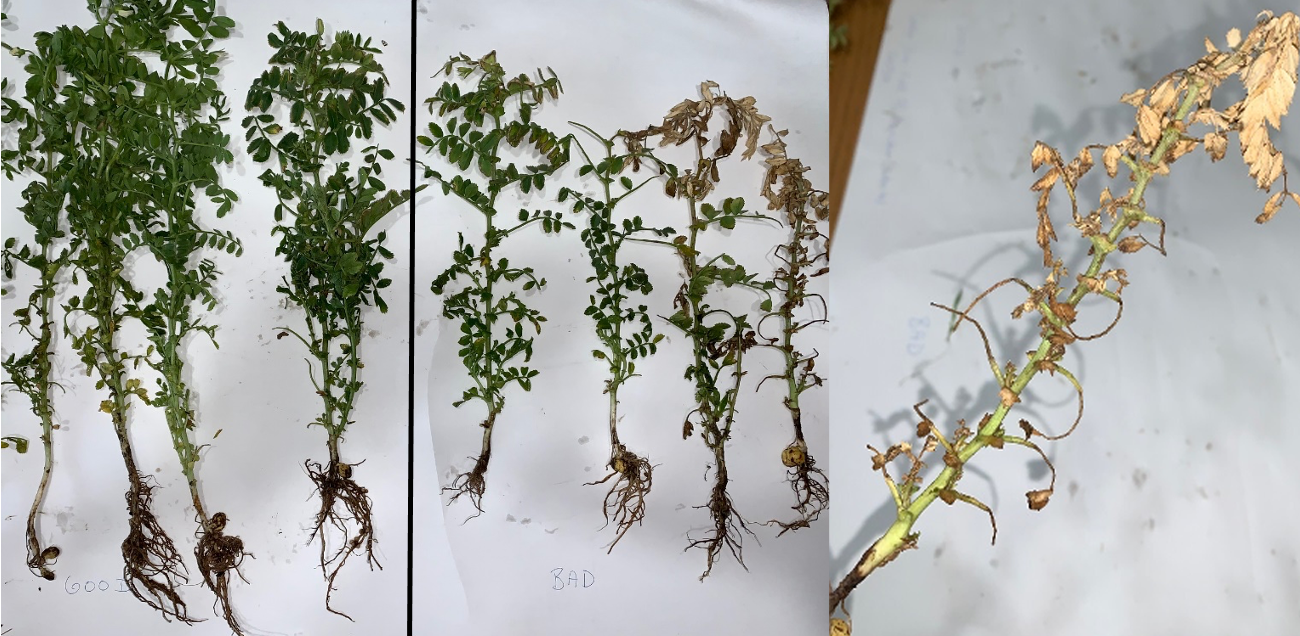
In some fields, plants also showed chlorosis and whitening of leaf margins (Figures 3 & 4), whitening in the centre of the leaves (Figure 5, left), or white spots on the leaves (Figure 5, right). Within 3-4 days of the onset of initial symptoms there was a general browning or necrosis of the plants (Figures 6 & 7), followed by an increase in Ascochyta blight symptoms in some fields. Over time, the affected tissues wilted, became dry, and fell off (referred to as tip die back and premature leaflet drop), which lessened the general browning in the affected areas, and within three weeks the plants regrew and reflowered, causing fields to look healthier.

Source: Kelsey Hutchinson (left); Sherrilyn Phelps, SPG (right).
Source: Sherrilyn Phelps, SPG.
Source: Sherrilyn Phelps, SPG.
Source: Sherrilyn Phelps, SPG.
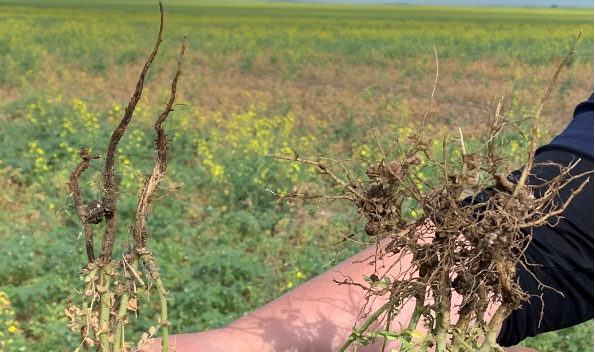
Affected plants had roots ranging from healthy to unhealthy and it was not consistent across the fields or within patches with above-ground symptoms. The unhealthy roots showed browning and minimal root hairs (Figure 8). A report of darkening in the areas of the stem just below soil surface was sometimes noticed just prior to above-ground symptoms appearing.
Nodulation ranged from healthy, active nodules to plants or fields where nodulation was limited or nodules were green. Agronomists reported some affected fields had non-functioning or green nodules, and the plants appeared to shut down for a period of time and abort flowers. A number of fields reported green nodules in the first three days when symptoms appeared but nodulation was not evaluated in every field at the time the symptoms appeared.
Further evaluation of roots in select fields showed infestations of what appeared to be insect larvae (Figure 9) emerging from nodules. Plant samples were delivered to the Crop Protection Laboratory in Regina. Dr. James Tansey with Saskatchewan Ministry of Agriculture isolated the insect larvae from several samples, determined that they were fly larvae, and shipped these to Sean Prager’s lab at the University of Saskatchewan. The Prager lab determined through DNA barcoding that the samples were a dark-winged fungus gnat (Sciaridae) Lycoriella sp. (Figure 9.A) and Delia platura, the seedcorn maggot (Figure 9.B). Lycoriella sp. were tunneling nodules. Members of this family typically consume fungus and some can be pests of commercial mushroom production.
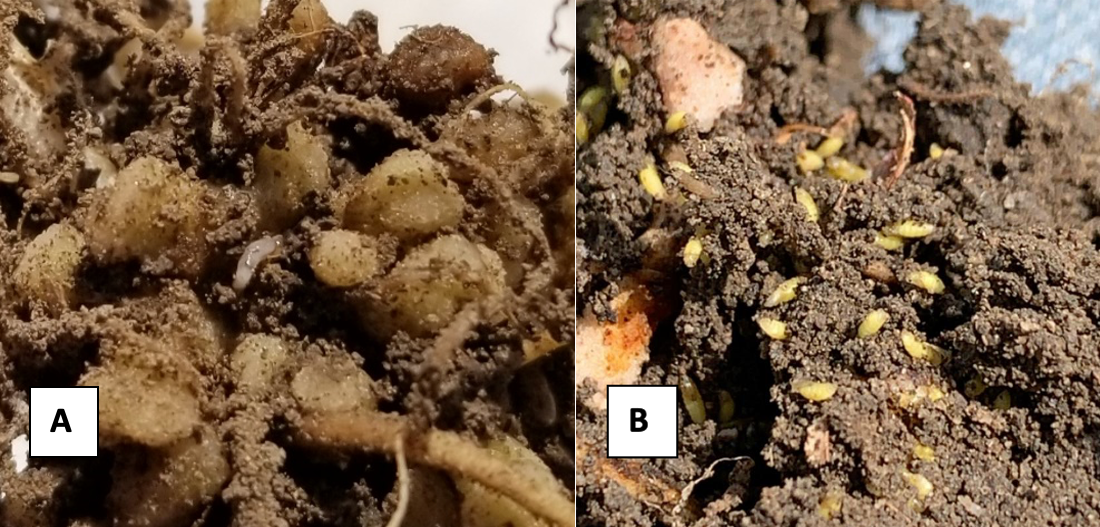
Source: A – Beth Truman; B – Allysa Attema.
Conditions on-site were wet in the fields where the insect larvae were found. Nodule tunneling indicates feeding. Seedcorn maggot is typically a pest of canola in Saskatchewan and the field was planted to canola the previous year. However, these insects have a broad host range. There was a mix of puparia and larvae on site. The sample was collected near the field margin. Although some cruciferous weeds (a more typical host) were present, the congregation of larvae in the photo suggests feeding on the crop.
Most fields with the health issue showed some signs of recovery, where the plants started regrowing and reflowering. The earlier symptoms and apparent plant shut-down resulted in delayed flowering and podding, and later maturity in some fields. There were varying degrees of regrowth on the plants, and affected plants later in the season would have 1-3 branches that were more upright, healthy, and flowering, whereas the rest of the plant was relatively unproductive.
As of August 14, 2020 the affected chickpea fields appeared healthy. Even though the fields did appear to come back, there were some pods within the plants that were empty. In some cases, the stands matured normally and, in other cases, maturity was delayed. In a majority of cases, yields were impacted but by varying degrees. Reports of 10 bushels per acre (bu/ac) were common in the affected fields, but yields were as high as 21 bu/ac in less severely affected fields.
Some agronomists noted that the earlier seeded fields were hit the hardest and were well into the podding stages at the time symptoms developed.
Environment
Prior to symptoms showing up in both 2019 and 2020, rainfall was limited in May and early June, followed by late June/early July rainfall events. Symptoms appeared mostly within 2-10 days after the rainfall events. High humidity following the rain events also occurred in 2019 and 2020. In some areas, the 2019 rain event occurred 10 days earlier than in 2020, so there were differences in the timing of the onset of symptoms. In 2019, there were wide swathes of hail and heavy wind and rain in late June/early July that preceded the symptoms. Near Coronach in 2019, there was 2 inches (in.) of rain in late June followed by 3 in. of rain in first week of July. Fields two miles away that missed both rains were unaffected and did not show any symptoms. In 2020, there were some areas with rains at the end of June and then a big rain event around July 9-11.
Locations
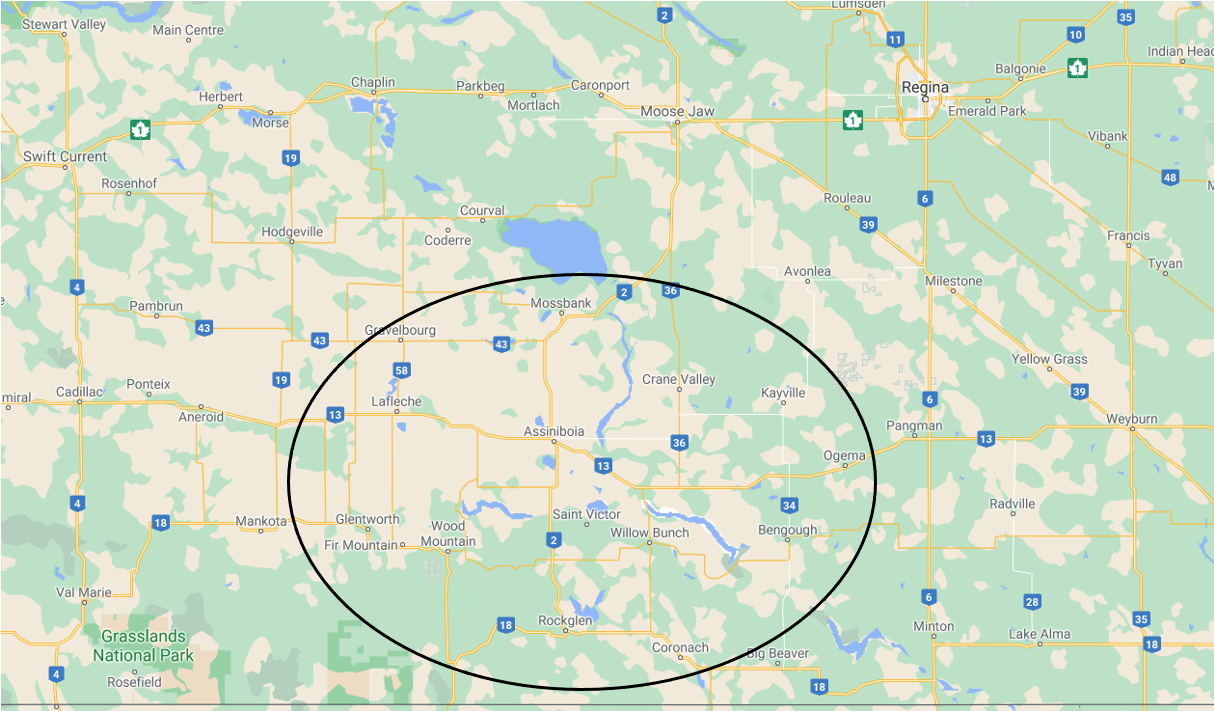
The fields most affected in 2020 were in the south central region of Saskatchewan (Figure 10). Areas most affected included areas near Coronach, Assiniboia, Mossbank, Verwood, Willow Bunch, Rockglen, and Avonlea. Affected fields or areas in fields were identified all the way from Weyburn to Moose Jaw and over to Swift Current. There seemed to be hot spots or heavily infected fields with less affected fields all within similar areas. Symptoms could also be found on select plants even in what appeared to be a healthy field.
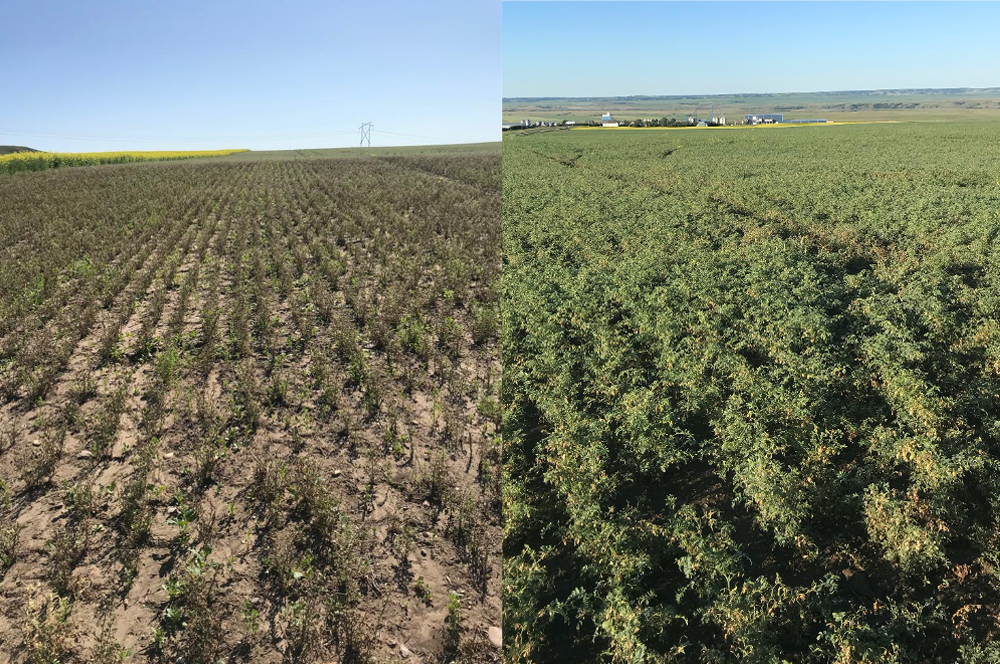
Source: Eric McPeek, Coronach (left), Angie Berner, Assiniboia (right).
Fungicide Applications
Observations around Moose Jaw suggested that fields with earlier fungicide applications were better in terms of overall health and lower Ascochyta blight.
Within fields, the disease incidence ranged from whole fields affected (Figure 11) to just localized areas (Figure 12), with some fields having symptoms associated with compacted areas, equipment tracks, knolls, or field entrances.

Source: Angie Berner, Assiniboia (left); Sherrilyn Phelps, SPG (right).
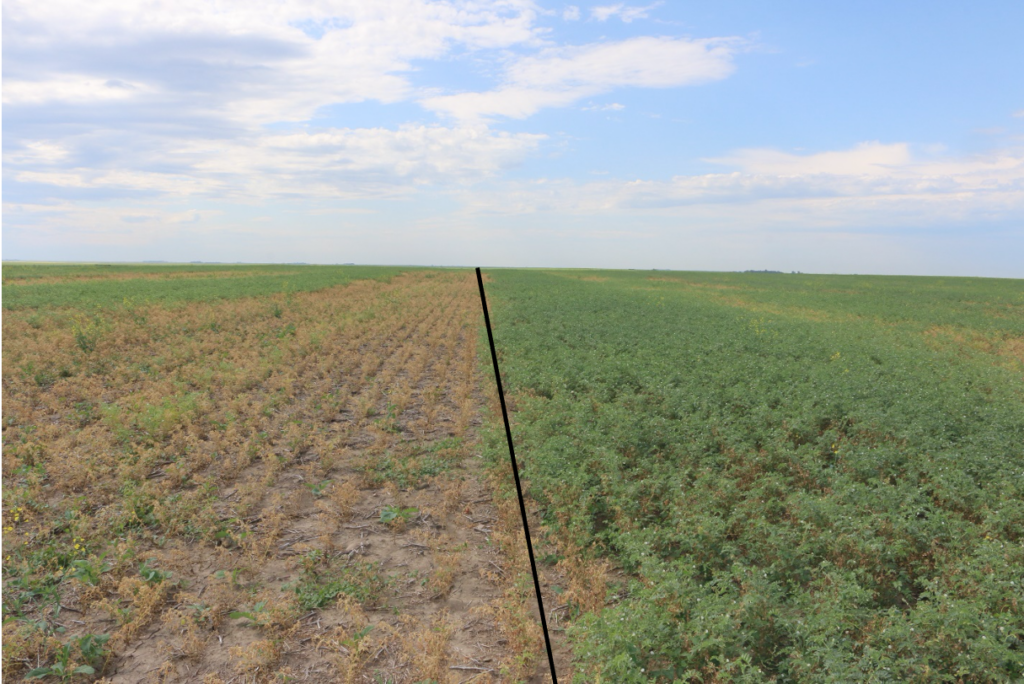
Source: Sherrilyn Phelps, SPG.
Variety
In 2019, the symptoms were mostly on CDC Orion and to a lesser extent in CDC Leader. Figure 13 shows a field where both varieties were grown in 2019 and depicts the increased health issue in the CDC Orion variety but symptoms are also present within the canopy of CDC Leader.
Acreage of CDC Orion was much higher than CDC Leader in 2019. In 2020, many growers switched to CDC Leader and symptoms appeared equally on both varieties. Symptoms were also found in Desi varieties.
Even though CDC Orion is later maturing than CDC Leader, CDC Orion flowers earlier than CDC Leader (50 days compared to 54 days to flower, respectively). This means CDC Orion may have reached a sensitive or susceptible stage earlier than CDC Leader. Differences in flowering were noted by agronomists as well, who suggested CDC Orion flowering at least four days earlier than CDC Leader. Early on, symptoms appeared mostly in CDC Orion but later in the season the symptoms were found in both varieties.
In 2019, fields near Mazenod/Palmer had the worst symptoms in CDC Orion but only had one rainfall event. In this area, CDC Orion averaged 10 bu/ac and CDC Leader 34 bu/ac, which lead to a switch in varieties for 2020 by many area growers.
Analysis to Date
1. Whole Plant Analysis for Herbicide Residues, Nutrient Levels, and Pathogens
Whole plant samples were gathered on July 20-22 and couriered to A&L Labs in London, Ontario for analysis of herbicide residues, foliar nutrient levels, foliar pathogens, and root pathogens. Samples were obtained from 16 fields. Separate samples of healthy and unhealthy plants were collected from eight of the fields. Samples with different symptoms from the same fields were collected separately. A total of 27 whole plant samples from 16 fields were sent in for evaluations.
a. Herbicide Residue Analysis
Herbicide residue screening consisted of taking samples of plant leaves, freezing in liquid nitrogen, then grinding and submitting to liquid chromatography–mass spectrometry. Herbicide analysis showed herbicide residues in most samples but the residues were not consistent with any one herbicide active. There were a couple of samples that showed herbicide residue from products that were not applied to the field. The lab said that the only contamination would happen when a sample with a very high level was tested and some residue may carry over to the following sample, which would result in very low levels detected in the second sample. The other option could be a couple samples being mixed up at any point during packing, unpacking, and testing. The lab confirmed that low numbers (1-2 parts per billion) are not enough to worry about and could be background levels.
The results from the herbicide residues analysis showed that neither any one active ingredient nor total residue levels differed between unhealthy and healthy samples. In the fields, 37% (seven fields) had levels of metribuzin in leaf tissue ranging from 3.9 to 286 parts per billion (ppb). In four out of five fields where there were healthy and unhealthy plants from the same field with metribuzin residues, the unhealthy plants had somewhat higher levels in tissues than the healthy plants. This suggests metribuzin could play a role in some fields. However, overall, various herbicide residues were found, including ethalfluralin (two fields), saflufenacil (five fields but at levels <2ppb), sulfentrazone (four fields), and trifluralin (four fields). The 16 fields have different herbicide use patterns but show similar symptomology in terms of the chickpea health issue, thus there is no one herbicide active that can be conclusively associated with the symptoms across all the fields. Herbicide residue can be a stress that adds to other stresses already encountered and may not be related to one specific product. In these fields it could also be that the unhealthy plants are less able to metabolize the herbicide(s) and therefore having residues present is not a cause but rather a result of poor chickpea health.
Table 1. Herbicide residue analysis and herbicide application history for fields tested in 2020.
| Sample # | Field # | Healthy vs Unhealthy | Symptoms | Herbicide Residues in Leaf Tissue (ppb) | Herbicide Applied | ||||||||||||||
| Ethalfluralin | Flumioxazin | Imazethapyr | Metribuzin | Quizalofop-p-ethyl | Saflufenacil | Sulfentrazone | Trifluralin | Ethalfluralin (Edge) | Flumioxazin (Valtera) | Imazethapyr (pursuit/odyssey) | Metribuzin (sencor) | Quizalofop-p-ethyl | Saflufenacil (heat) | Sulfentrazone (A or AS) | Trifluralin | ||||
| 1 | 1 | Unhealthy | wilting/chlorosis | – | – | – | 13.90 | 9.50 | – | 5.50 | – | x | x | ||||||
| 2 | 2 | Unhealthy | A = root unhealthy | – | – | – | – | – | – | 3.10 | – | not reported | |||||||
| 3 | 2 | Unhealthy | B = blighted branches | – | – | – | – | – | – | – | – | ||||||||
| 4 | 3 | Unhealthy | blighted branches | – | – | – | – | – | – | 2.70 | – | x | |||||||
| 5 | 4 | Unhealthy | A= wilting/tip die back | 7.50 | – | – | – | – | 2.50 | – | – | x | x | ||||||
| 6 | 4 | Unhealthy | B=leaf tip chlorosis | – | – | – | – | – | – | – | – | x | x | ||||||
| 7 | 5 | Healthy | N/A | – | – | – | – | – | – | – | – | x | |||||||
| 8 | 5 | Unhealthy | wilting/chlorosis | – | – | – | – | – | – | – | – | x | |||||||
| 9 | 6 | Healthy | N/A | – | – | – | – | – | – | – | – | x | |||||||
| 10 | 6 | Unhealthy | wilting/chlorosis | – | – | – | – | – | – | – | – | x | |||||||
| 11 | 7 | Healthy | N/A | – | – | – | 21.00 | – | 1.40 | – | 3.30 | x | x | x | x | ||||
| 12 | 7 | Unhealthy | wilting/chlorosis | – | – | – | 285.90 | – | 1.30 | – | 4.70 | x | x | x | x | ||||
| 13 | 8 | Unhealthy | wilting/chlorosis | – | – | – | – | – | – | – | – | x | x | ||||||
| 14 | 9 | Unhealthy | wilting/chlorosis | – | – | – | – | – | 1.60 | – | – | x | x | x | |||||
| 15 | 10 | Unhealthy | wilting/chlorosis | – | – | – | 4.80 | – | – | – | – | x | x | x | |||||
| 16 | 11 | Healthy | N/A | 12.30 | – | – | 40.50 | – | 1.30 | – | – | x | x | x | |||||
| 17 | 11 | Unhealthy | wilting/chlorosis | 17.30 | – | – | 15.50 | – | 1.80 | – | – | x | x | x | |||||
| 18 | 12 | Healthy | N/A | – | – | – | 3.90 | – | – | – | – | x | x | ||||||
| 19 | 12 | Unhealthy | wilting/chlorosis | – | – | – | 86.10 | – | – | – | – | x | x | ||||||
| 20 | 13 | Unhealthy | wilting/chlorosis | – | – | – | – | – | 1.00 | – | 8.70 | x | x | ||||||
| 21 | 14 | Healthy | N/A | – | – | – | – | – | – | – | 1.80 | x | x | ||||||
| 22 | 14 | Unhealthy | leaf tip chlorosis | – | – | 1.20 | – | – | – | – | 2.50 | x | x | ||||||
| 23 | 14 | Unhealthy | wilting/tip die back | – | – | 1.60 | 8.50 | – | – | 2.60 | – | x | x | ||||||
| 24 | 15 | Healthy | wilting/chlorosis | – | – | 1.40 | – | – | – | – | 1.90 | x | x | x | |||||
| 25 | 15 | Unhealthy | wilting/chlorosis | – | – | – | – | – | – | – | – | x | x | x | |||||
| 26 | 16 | Healthy | N/A | – | – | – | – | – | – | – | – | x | x | ||||||
| 27 | 16 | Unhealthy | wilting/chlorosis | – | – | – | 7.50 | – | – | – | – | x | x | ||||||
| detectable limit | 1 | 10 | 1 | 1 | 1 | 1 | 1 | 1 | |||||||||||
Table 2. Results of nutrient analysis of leaf tissue from samples taken in July 2020.
| Sample # | Field # | Healthy vs Unhealthy | Symptoms | Nutrient Analysis | |||||||||||||
| N | Nitrate N | S | P | K | Mg | Ca | Na | B | Zn | Mn | Fe | Cu | Al | ||||
| (%) | (ppm) | ||||||||||||||||
| 1 | 1 | Unhealthy | Wilting/chlorosis | 4.60 | 0.00 | 0.29 | 0.45 | 1.7 | 0.46 | 1.35 | 0.02 | 29 | 30 | 95 | 649 | 7 | 454 |
| 2 | 2 | Unhealthy | Root unhealthy | 2.75 | 0.01 | 0.14 | 0.14 | 0.6 | 0.18 | 0.64 | 0.01 | 16 | 21 | 78 | 986 | 5 | 767 |
| 3 | 2 | Unhealthy | Blighted branches | 4.55 | 0.01 | 0.23 | 0.41 | 1.9 | 0.38 | 1.29 | 0.02 | 24 | 48 | 167 | 3283 | 14 | 2200 |
| 4 | 3 | Unhealthy | Blighted branches | 4.05 | 0.00 | 0.23 | 0.40 | 1.5 | 0.34 | 1.30 | 0.01 | 22 | 44 | 110 | 1067 | 12 | 747 |
| 5 | 4 | Unhealthy | Wilting/tip die back | 3.16 | 0.00 | 0.31 | 0.36 | 1.5 | 0.33 | 1.27 | 0.02 | 21 | 42 | 98 | 689 | 11 | 550 |
| 6 | 4 | Unhealthy | Leaf tip chlorosis | 2.78 | 0.00 | 0.22 | 0.32 | 1.8 | 0.57 | 2.08 | 0.04 | 30 | 35 | 166 | 721 | 11 | 479 |
| 7 | 5 | Healthy | N/A | 3.32 | 0.00 | 0.21 | 0.41 | 1.8 | 0.41 | 1.21 | 0.03 | 21 | 46 | 108 | 291 | 14 | 167 |
| 8 | 5 | Unhealthy | Wilting/chlorosis | 4.17 | 0.00 | 0.25 | 0.44 | 1.8 | 0.39 | 1.11 | 0.02 | 24 | 44 | 91 | 389 | 14 | 232 |
| 9 | 6 | Healthy | N/A | 3.35 | 0.00 | 0.20 | 0.38 | 1.4 | 0.40 | 1.36 | 0.03 | 20 | 44 | 215 | 3305 | 14 | 2298 |
| 10 | 6 | Unhealthy | Wilting/chlorosis | 3.81 | 0.00 | 0.24 | 0.44 | 1.6 | 0.41 | 1.56 | 0.04 | 24 | 43 | 166 | 1268 | 12 | 863 |
| 11 | 7 | Healthy | N/A | 4.23 | 0.00 | 0.22 | 0.40 | 1.7 | 0.39 | 1.38 | 0.01 | 24 | 31 | 79 | 266 | 11 | 163 |
| 12 | 7 | Unhealthy | Wilting/chlorosis | 4.82 | 0.01 | 0.25 | 0.40 | 1.7 | 0.39 | 1.63 | 0.01 | 20 | 33 | 77 | 266 | 11 | 145 |
| 13 | 8 | Unhealthy | Wilting/chlorosis | 3.53 | 0.01 | 0.23 | 0.40 | 1.9 | 0.37 | 1.24 | 0.01 | 20 | 34 | 114 | 386 | 12 | 217 |
| 14 | 9 | Unhealthy | Wilting/chlorosis | 4.07 | 0.00 | 0.23 | 0.49 | 2.1 | 0.46 | 1.47 | 0.03 | 23 | 52 | 296 | 362 | 13 | 221 |
| 15 | 10 | Unhealthy | Wilting/chlorosis | 3.31 | 0.02 | 0.24 | 0.36 | 1.7 | 0.51 | 1.97 | 0.03 | 27 | 42 | 142 | 1783 | 12 | 1132 |
| 16 | 11 | Healthy | N/A | 3.63 | 0.01 | 0.23 | 0.36 | 1.9 | 0.39 | 1.40 | 0.04 | 22 | 32 | 68 | 893 | 11 | 848 |
| 17 | 11 | Unhealthy | Wilting/chlorosis | 3.88 | 0.01 | 0.25 | 0.38 | 1.6 | 0.44 | 1.74 | 0.01 | 20 | 35 | 52 | 389 | 9 | 212 |
| 18 | 12 | Healthy | N/A | 3.11 | 0.01 | 0.25 | 0.29 | 1.5 | 0.56 | 1.99 | 0.01 | 25 | 25 | 178 | 309 | 9 | 211 |
| 19 | 12 | Unhealthy | Wilting/chlorosis | 3.59 | 0.00 | 0.22 | 0.26 | 1.2 | 0.50 | 2.37 | 0.01 | 31 | 25 | 62 | 1004 | 10 | 656 |
| 20 | 13 | Unhealthy | Wilting/chlorosis | 4.07 | 0.01 | 0.27 | 0.43 | 1.7 | 0.41 | 1.90 | 0.09 | 35 | 43 | 206 | 2066 | 13 | 1349 |
| 21 | 14 | Healthy | N/A | 3.09 | 0.01 | 0.16 | 0.28 | 1.4 | 0.37 | 1.16 | 0.03 | 19 | 30 | 137 | 285 | 10 | 160 |
| 22 | 14 | Unhealthy | Leaf tip chlorosis | 1.72 | 0.00 | 0.13 | 0.19 | 1.3 | 0.42 | 2.08 | 0.01 | 24 | 24 | 303 | 402 | 7 | 259 |
| 23 | 14 | Unhealthy | Wilting/tip die back | 1.90 | 0.01 | 0.22 | 0.19 | 1.0 | 0.34 | 1.28 | 0.01 | 22 | 17 | 70 | 239 | 6 | 123 |
| 24 | 15 | Healthy | N/A | 4.51 | 0.01 | 0.30 | 0.56 | 2.4 | 0.41 | 1.41 | 0.03 | 23 | 35 | 73 | 396 | 12 | 265 |
| 25 | 15 | Unhealthy | Wilting/chlorosis | 4.51 | 0.01 | 0.27 | 0.49 | 2.4 | 0.38 | 1.27 | 0.01 | 22 | 35 | 74 | 594 | 9 | 495 |
| 26 | 16 | Healthy | N/A | 3.96 | 0.01 | 0.30 | 0.48 | 2.3 | 0.46 | 0.98 | 0.11 | 22 | 43 | 132 | 331 | 13 | 179 |
| 27 | 16 | Unhealthy | Wilting/chlorosis | 3.21 | 0.00 | 0.31 | 0.44 | 2.3 | 0.49 | 1.15 | 0.08 | 29 | 59 | 104 | 325 | 14 | 150 |
| Critical Levels based on vegetative growth stage | Normal range (low) / expected ratio | 4.80 | 0.20 | 0.32 | 2.4 | 0.37 | 0.50 | 0.01 | 20 | 20 | 35 | 30 | 7 | 1 | |||
| Normal range (high) | 5.50 | 0.35 | 0.42 | 3.2 | 0.42 | 0.75 | 0.03 | 50 | 50 | 50 | 100 | 20 | 300 | ||||
b. Nutrient Analysis
Results from plant nutrient analysis of leaf tissue are presented in Table 2. There were no differences between healthy and unhealthy samples for any of the nutrients measured. The values for the normal ranges and expected ratios were based on chickpeas in the vegetative stages as there was no data available for the reproductive stages. In discussions with Dr. Jeff Schoenau from the University of Saskatchewan, he suggested that although the numbers show low levels of nitrogen and potassium than expected for the later stage of development that the chickpeas were in (flowering/podding compared to vegetative), he would consider these values be acceptable.
For micronutrients, the lab analysis suggested excess amounts of iron (Fe) and manganese (Mn). However, Dr. Jeff Schoenau commented that for some elements, like Fe and Mn, high availability in the soil can result in the plant taking up and accumulating more than is required for its physiological functioning, thus having concentrations above the critical levels often occurs. The lab also suggested there may have been some soil contaminating the leaves due to entire plants being sent in and this could also cause higher values with some of the micronutrients. Review of the nutrient results by fertility experts did not suggest this as a main cause of the health issue.
c. Foliar and Root Pathogens
Disease screening was done by taking leaf or root samples, extracting the DNA and running them through polymerase chain reaction (PCR) tests with appropriate primers. Virus tests were done with enzyme- linked immunosorbent assay (ELISA). Results are in Table 3. Overall, no disease stood out as being present in unhealthy samples at significantly higher levels than in healthy samples. The overall disease load was slightly higher in unhealthy samples, but not to a significant degree.
Root pathogens tested for are all listed in Table 3 and show presence of Pseudomonas syringae, P. aeruginosa, Fusarium oxysporum, F. solani, F. redolens, and Pythium sp. Fusarium oxysporum and F. solani are known to be fairly aggressive in causing root rots in pulses. Fusarium redolens is often present but its aggressiveness on chickpeas is unknown. Pseudomonas species were tested for because P. syringae can infect chickpeas and P. aeruginosa was also suggested by an agronomist as material was found to show similar symptoms. Pythium is a common root rot pathogen and found in most Saskatchewan soils. With root rots it is often a combination of pathogens existing in a complex.
Foliar pathogens evaluated but showed negative test results in all samples are not shown in Table 3, and include: Sclerotinia sclerotiorum, Colletotrichum spp, Thielaviopsis basicola, and Verticilium dahlia. All samples tested positive for Ascochyta rabiei, which is not surprising as all fields had some visual symptoms of the disease. There were also Alternaria and Stemphylium species identified in a number of samples but not all fields.
Pseudomonas syringae was found in about 88% of healthy samples, and 37% of unhealthy samples, but when the abundance was considered, and samples in which P. syringae was not detected were counted as zeros, levels were similar between the two groups. P. syringae can cause foliar disease, with leaflet yellowing as a symptom. Drought stress can interact with P. syringae severity (Sinha et al. 2016 Frontiers in Plant Sci.).
Fusarium oxysporum was detected in 62.5% and 74 % of unhealthy and healthy samples, respectively, though, abundance was again similar between the two groups. F. oxysporum f. sp. ciceris can cause Fusarium wilt in chickpeas, but the fact that it is present in apparently healthy samples suggests it is not the main cause of the symptoms.
Alternaria alternata can cause Alternaria blight in chickpeas, as well as other pulses. Thus, A. alternata is not specific to chickpeas, but has been shown to increase if pulses are grown more often in rotation. However, Alternaria is unlikely to be contributing to the emerging chickpea health issues because 75% and 79% of healthy and unhealthy samples tested positive for this organism. The abundances were also similar between healthy and unhealthy samples.
Botrytis cinerea, which can cause grey mould in chickpeas, was rarely detected in both the healthy and unhealthy samples. Thus, it seems improbable that it contributed to the emerging health issue. In addition, the grey, fuzzy appearance that often comes with B. cinerea infection in humid conditions was not noted.
Cladosporium spp. were found in 50% and 52% of healthy and unhealthy samples, at similar levels of abundance. This group of fungi is sometimes associated with chickpea seed. Cladosporium is a saprotroph that can grow on wet decaying plant matter.
Viruses were also evaluated through ELISA and only a few had positive results. Negative results for Bean pod mottle, Beet western yellows, Cucumber mosaic, Poty, and Soybean mosaic viruses are not shown in Table 3. There were three samples that tested positive including one sample for Alfalfa mosaic virus and two for Lettuce mosaic and Peanut Stunt viruses. The ELISA sometimes is very hard to see colour change and the positive samples were not very strong signals (0.2) with level of detection of 0.1. It appears viruses can be ruled out as a general cause for the chickpea health issues as there were only very low levels of three different viruses in 3/27 samples.
Table 3. Disease and virus results from plant tissue samples taken July 2020.
| Sample # | Field # | Healthy vs Unhealthy | Symptoms | Pathogens Detected | ||||||||||||||||||
| Root | Foliar | Virus | ||||||||||||||||||||
| Pseudomonas syringae | Pseudomonas aeruginosa | Xanthomonas campestris | Aphanomyces euteiches | Fusarium oxysporum | Fusarium solani | Fusarium redolens | Rhizoctonia solani | Phytophthora spp. | Pythium spp. | Alternaria alternata | Ascochyta spp. | Botrytis cinereal | Cladosporium spp. | Stemphylium botryosum | Verticillium albo-atrum | Alfalfa mosaic | Lettuce mosaic | Peanut stunt | ||||
| 1 | 1 | Unhealthy | Wilting/chlorosis | 0.10 | 0.47 | – | – | 0.13 | 0.22 | 0.54 | 0.05 | – | – | 0.36 | 4.61 | – | – | 0.24 | – | – | – | – |
| 2 | 2 | Unhealthy | Root unhealthy | – | – | – | – | 0.10 | 0.82 | 0.73 | – | 0.59 | 0.17 | 0.37 | 5.27 | – | – | 0.05 | – | – | – | – |
| 3 | 2 | Unhealthy | Blighted branches | 0.61 | 0.14 | – | – | 0.07 | Low | 0.39 | – | – | 0.27 | 0.86 | 4.42 | 0.29 | 0.23 | 0.47 | – | – | – | – |
| 4 | 3 | Unhealthy | Blighted branches | 0.48 | 0.36 | – | – | 0.10 | 0.11 | 0.43 | – | – | 0.11 | 1.31 | 5.57 | – | 0.18 | 0.46 | – | – | – | – |
| 5 | 4 | Unhealthy | Wilting/tip die back | 0.58 | 0.78 | – | – | – | – | 0.18 | – | – | 0.25 | 0.36 | 2.04 | – | 0.21 | – | – | – | – | – |
| 6 | 4 | Unhealthy | Leaf tip chlorosis | – | 0.19 | – | – | – | 0.51 | 0.22 | – | – | 0.60 | 0.14 | 1.80 | 0.24 | 0.11 | 0.19 | 0.14 | – | – | – |
| 7 | 5 | Healthy | N/A | 0.48 | 0.32 | – | – | 0.15 | 0.11 | 0.52 | – | – | 0.46 | 0.67 | 2.56 | – | 0.18 | 0.38 | – | – | – | – |
| 8 | 5 | Unhealthy | Wilting/chlorosis | 1.39 | – | – | 0.10 | 0.54 | 0.77 | 0.34 | 0.41 | – | 0.36 | 0.76 | 3.61 | – | 0.14 | 0.44 | – | – | + | + |
| 9 | 6 | Healthy | N/A | 0.50 | 0.38 | – | – | – | – | 0.29 | – | – | 0.28 | 0.37 | 3.50 | – | 0.10 | 0.25 | – | – | – | – |
| 10 | 6 | Unhealthy | Wilting/chlorosis | 1.01 | 0.67 | 0.40 | – | – | 0.29 | – | 0.30 | – | 0.34 | 0.32 | 3.79 | – | 0.09 | 0.24 | 0.06 | – | + | + |
| 11 | 7 | Healthy | N/A | 0.13 | – | – | – | – | – | 0.47 | – | – | – | – | 1.68 | – | – | – | – | – | – | – |
| 12 | 7 | Unhealthy | Wilting/chlorosis | 0.16 | – | – | – | 0.14 | 0.36 | 0.37 | – | – | 0.15 | 0.33 | 1.55 | – | 0.17 | 0.23 | – | – | – | – |
| 13 | 8 | Unhealthy | Wilting/chlorosis | – | – | – | – | 0.18 | 0.43 | 0.65 | – | – | – | 0.52 | 5.58 | – | – | 0.13 | – | – | – | – |
| 14 | 9 | Unhealthy | Wilting/chlorosis | 0.27 | 0.13 | – | – | – | 0.14 | 0.64 | – | – | – | 0.09 | 3.63 | – | – | – | – | – | – | – |
| 15 | 10 | Unhealthy | Wilting/chlorosis | 0.22 | 0.50 | – | – | 0.29 | 0.36 | – | – | – | 0.29 | – | 3.25 | – | – | – | – | – | – | – |
| 16 | 11 | Healthy | N/A | 0.44 | 0.10 | – | – | 1.13 | 1.50 | 0.63 | – | – | 0.36 | 0.45 | 2.72 | – | 0.10 | 0.45 | – | – | – | – |
| 17 | 11 | Unhealthy | Wilting/chlorosis | 0.66 | – | – | – | 0.76 | 1.86 | 0.66 | 0.93 | – | 0.40 | 1.29 | 4.72 | 0.36 | 0.28 | 0.68 | – | – | – | – |
| 18 | 12 | Healthy | N/A | 0.46 | – | – | – | 0.36 | 0.59 | 0.55 | 0.17 | – | – | 0.45 | 3.04 | 0.17 | 0.12 | 0.69 | – | – | – | – |
| 19 | 12 | Unhealthy | Wilting/chlorosis | – | – | – | – | 0.69 | 1.44 | 0.55 | – | – | 0.60 | 0.70 | 3.16 | – | – | 0.12 | – | – | – | – |
| 20 | 13 | Unhealthy | Wilting/chlorosis | – | – | – | 0.12 | – | – | 0.13 | – | – | – | – | 1.11 | – | 0.11 | 0.20 | – | – | – | – |
| 21 | 14 | Healthy | N/A | – | 0.70 | – | – | 0.15 | 0.31 | 0.34 | – | – | – | – | 2.68 | – | – | – | – | – | – | – |
| 22 | 14 | Unhealthy | Leaf tip chlorosis | – | – | – | – | 0.18 | 0.39 | 0.49 | – | – | 0.22 | – | 2.79 | – | – | – | – | – | – | – |
| 23 | 14 | Unhealthy | Wilting/tip die back | – | 0.16 | – | – | 0.44 | 0.82 | 0.35 | – | – | 0.14 | – | 1.72 | – | – | – | – | – | – | – |
| 24 | 15 | Healthy | N/A | 0.42 | – | – | – | – | 0.15 | 0.36 | – | – | – | 0.26 | 3.58 | – | – | 0.12 | – | – | – | – |
| 25 | 15 | Unhealthy | Wilting/chlorosis | 0.75 | – | – | – | 0.10 | 0.25 | 0.54 | – | – | 0.10 | 0.58 | 2.77 | – | – | 0.25 | – | + | – | – |
| 26 | 16 | Healthy | N/A | 0.18 | 1.00 | – | – | 0.14 | 0.35 | 0.52 | – | – | 0.20 | 0.27 | 2.79 | – | – | 0.28 | – | – | – | – |
| 27 | 16 | Unhealthy | Wilting/chlorosis | 0.50 | 0.11 | – | – | 0.15 | 0.43 | 0.49 | – | – | 0.17 | 1.23 | 3.98 | – | 0.12 | 0.62 | – | – | – | – |
2. 2019 Plant Tissue Results from AAFC Swift Current
No differences in susceptibility to Ascochyta were found between CDC Leader and CDC Orion using one isolate of Ascochyta rabiei (Figure 14). CDC Leader trended towards slightly lower susceptibility based on a survey of Ascochyta blight in commercial fields in Saskatoon, led by Dr. Michelle Hubbard of AAFC, which is consistent with the lower disease rating in the Saskatchewan Seed Guide. The fields surveyed did not have the emerging health issue (Figure 15).
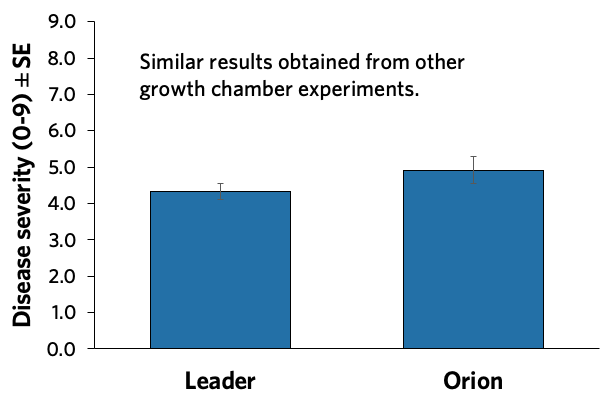
Source: Dr. Michelle Hubbard, AAFC Swift Current.

Source: Dr. Michelle Hubbard, AAFC Swift Current.
Analysis of weather patterns in 2019 showed heavier rainfall at Coronach and surrounding areas compared to other areas in Southwest and south central Saskatchewan (Figure 16).
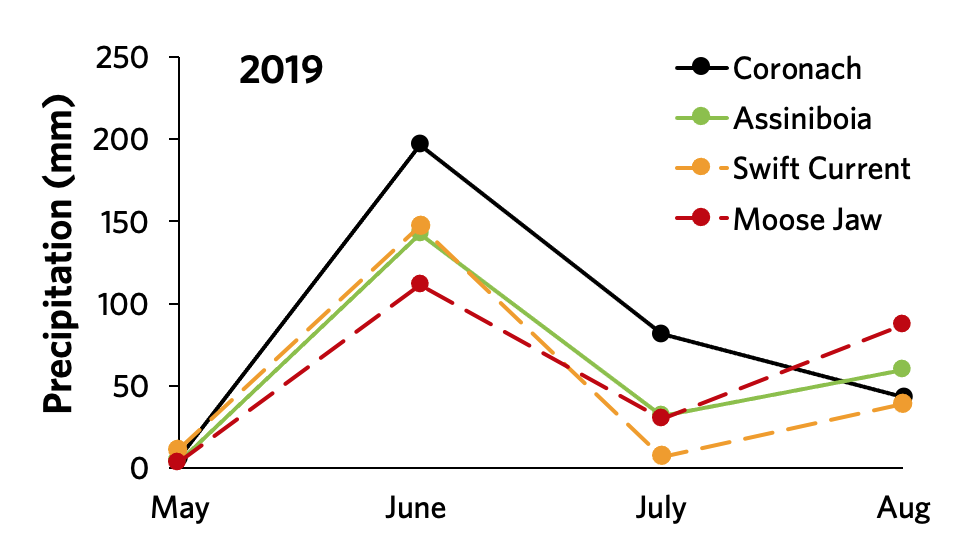
Source: Dr. Michelle Hubbard, AAFC Swift Current.
3. 2019 Root Results from the CDC at the University of Saskatchewan
Root samples from 2019 were brought to Dr. Sabine Banniza’s lab at the CDC, University of Saskatchewan where the samples showing visual symptoms (7 out of 18) were analyzed through microscopy and PCR primers, results of which are presented in Table 4. Samples were negative for Thielaviopsis basicola, Fusarium oxysporum f.sp. ciceri, Verticillium dahlia, V. albo-atrum, and Macrophomina phaseoline.
Fusarium solani and F. redolens were the most common pathogens found. For F. solani the primers were not specific for formae specialis. It is suspected that those positive F. solani are forma specialis pisi, which, despite its name, has a rather broad host range that includes chickpeas (Porter, L. D. et al. 2015. Plant Health Progress.). Three samples also tested positive for F. avenaceum.
Two samples tested positive for Phytophthora medicaginis but there were some doubts about the accuracy of primers. Sequencing was done on the two samples for confirmation. The first sample from field 27 (SP-13) showed high similarity with Phytophthora citricola and P. plurivors which are usually associated with woody plants and their rhizosphere, and are not in the same clade as P. medicaginis. The second sample sequenced from field 31 (TL-16) was highly similar to that of the P. medicaginis ex-type, with only one nucleotide difference. No closer matches were found. As the name indicates, P. medicaginis is a pathogen of alfalfa, but Dr. Biligetu, forage breeder at the CDC, did not think it was a common problem. Further surveys and pathogenicity testing will show which pathogens are most serious on chickpea roots.
Nematodes were also found in two samples (30 & 31) from southwest Saskatchewan. No further analysis of the nematodes were performed.
Table 4. Results from PCR analysis at the CDC/University of Saskatchewan.
| Sample ID from U of S Lab | Field (code from 2019) | Pathogen Presence (PCR Results: ‘+’ means band of expected size present; ‘-‘ means band absent) | ||||||||
| Thielaviopsis basicola | Fusarium redolens | Fusarium solani | Fusarium avenaceum | Fusarium oxysporum f. sp. Ciceri | Verticillium dahliae | Verticillium albo-atrum | Macrophomina phaseoline | Phytophthora medicaginis | ||
| 1 | 21 (SP-5) | – | + | + | – | – | – | – | – | – |
| 2 | 24 (SP-8) | – | + | – | – | – | – | – | – | – |
| 3 | 26 (SP-12) | – | + | + | + | – | – | – | – | – |
| 4 | 27 (SP-13) | – | + | + | – | – | – | – | – | + |
| 5 | 28 (SP-14) | – | + | + | – | – | – | – | – | + |
| 6 | 30 (TL-15) | – | + | + | + | – | – | – | – | + |
| 7 | 31 (TL-16) | – | + | + | + | – | – | – | – | + |
Further Evaluations Underway
In October, Saskatchewan Pulse Growers coordinated soil sample collection and shipping from various fields. These samples will be analyzed for soil microbiology (AAFC Saskatoon), nematodes (University of Manitoba), as well as soil potassium levels and electrical conductivity (University of Saskatchewan). The DNA from the plant tissue analysis was also obtained and sent to AAFC Saskatoon to be re-analyzed as part of the soil DNA testing. Evaluating the soil and plant DNA for microbial communities may shed some light on what is going on with the biology of these fields. Analysis of chickpea samples from summer field surveys for foliar (AAFC Swift Current) and root (CDC/University of Saskatchewan) diseases is also underway and will provide further information.
Acknowledgements
Sample collection and shipping by local agronomists and growers was greatly appreciated; the assistance of Angie Berner (Richardson), Carolyn Wilson (Syngenta), Kira Durston (Cargill), Kelsey Hutchinson (JMAS), Candace Robinson (Nutrien), Logan Skinner (Pioneer), Jana Warner (Hawks Agro), Eric Schick (Hawks Agro), Mel Leppa (Soils N Such), Dakota McLean (Nutrien), and Trent Richards (Director for SPG) were especially critical. SPG coordinated plant and soil sampling as well as provided funding for commercial lab analysis. SPG is also leading the Diagnostics Team to identify further testing and survey needs. Saskatchewan Ministry of Agriculture (SMA) provided expertise, Ascochyta blight survey coordination, and sampling as well as funding to related projects through the Agriculture Development Fund. Expertise from SMA is also greatly appreciated from James Tansy, Clark Brenzil, Dale Risula, and Barb Ziesman. Expertise on the Diagnostics Team and sample analysis by Dr. Michelle Hubbard (AAFC Swift Current), Dr. Sabine Banniza & Cheryl Cho (CDC/University of Saskatchewan); Dr. Shawn Sharpe (AAFC Saskatoon), Dr. Jeff Schoenau (University of Saskatchewan), Drs. Jennifer Town and Tim Dumonceaux (AAFC Saskatoon), and Dr. Mario Tenuta (University of Manitoba) have been crucial for the results to date and identifying the next steps.
