Soil testing is a fundamental component of a farm’s nutrient stewardship plan as it estimates nutrient availability in the soil. Although soil analysis does not provide an exact measurement of crop nutrient availability or uptake, it does provide a useful index of nutrients provided by the soil and potentially absorbed by the crop. In this way, soil test results inform fertility recommendations by helping to predict the probability of obtaining a profitable response to added nutrition, such as fertilizer.
Due to biological nitrogen (N) fixation and their ability to derive N from the atmosphere via a symbiotic relationship with crop specific Rhizobium species, most pulse crops rarely require supplementation of nitrogen fertilizer. Dry beans, which are poor N fixers, are an exception. However, even in absence of an N recommendation, soil testing before pulses can provide valuable information on other soil macro-and-micronutrients important for yield and quality. Soil testing results can also offer insights into spatial variability of soil properties across a field and be used to target site-specific management.
In order to use soil test information as the basis for nutrient recommendations it is imperative that results are representative of the field or field region being tested. Representative results can only be obtained through representative sampling and proper soil sampling methodology.
Sample Collection & Handling
When to Sample
Analysis of soil samples collected as close as possible to seeding often offers the most representative assessment of soil nutrient status prior to crop establishment and early-season demand. The closer the time of sampling is to crop utilization, the lower the risk of nutrient fluctuation due to transformations or losses. However, spring soil sampling is logistically challenging because of the narrow window of field access between spring thaw and seeding. Spring-collected soil samples also leave little time for turn-around of results and implementation of a corresponding crop nutrition plan. As such, post-harvest soil sampling in the fall is typically the most reliable agronomic strategy.
Ideally, soil temperatures should be consistently dropping with the preferred temperatures to be between 5 and 7°C. At these soil temperatures, soil microbial activity is minimal, and the risk of significant nutrient transformations is low.
If there is significant moisture accumulation and subsequent runoff between the time of sample collection in the fall and spring seeding, it may be warranted to resample in the spring to ensure that the soil residual nitrate-nitrogen (NO3-N) was not lost via leaching or denitrification under wet conditions. Other mobile nutrients such as sulphur (S) and chloride (Cl) may also fluctuate in response to wet conditions due to their ability to move with soil water.
Immobile nutrients such as phosphorus (P) and potassium (K) tend to be more stable from fall to spring. Although differences in soil test values of these nutrients will occur across sampling timings the fluctuations are typically small enough not to warrant changes in fertility plan providing the spring-collected sample is representative of the same soil sample collection methods originally employed in the previous fall.
However, it is important to note that all nutrient levels and soil pH can vary temporally, particularly throughout the growing season or when soils are especially moist and warm to stimulate microbial activity and certain nutrient transformations. If the desire is to track soil changes over time or year-over-year nutrient status it is crucial that samples are collected using the same methodology and at the same time each season.
Properly soil sampling and testing each field on an annual basis is recommended as best-management practice to optimize crop nutrition programs. However, if annual soil sampling of all fields is not feasible for a specific farm it is a better practice to soil sample a different cross section of fields every year. This approach still provides insight into soil nutrient levels without compromising sampling quality for sample quantity.
Sampling Tools
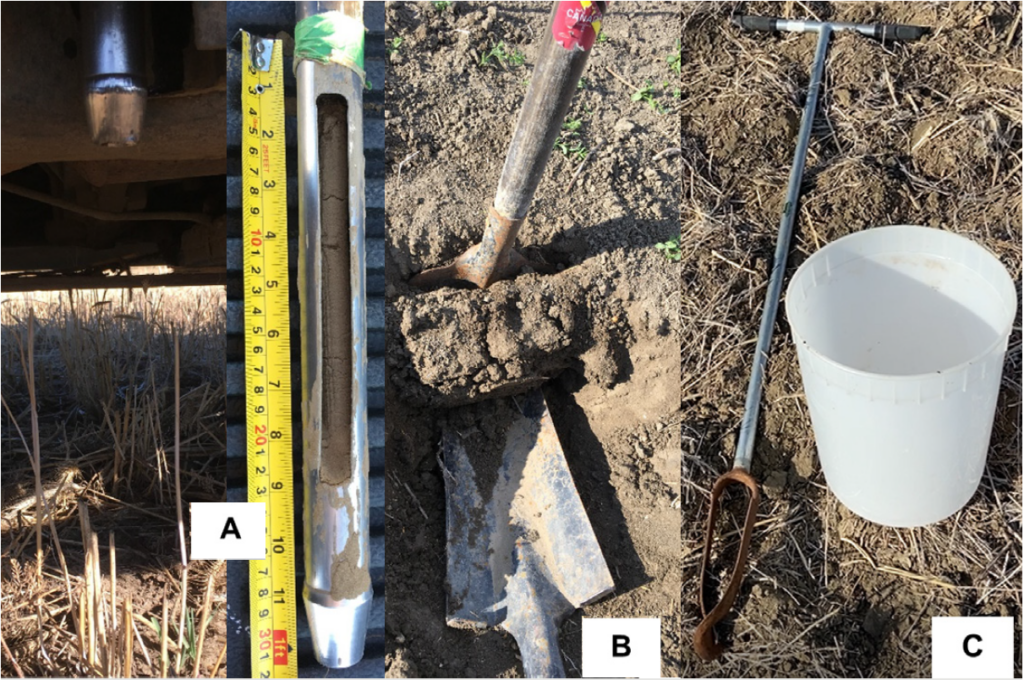
Soil sample collection can be facilitated by a wide range of tools including handheld soil probes, Dutch augers, truck-mounted soil probes, or even shovels. When used correctly, all options allow for representative soil sample collection, but some may be better suited to certain soil types, moisture conditions, or depths. For instance, a very precise core of soil can be collected using various soil probe tools. While these probes can be fitted with wet or dry tips to better accommodate various moisture conditions, a handheld soil probe can sometimes be inadequate in very dry conditions where sampling to appropriate depth is physically challenging. In these circumstances, or when deep sampling, a truck-mounted probe is a better alternative.
A standard shovel or field spade may not seem to be the most precise sampling tool, but it can be highly effective when trying to capture a slice of soil that encompasses both the seed or fertilizer band row and area in between. This sampling technique is advantageous in that it accounts for microscale variability. Despite the small distance between fertilizer band and inter-row spaces, the nutrient differences across this micro-zone can sometimes represent as much variability as across the entire field. This effect can be exacerbated in dry years where crop uptake of supplemental nutrition was lower and soil residual nutrients remaining in the fertilizer band are greater than typical.
Pending conditions at the time of sampling, extracting the sample from the probe may be challenging if the soil sticks to the sampling tools. To capture a full representative sample to the correct depth, the entire soil core needs to be obtained. Lubricants such as WD-40® or a vegetable-based cooking spray can be applied directly to the probe to create a protective film and prevent soils from sticking to the soil probe. Testing reveals that these two lubricants have a negligible effect on the sample analysis, with WD-40® having the lowest impact on micronutrient analysis between the two lubricant types.
Sampling containers used to hold the sample cores during collection should be clean and made of non-galvanized material. Clean sample collection containers will prevent contamination of the soil sample from foreign debris or substances which may alter the analysis and the use of non-galvanized material prevents the potential contamination of zinc (Zn) in the sample.
Depth
Recommendations for soil sampling depth vary by crop, field management, nutrient measurement, and growing region. However, it is generally accepted that the minimum sampling depth should be taken to the depth of tillage to capture the nutrient applications that have been incorporated into the tillage layer. Traditionally, this represents a depth increment of 0–6 inches (0–15 cm). The top six inches of the soil profile also tend to contain the highest proportion of nutrient-scavenging roots in most crop types and this region also represents the depth at which most soil test response research has been conducted for immobile nutrients in Western Canada. Fields that have been under continuous no-till management for a considerable period may also benefit from a shallower depth increment such as 0–4 inches (0–10 cm) to better capture stratification of pH and immobile nutrients in the uppermost soil profile. To fully assess stratification of nutrients samples should be collected at two inch increments from the surface depth.
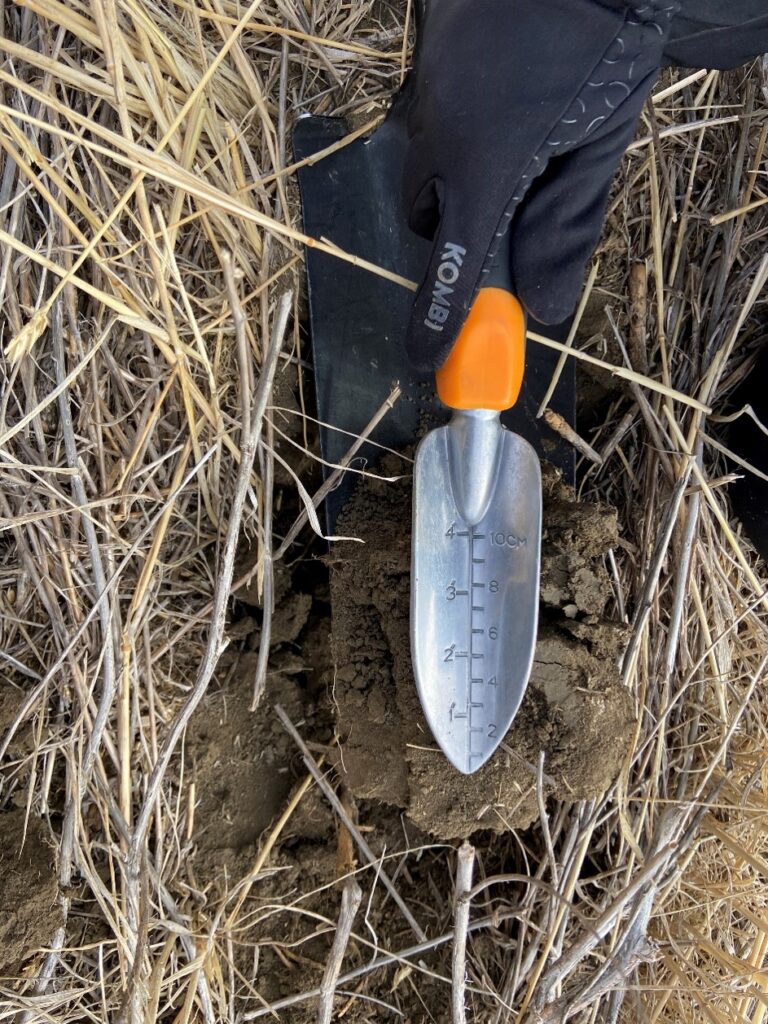
Figure 2: Soil sampling a cross-section of seed row to capture variability within and outside seed row using a shovel (Western Ag, 2021)
Soil from the shallowest sampling depth is eligible for analysis of all nutrients and is particularly important for immobile nutrients whose concentrations tend to diminish with increasing depth through the soil profile. A second or third sampling increment of 6–12 inch (15–30 cm) or 6–24 inch (15–60 cm), or 6–12 inch (15–30 cm) and 12–24 inch (30–60 cm) may be added to the soil sample protocol to better evaluate mobile nutrients at depth. Sampling to depths greater than 24 inch (60 cm) is generally reserved for research purposes and is a rare occurrence in commercial field testing.
Regardless of sample collection depth(s) it is vital to remain consistent across the field. If sampling in 0–6 and 6–12 inch increments, then each extracted sample needs to represent these specific depths. Combining multiple depth increments in one sample will skew the results. Furthermore, sampling depth is a necessary factor when converting nutrient concentration in parts per million (ppm) to lbs per acre (lbs ac-1).
An acre-furrow slice is the volume of soil in an acre to a depth of approximately 6 inches. The estimated average weight of soil in a 6-inch depth is 2,000,000 lbs. Therefore, soil nutrient concentrations measured in parts per million (ppm) can be converted to pounds per acre (lbs ac-1) values by multiplying the ppm nutrient concentration in each 6-inch increment by a factor of 2 or each 12-inchment by a factor of 4.
Number of Samples
It is nearly impossible to collect too many soil cores to comprise a sample, but too few is problematic. While there can be various sources of sampling error, one of the most common is submitting a soil sample based on an insufficient number of soil cores per field, management zone, or benchmark site. It is recommended to collect 20–30 cores per sampling region.
“Test the right pound of ground”– Les Henry, 2015
Typically, each soil sample sent to the laboratory for analysis only weighs 1-2 lbs. Within the that 1-2 lb bag of soil is a representation of millions of pounds of soil in the field depending on size of area sampled.
For example: A 160-acre field has an estimated 320 million pounds of soil in its top 6 inches. This is more than 145 metric tonnes of soil by weight. A 2 lb soil sample only represents about 6.25 x 10⁻⁹ percent of the entire field to a 6-inch depth.
Meaningful fertility recommendations are entirely dependent on obtaining soil samples that are representative of the field. Not only does the laboratory analyze only a small portion of the soil submitted, but the entire sample also represents only a fraction of the soil at a given depth in the field or field region.
Sample Packaging & Handling
Once sufficient soil sample cores have been collected and segmented by depth the next step in the soil sampling process is packaging. If correct sampling procedures have been employed, there should be more soil than is required to fill a lab-provided sample submission bag. Submission of a representative sub-sample relies on the soil cores being well mixed before packaging. Mixing helps to further homogenize the sample and ensure that components of all soil cores are being included in the final sample submission to the laboratory for analysis.
Before submitting soil samples to the laboratory, soil sample bags must be clearly labelled to identify the details of the sample including depth, field identification, and sample identification so they can be matched with the submission form. Each lab will have their own submission procedures, so it is important to understand the guidelines of the chosen laboratory.
Once extracted from the field, the samples should be kept cool and avoid temperature elevation that may stimulate microbial activity. This can be accomplished by storing them in a cooler while in transport from the field and then placing them in refrigerator upon returning from the field. If being stored for a longer period, the soil samples can be frozen.
Samples should be shipped to the laboratory as soon as possible after collection. Selecting shipping routes that avoids samples spending more than a couple of days in transit is important to ensure that the samples arrive at the lab in similar conditions as they were taken from the field. Samples shipped at the end of the week may not make it to the laboratory destination quickly enough and risk sitting on a warm delivery truck over the weekend.
Soil Sampling Methods
Random Composite
As its name suggests, random composite sampling combines several soil cores from random, but representative, areas of the field into a single composite sample. Although cores are randomly collected across an entire field, it is still important to avoid outlier areas such as saline patches, field edges, eroded knolls, or fence lines. Results from the analysis of this single composite sample are intended to provide an average set of soil test values for the whole field so the inclusion of soil cores from non-representative field areas could greatly skew the results.
Because this sample methodology inherently masks field variability, random composite sampling is best suited for relatively uniform fields. Even in fields with minimal topographical differences, soil characteristics and nutrient status can be highly variable and difficult to assess visually. As a result, sampling error and collection of an unrepresentative sample can be reasonably high in random composite sampling procedures.
Relative to other soil sampling methods, random composite collection generally requires less time and expense to execute, but with only one set of soil test values for the entire field unit, it also employs the lowest sampling intensity and provides the least amount of soil information per field.
Benchmark
Benchmark sampling protocols selects small regions, approximately a quarter acre in size, in the field to focus sample collection efforts. Within these benchmark areas 20–30 soil cores are collected at each targeted depth and composited for a single soil sample. This approach assumes a lower degree of variability and is less prone to sampling error than random sample collection across representative
areas of the entire field due to a more precise and consistent sampling location. Ideally, the benchmark location should be reflective of the most dominant production region. Large fields or those with a high degree of variability will benefit from more than a single benchmark site. Multiple benchmark sites may also serve to provide diagnostic insight through comparison of low and high yielding field areas.
The degree to which the soil test reflects the nutrient status of the field is highly dependent on the selection of the benchmark location. A benchmark location should not be selected at random as it is intended to serve as a long-term sample collection point for that field and should be returned to for sampling in future seasons using GPS coordinates. This method allows for the tracking of soil changes over time that is otherwise masked in a random composite sampling approach.
Aside from the initial selection of the benchmark locations, this soil sampling method often does not add a significant amount of time, labour, or cost. Although it is a more precise sampling approach, several benchmark locations across a field would be required to accurately apply a crop nutrition plan in a prescriptive manner.
Zone
Zone sampling is designed to capture soil differences across the field and, therefore, is well suited to fields with landscape and soil variability. Regions of the field sharing similar topography, soil properties, or crop potential are delineated into separate management zones which can be sampled individually using random composite or benchmark methods.
Several layers of data, such as normalized difference vegetation index (NDVI) or satellite imagery, topography, electrical conductivity (EC), and yield maps, can be used to inform the creation of specific management zones in a field. The caveat is that the data layers used to build the zones must reflect the properties of the field and be well-informed based on field management and agronomic history. Ground- truthing of the management zones ahead of soil sampling is a crucial factor when determining if the zone map accurately depicts the production and management responses across the field.
Collection and submission of samples on an individual management zone basis requires a higher cost and time investment but also allows for a higher resolution of soil test data. With a more accurate depiction of the range of nutrient levels in a field, a precision nutrient management plan can be implemented. Precision fertility programs can prescribe nutrients in varying rates, different nutrient types or sources and present potential opportunities for improved risk management, agronomic efficiencies, and environmental sustainability.
Site-Specific
Site-specific sampling methods rely on the collection of samples from georeferenced locations using GPS technology. Unlike benchmark sampling where a small field area is georeferenced, site-specific sampling aims to identify a more precise point and have multiple soil cores collected from a much smaller radius of that point. Typically, a high number of individual samples are collected and analyzed separately from points distributed on a 2.5–5 acre basis.
The sampling pattern may be set up as systematically where site- specific sampling points are established on pre-determined and equally spaced grid. This pattern is advantageous because it ensures equal representation of sampling across the field but unfortunately does not account for non-linear landscape differences and risks missing measurement of key soil areas by nature of where the grid is positioned. Alternatively, sampling points could be established on a grid equivalent which employs the same number of sampling points as determined by the size of the field but places the sample in a more variable pattern and in accordance with distribution of different management zones, landscape position, yield zones, or soil types.
This heighted sampling intensity can be much more costly and labour intensive relative to other soil sampling practices but allows for a much higher resolution of sampling information and the ability to capture spatial distribution of soil properties. Soil map layers created from this soil sampling approach can be used to build prescriptions for variable rate nutrient applications.
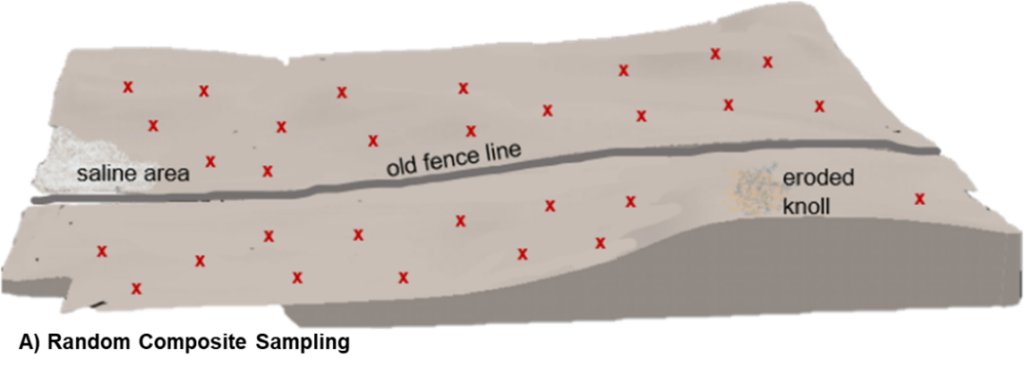
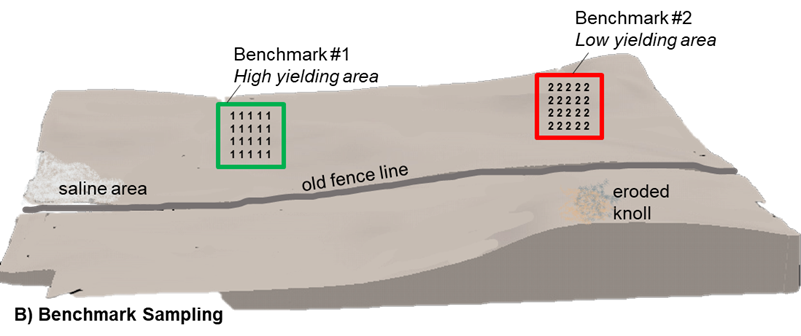
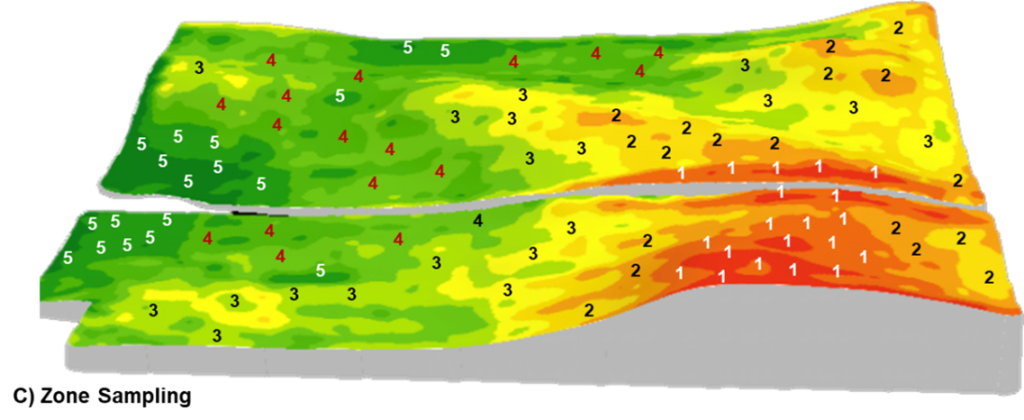
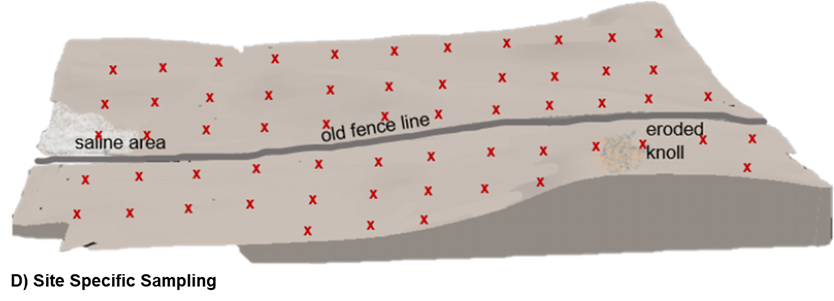
Figure 3: Diagrams illustrating various soil sampling methods.
A) Random Composite: each ‘x’ represents a collection site of an individual soil core from representative field areas. Cores are combined as one sample and analyzed together for an average assessment.
B) Benchmark: multiple soil cores are collected from a specific geo-referenced area of the field. Cores from each location are combined and analyzed as separate benchmark samples.
C) Zone: a field is divided into several management zones and samples are collected from each zone or combination of zones and analyzed by zone. This diagram illustrates SWAT (soil, water, and topography)-based management zones such that soil with similar soil-forming factors are grouped and analyzed together (Croptimistic Technology Inc., 2022).
D) Site-specific: a soil sample is collected at a precise, geo-referenced location with multiple samples across a field. This diagram shows site-specific on a systematic grid with soil samples collected and analyzed to represent every 2.5 acres of the field.
Soil Analysis
Procedures for soil analysis is a stand-alone topic. There are several different protocol options available to determine the nutrient content and properties of a soil. Generally, soil testing methods utilize chemical extractants to separate portions of nutrients in the same soil fraction or pool. These soil pools reflect nutrient differences in plant availability, solubility, and absorption. The specific chemical extractant used differs by the nutrient but there is often more than one extractant that can be used on a single nutrient. Conventional soil extractants also differ in their suitability to various soil types or pH status.
Plant Root Simulator (PRS®) probes are another analysis method for determining the supply of certain nutrients from the soil. Probes containing either positively or negatively charged ion resin membranes are used to measure ion supply of various nutrients. Unlike conventional soil extractions which generate a nutrient concentration value, the PRS® technology aims to simulate the “mechanism of nutrient uptake used by plant roots” through the attraction and adsorption of ions through electrostatic forces (Western Ag, 2022).
Understanding what extractant or procedure was utilized during soil testing is important for interpreting results. Not only do different laboratories utilize different extractants in their analysis, but they may also employ differences in the extractant procedure such as shaking time or concentrations which can also lead to discrepancies in final measurements even when the same extractant is used. Selecting a laboratory with analysis procedures calibrated to your area and consistently evaluating with the same lab will help ensure fertility recommendations are as accurate as possible. Despite the high standard for quality analysis at a variety of commercial soil testing labs, it is not recommended to directly compare results between laboratories or assume that lab-generated fertilizer recommendations are equivalent. Because different models can be used to interpret soil test results and provide fertilizer recommendations, it is advisable to develop a fertility plan in consultation with local agronomists who understand the growing environment, soil type, crop objectives, and management practices.
Key Messages
- Soil testing provides an index of nutrient availability but is not an exact measurement of plant uptake or crop requirement.
- Meaningful fertility recommendations are dependent on obtaining representative soil samples.
- Soil testing in the fall is an effective strategy for nutrient planning.
- Avoid sample collection from outlier areas (field edges, eroded knolls, saline spots, etc.) unless they are being analysed separately. Mixing cores from these regions may skew results.
- Ensure that samples are properly mixed, handled, stored, and shipped as these factors will impact results.
- Ensure that enough cores are taken from each sample spot and each sample depth.
- Comparisons of soil trends in a field are only accurate with georeferenced sample collection methods such as benchmark or site-specific.
- There are many different soil sampling methods to choose from. Be sure to match the sampling intensity with field variability and select the method best suited to the objectives of your nutrient management.
- Long-term soil sampling programs should be consistent with sample timing, collection methods, laboratory, and analysis procedures.