Checking plant densities can be a helpful tool to see if the current year’s seeding rates were calculated correctly and close to the target plants per dimension. It can also guide decisions made for the following year based on seeding rates. Table 1 was created based on the measurement of 16.5 feet by 2,640 feet, which accounts to one acre.
Table 1. Target plants per dimension of row based on various crops and different row spacing.
| Crop | 8’’ | 10’’ | 12’’ | 14’’ | |
|---|---|---|---|---|---|
| Target plants/ft2 | Target plants per foot of row | ||||
| Peas | 8 | 5.3 | 6.7 | 8 | 9.3 |
| Lentils | 12 | 8 | 10 | 12 | 14 |
| Chickpeas – Kabuli | 3 | 2 | 2.5 | 3 | 3.5 |
| Chickpeas – Desi | 4 | 2.7 | 3.3 | 4 | 4.7 |
| Fenugreek | 12 | 8 | 10 | 12 | 14 |
| Faba Beans | 4 | 2.7 | 3.3 | 4 | 4.7 |
| Target plants/m2 | Target plants per metre of row | ||||
| Peas | 85 | 17 | 21.25 | 25.5 | 29.75 |
| Lentils | 130 | 26 | 32.5 | 39 | 45.5 |
| Chickpeas – Kabuli | 33 | 6.6 | 8.25 | 9.9 | 11.55 |
| Chickpeas – Desi | 44 | 8.8 | 11 | 13.2 | 15.4 |
| Fenugreek | 130 | 26 | 32.5 | 39 | 45.5 |
| Faba Beans | 44 | 8.8 | 11 | 13.2 | 15.4 |
| Target plants/yd2 | Target plants per yard of row | ||||
| Peas | 72 | 16 | 20 | 24 | 28 |
| Lentils | 108 | 24 | 30 | 36 | 42 |
| Chickpeas – Kabuli | 27 | 6 | 7.5 | 9 | 10.5 |
| Chickpeas – Desi | 36 | 8 | 10 | 12 | 14 |
| Fenugreek | 108 | 24 | 30 | 36 | 42 |
| Faba Beans | 36 | 8 | 10 | 12 | 14 |
Interpreting the Table
The first step is to distinguish what type of crop and what row spacing is present in the field. Next, decide which measurement is going to be utilized (feet or metres). Once these three factors are determined, matching up the designated crop row going sideways and inch row spacing column going up and down on the table will give you the target plants per distance of row. It is recommended to check a few rows within a seeding pass to evaluate the consistency of the seeder, as well as to check various parts of the field to see if the field is cohesive. Landscape position and soil variability across the field can impact seedling survivability, so it is worthwhile to note which regions have plant stands falling outside of the optimal target range. It is important to evaluate plant densities beyond the headlands which are unlikely to be representative of the entire field.
Impact of Plant Stand
Checking plant density in a field can identify if the density is too high, too low, or just right. If the density is too high, problems may arise later in the season in terms of increased risk of disease as a result of a denser canopy. Timely fungicide applications will be important. Higher densities can have a benefit for increased plant competition for water, nutrients, and light. This can be a good thing in terms of weed competition. If the density is too low, weeds may have a better chance of thriving due to the smaller canopy, so additional herbicide applications may be needed. The lower plant density may also restrict the yield potential as pulses are not able to compensate by producing bigger plants to the same extent as some other crops, such as hybrid canola. Although having too many or too few plants in the rows can have negative effects, adjusting seeding rates the following year can help optimize plant density. Overall, ensuring the correct target plant density is reached can have many positive effects on plant health, soil health, and crop yield.
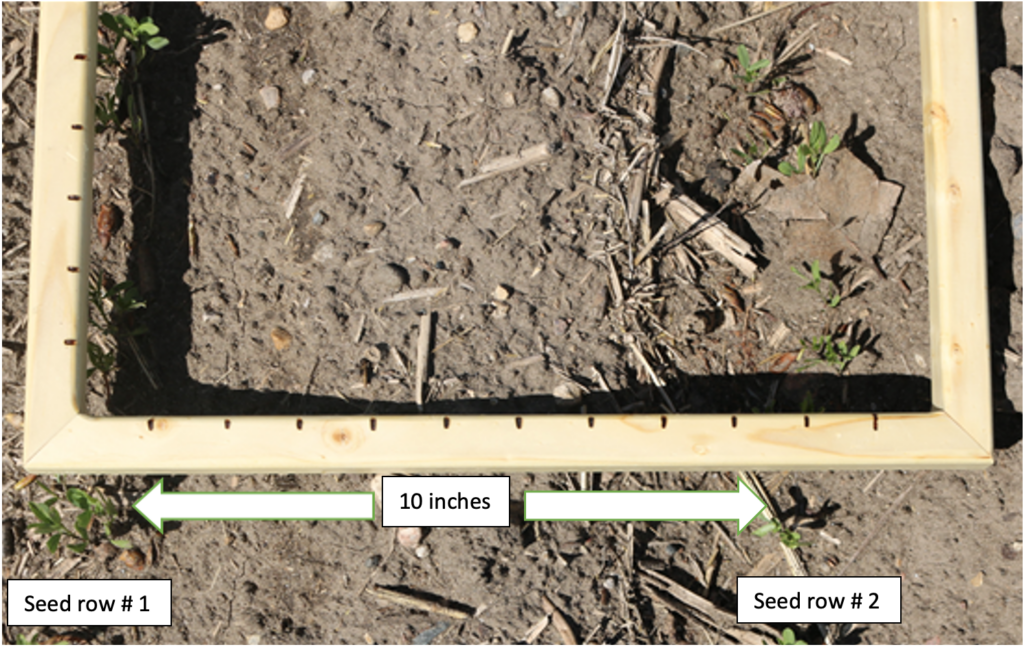
Plant density field example (not to scale):

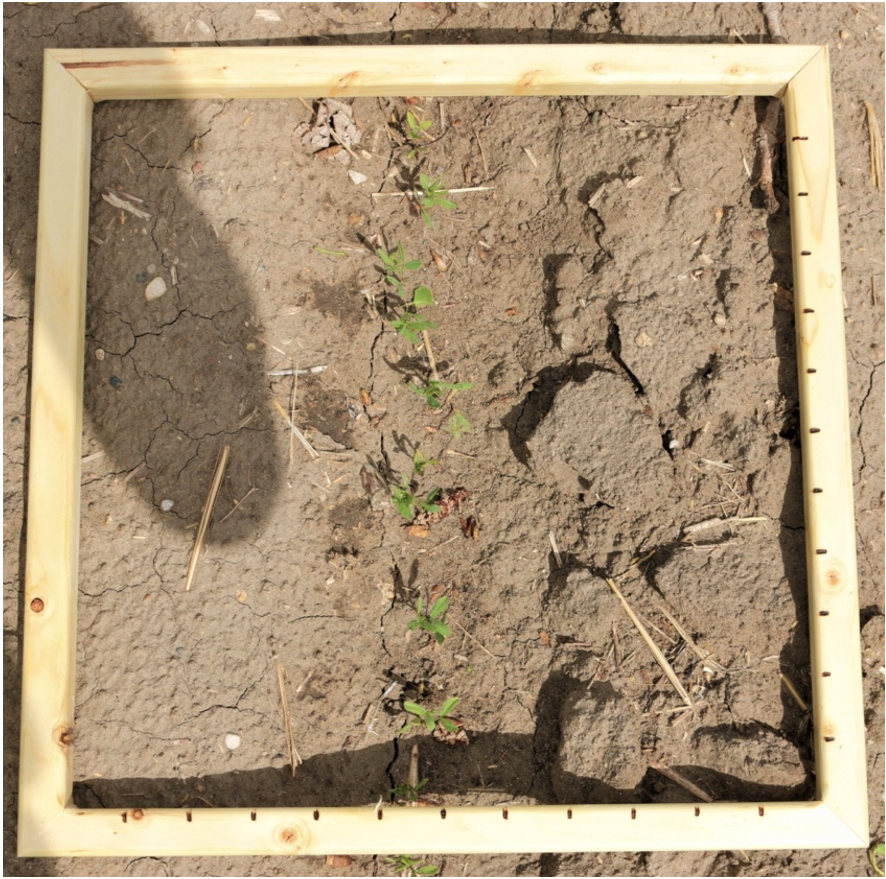
Plant density picture example:
This example includes a lentil crop seeded with 10-inch row spacing. The measurement tool being used is a 1×1 foot square.
- The row spacing was determined by placing the measurement tool near the middle of the plants in each row to find how many inches are in between the rows.
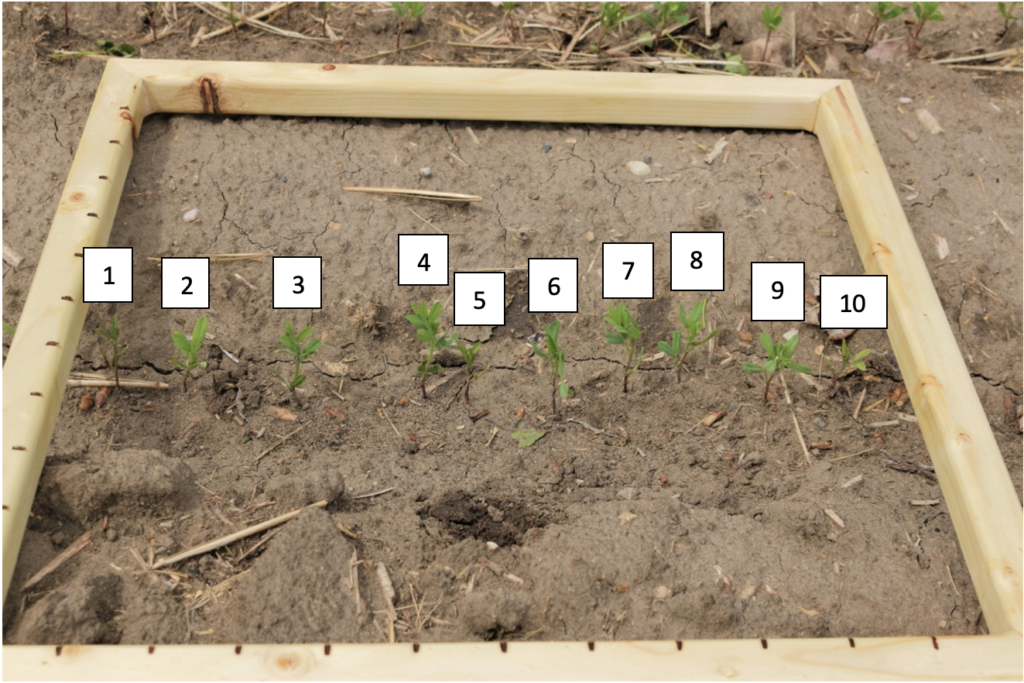
- Next, the square was placed on the seed row with the seedlings in the middle and the plants were counted. It was found that there were 10 plants in one square foot, which is the correct number of lentils that should be present in a field with 10-inch row spacing.
- This process was repeated several times in multiple field locations to obtain an average plant stand density across the field.