Evaluation of root rot severity on prairie seed guide pea varieties in three Western Canadian nurseries over two years
Tom Warkentin1, Kishore Gali1, Tadesse Gela1, Ahmed Abdelmagid2, and Syama Chatterton3
1Crop Development Centre, University of Saskatchewan
2Agriculture and Agri-Food Canada, Morden, Manitoba
3Agriculture and Agri-Food Canada, Lethbridge, Alberta
Rationale
Pea breeders in Canada and internationally are aiming to develop varieties with improved root rot resistance. As root rot is a disease complex, with only partial resistance available to most of the individual pathogens, breeding for resistance is a major challenge. In the meantime, this project aimed to quantify the root rot resistance in existing pea varieties to allow producers to make informed decisions.
Objective
To evaluate root rot severity on prairie seed guide pea varieties in replicated field trials over two years and three root rot nurseries in Western Canada.
Methods
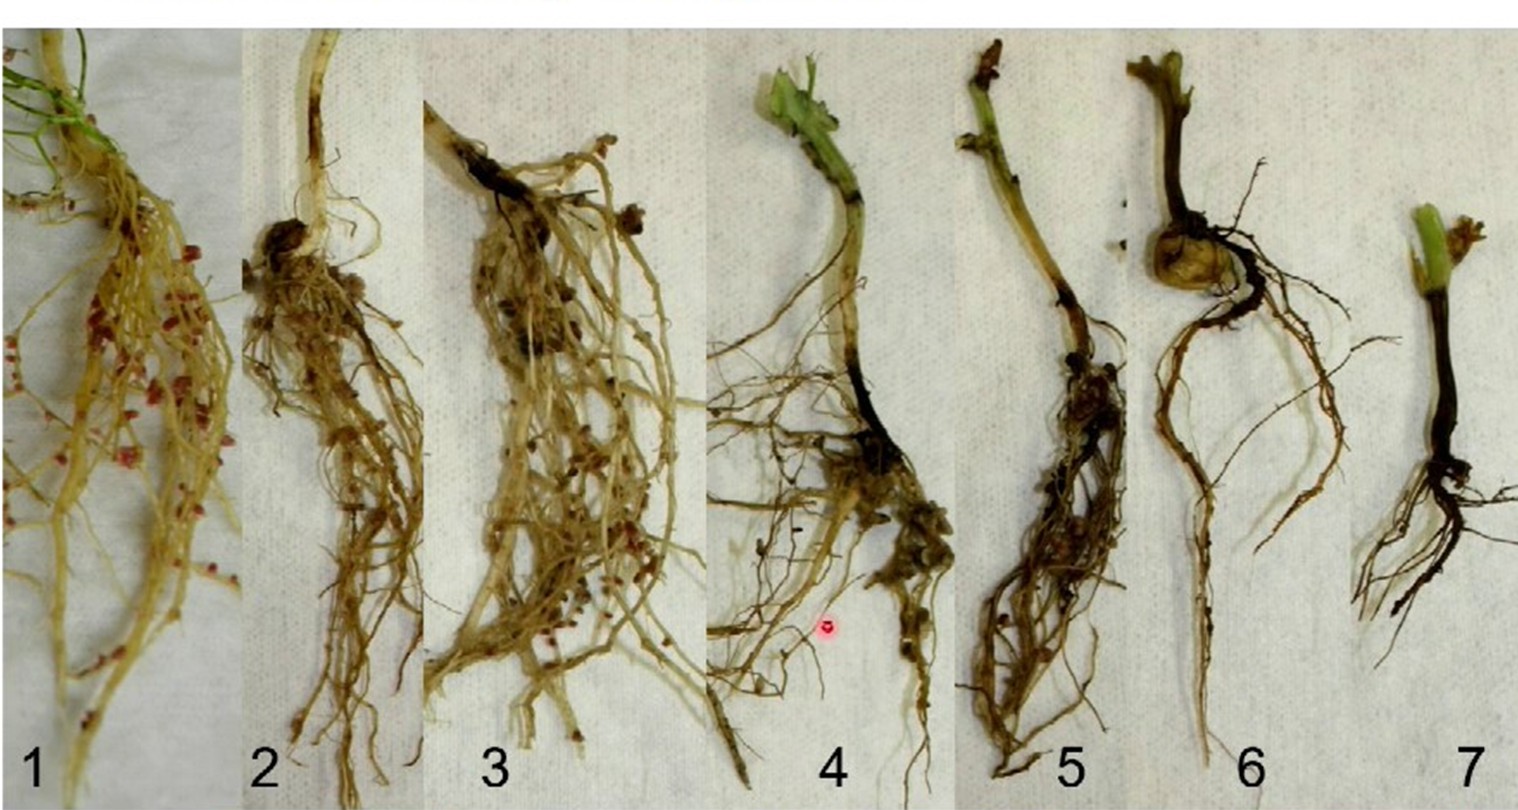
Over the 2024 and 2025 summer cropping seasons, 56 pea varieties from the three prairie seed guides representing essentially all varieties available for production in Western Canada were evaluated in replicated field trials. These trials were conducted in root rot nurseries at three locations: AAFC-Lethbridge, AAFC-Morden, and USask-Saskatoon. Varieties were planted in single-row plots (1.4 m in length with 30 cm between rows) with three replications. Standard agronomic practices for pea field trials in Western Canada were followed for land preparation, planting, and weed control. Irrigation was applied to promote root rot development. For disease assessment, up to 10 plants per plot were carefully excavated approximately five weeks after planting. Roots were washed and rated for root rot disease severity on a 1-7 scale, where 1 = no symptoms and 7 = complete plant mortality (Fig. 1). The disease severity ratings for each plot were converted to a disease severity index (DSI) by summing the product of the number of plants in each category by each disease rating category, dividing by the product of the total number of plants rated and the maximum disease scale, and multiplying by 100. The data were analyzed using the mixed model procedure in SAS 9.4.
Results
Fifty-six commercially available pea varieties were evaluated over two years in root rot nurseries at AAFC-Lethbridge, University of Saskatchewan, and AAFC-Morden. Root rot severity was moderately high at all sites, with moderate variation observed among locations and years, which is likely mainly attributable to differences in time of root rot assessment.
Each of the three prairie root rot nurseries contained multiple root rot pathogens. Aphanomyces euteiches was the most common pathogen in each nursery. After Aphanomyces, the nurseries contained varying levels of several Fusarium species including F. avenaceum, F. solani, F. acuminatum, F. oxysporum, F. redolens, and other minor root rot pathogens such as Didymella pinodella.
The 56 varieties differed significantly in their root rot score in the combined analysis of the six station-years. The mean root rot disease severity index (DSI) for each location over the two years ranged from 63.8–95.7% in Lethbridge, 59.0–78.6% in Saskatoon, and 55.0–80.9% in Morden. Significant differences (p < 0.05) were observed among varieties at all locations (Table 1). The overall mean DSI across all varieties and locations was 73.9%, with individual cultivar means ranging from 62.3% to 81.1%. The coefficient of variation (CV) for DSI was acceptable at each of the six station-years supporting the reliability of the trials.
PI 660729 and PI 660736 are sources of partial resistance to Aphanomyces used by plant breeders (McGee et al., 2012). These two varieties had the lowest mean DSI of the 56 varieties, with their average score being 63.3% (Table 1). Nine Western Canadian varieties (CDC Rider, CDC Canuck, CDC 6482-4, AAC Planet, AAC Lorlie, Boost, CDC Dakota, CDC Blazer, and CDC Forest) had mean DSI within the LSD of these partially resistant checks.
Conclusion
This trial assessed the root rot score of the commercially available pea cultivars in Western Canada in three dedicated pea root rot nurseries over two growing seasons. Reliable data were obtained from all six trials. Varieties were ranked for their mean overall disease severity index, and these data can be utilized by growers in variety selection if root rot is a major consideration in their region. Varieties purposely-bred for improved root rot resistance are expected to be commercialized in Western Canada in the coming years. These varieties are expected to have lower disease severity index than the best of the varieties currently available.
Table 1. Mean root rot disease severity index (DSI %) of 56 pea varieties evaluated across three locations (SA: Saskatoon, MO: Morden, and LE: Lethbridge) in 2024 and 2025. Varieties are ranked from lowest DSI to highest DSI overall mean. The table includes the coefficient of variation (CV), significance levels (p < 0.05), and least significant difference (LSD) for each environment, as well as the annual mean and overall mean.
| Variety | Root rot (RR) Disease Severity Index (DSI %) | ||||||||
| 2024 | 2025 | Overall Mean | |||||||
| SA | MO | LE | Mean | SA | MO | LE | Mean | ||
| PI 660736 check | 86 | 50 | 63 | 66 | 47 | 63 | 65 | 58 | 62.3 |
| PI 660729 check | 81 | 41 | 51 | 58 | 48 | 69 | 95 | 71 | 64.2 |
| CDC Rider | 80 | 55 | 78 | 71 | 59 | 72 | 87 | 63 | 67.1 |
| CDC Canuck | 82 | 55 | 83 | 74 | 52 | 74 | 96 | 63 | 68.6 |
| CDC 6482-4 | 80 | 66 | 78 | 75 | 52 | 74 | 91 | 62 | 68.7 |
| AAC Planet | 79 | 59 | 74 | 70 | 51 | 73 | 81 | 68 | 69.5 |
| AAC Lorlie | 82 | 64 | 61 | 69 | 52 | 70 | 89 | 70 | 69.8 |
| Boost | 84 | 53 | 68 | 68 | 54 | 85 | 78 | 72 | 70.3 |
| CDC Dakota | 82 | 57 | 81 | 74 | 45 | 83 | 73 | 67 | 70.4 |
| CDC Blazer | 75 | 63 | 72 | 70 | 43 | 78 | 93 | 71 | 70.9 |
| CDC Forest | 79 | 52 | 82 | 71 | 46 | 79 | 90 | 71 | 71.2 |
| CDC 5791 | 84 | 58 | 70 | 71 | 51 | 79 | 87 | 72 | 71.7 |
| CDC Limerick | 75 | 60 | 68 | 68 | 58 | 85 | 84 | 76 | 71.8 |
| CDC Dakota-2 | 84 | 58 | 67 | 70 | 56 | 83 | 83 | 74 | 72.0 |
| CDC Canary | 86 | 65 | 79 | 77 | 59 | 77 | 100 | 68 | 72.2 |
| Melrose check | 86 | 42 | 93 | 74 | 56 | 75 | 80 | 70 | 72.3 |
| CDC Huskie | 77 | 59 | 79 | 72 | 51 | 75 | 93 | 73 | 72.4 |
| CDC Sonata | 78 | 74 | 74 | 75 | 63 | 67 | 84 | 71 | 73.3 |
| CDC Lewochko | 77 | 51 | 84 | 71 | 68 | 81 | 79 | 76 | 73.6 |
| CDC Jasper | 79 | 63 | 79 | 74 | 56 | 74 | 89 | 73 | 73.6 |
| AAC Carver | 87 | 58 | 70 | 72 | 49 | 85 | 93 | 76 | 73.7 |
| CDC Spruce | 78 | 55 | 85 | 73 | 64 | 66 | 95 | 75 | 73.7 |
| AAC Profit | 83 | 64 | 80 | 76 | 51 | 78 | 86 | 72 | 74.1 |
| CDC Saffron | 84 | 61 | 68 | 71 | 62 | 80 | 88 | 77 | 74.1 |
| P1222-2923 | 83 | 53 | 80 | 72 | 64 | 83 | 84 | 77 | 74.3 |
| DL Goldeye | 81 | 81 | 75 | 79 | 50 | 78 | 81 | 70 | 74.3 |
| Caphorn | 87 | 55 | 81 | 74 | 55 | 79 | 90 | 74 | 74.5 |
| EP_8971 | 88 | 62 | 78 | 76 | 52 | 76 | 90 | 73 | 74.5 |
| AAC Chrome | 84 | 57 | 78 | 73 | 63 | 82 | 83 | 76 | 74.6 |
| CDC Greenwater | 84 | 63 | 75 | 74 | 65 | 74 | 86 | 75 | 74.6 |
| CDC Spectrum | 87 | 57 | 74 | 72 | 61 | 81 | 88 | 77 | 74.6 |
| CDC Meadow | 88 | 57 | 77 | 74 | 57 | 80 | 89 | 75 | 74.7 |
| CDC Inca | 76 | 49 | 88 | 71 | 51 | 87 | 95 | 78 | 74.7 |
| CDC Engage | 79 | 52 | 88 | 73 | 57 | 82 | 90 | 76 | 74.7 |
| CDC Boundless | 84 | 68 | 69 | 74 | 57 | 77 | 92 | 76 | 74.8 |
| CDC Tollefson | 79 | 74 | 74 | 76 | 61 | 74 | 87 | 74 | 74.9 |
| Prostar | 83 | 51 | 85 | 73 | 58 | 78 | 94 | 77 | 75.1 |
| DL Lacross | 79 | 77 | 68 | 75 | 60 | 81 | 87 | 76 | 75.4 |
| CDC Mosaic | 80 | 60 | 90 | 77 | 62 | 79 | 83 | 74 | 75.6 |
| CDC Amarillo | 82 | 67 | 91 | 80 | 55 | 68 | 90 | 71 | 75.8 |
| DL Delicious | 87 | 70 | 71 | 76 | 63 | 76 | 86 | 75 | 75.8 |
| AAC McMurphy | 84 | 59 | 86 | 76 | 52 | 79 | 95 | 76 | 76.1 |
| CDC Hickie | 80 | 54 | 85 | 73 | 63 | 88 | 85 | 79 | 76.2 |
| CDC Golden | 74 | 87 | 84 | 82 | 54 | 75 | 87 | 72 | 76.9 |
| CDC 5845 | 79 | 62 | 84 | 75 | 69 | 79 | 89 | 79 | 77.1 |
| 6242-1 | 83 | 61 | 94 | 79 | 61 | 81 | 82 | 75 | 77.2 |
| AAC Aberdeen | 82 | 65 | 89 | 78 | 55 | 87 | 86 | 76 | 77.2 |
| AAC Ardill | 88 | 61 | 96 | 81 | 54 | 78 | 89 | 73 | 77.4 |
| CDC Raezer | 84 | 58 | 87 | 76 | 73 | 75 | 89 | 79 | 77.8 |
| CDC Citrine | 80 | 54 | 84 | 73 | 67 | 86 | 94 | 83 | 77.9 |
| Abarth | 87 | 65 | 78 | 77 | 60 | 84 | 93 | 79 | 78.0 |
| CDC Striker | 79 | 59 | 82 | 73 | 70 | 77 | 98 | 82 | 78.0 |
| AAC Julius | 83 | 72 | 91 | 82 | 51 | 79 | 94 | 75 | 78.4 |
| DL190006 | 93 | 57 | 97 | 82 | 55 | 80 | 94 | 76 | 79.6 |
| CDC Horizon | 77 | 69 | 93 | 79 | 59 | 82 | 97 | 79 | 80.0 |
| AAC Beyond | 88 | 62 | 90 | 80 | 69 | 80 | 96 | 82 | 81.1 |
| Overall Mean | 82.1 | 60.6 | 79.4 | 74.0 | 57.1 | 78.0 | 88.2 | 73.7 | 74.0 |
| CV | 7.7 | 19.8 | 14.3 | 14.2 | 19.9 | 10.6 | 10.0 | 17.5 | 15.8 |
| P-value (p<0.05) | 0.02 | 0 | <.0001 | 0.0186 | 0.01 | 0 | <.0001 | 5E-04 | 0.0017 |
| LSD | 8.9 | 17.3 | 24.1 | 9.9 | 15.0 | 10.9 | 11.6 | 9.8 | 8.0 |
Acknowledgements
The technical support from staff at AAFC-Lethbridge, AAFC-Morden, and the Crop Development Centre are gratefully acknowledged. This study is part of the Saskatchewan Ministry of Agriculture Strategic Research Initiative project ‘Accelerate discovery of root rot solutions for pea and lentil in Saskatchewan’ led by Sabine Banniza, Crop Development Centre, University of Saskatchewan, and funded by the Saskatchewan Ministry of Agriculture, Saskatchewan Pulse Growers, Alberta Pulse Growers, Manitoba Pulse and Soybean Growers, Western Grains Research Foundation, and Results Driven Agriculture Research.
Reference
McGee RJ, Coyne CJ, Pilet-Nayel ML, Moussart A, Tivoli B, Baranger A, Hamon C, Vandemark G, and McPhee K (2012) Registration of pea germplasm lines partially resistant to Aphanomyces root rot for breeding fresh or freezer pea and dry pea types. Journal of Plant Registrations, 6:203–207, doi: 10.3198/jpr2011.03.0139crg.