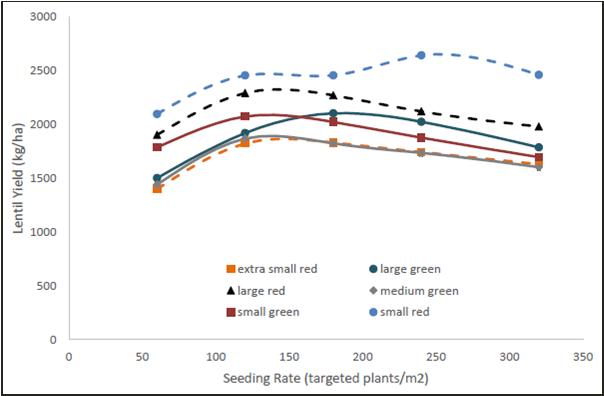
Source: Shirtliffe1
Research performed by Dr. Steve Shirtliffe from the University of Saskatchewan over the past several years, suggests that small red lentils could benefit in yield and economics by increasing the current provincial recommended seeding rate of 120 plants per metre squared (m2), to up to 240 plants/m2 (Shirtliffe1, Smith2).
Purpose of the Project
Dr. Shirtliffe’s results were based on controlled conditions in small plots. This Pulse Replicated On-Farm Independent Trial (PROFIT) was established to validate the research findings under large-scale field trials, using grower equipment, under various environmental conditions. The purpose of the project was to identify the impact of increased seeding rates on yield, disease pressure, weed suppression, and net return.
Design of Experiment
Twelve producers were recruited to participate, using their own management practices and field-scale equipment.
Each grower targeted seeding rates of 1 times, 1.5 times, and 2 times the recommended seeding rate of 120 plants/m2, and replicated each seeding rate three times. The size of each replicated plot was the width of the grower’s seeder, by a length of at least 1,000 feet. This typically gave an area of one to two acres for each replicate plot at each site. Sites were visited six times throughout the crop season (May to September 2017), in order to collect key trial information. At harvest, each strip was weighed separately using a weigh wagon to provide gross yield weights.
Yield measurements for each plot were then normalized to 13 per cent seed moisture content.
The experiment included three different small red lentil varieties, based on producer preference (CDC Maxim — nine sites, CDC Dazil — two sites, and CDC Proclaim — one site). All three are ClearField® varieties, which enabled weed control during the trial when necessary.
Results
Dry conditions in Saskatchewan in 2017 may have impacted the results of the study, as lower yields were obtained at some locations. The dry conditions also led to lower disease pressure over all sites. One site (Outlook) was also damaged by hail prior to August, but was taken to harvest. Individual site information can be found in Table 1.
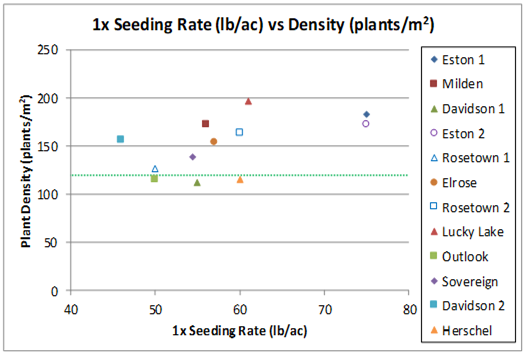
Initial seeding rates at 1 times ranged from 46 to 75 pounds per acre (lb/ac), with the majority of growers seeding at 50 to 60 lb/ac. The range in seeding rates resulted in a wide range of plant densities, as shown in Figure 2. The target density at 1 times was 120 plants/m2 as shown by the green line. Eight of the 12 sites had starting densities well above the target plant stand and ranged from 139 to 197 plants/m2. There was no correlation between seeding rate in lb/ac and plant density at the initial seeding rates. It was observed that seed size ranged dramatically from grower to grower, but no information was collected on thousand kernel weight (TKW). Seed quality and emergence rates could also vary by grower, and could influence actual plant stands.
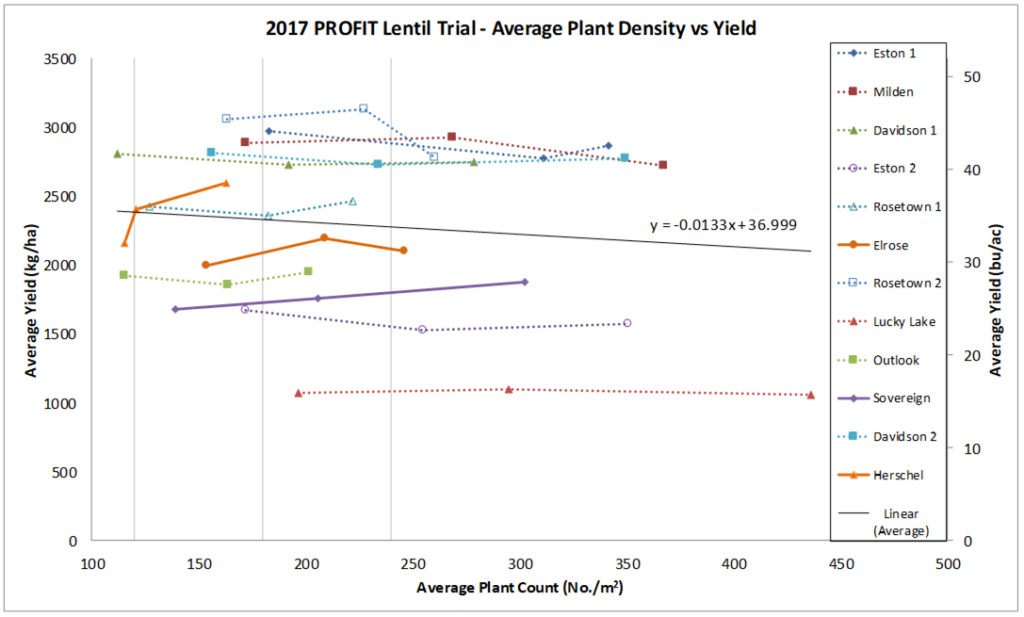
Yield response to increasing plant density across all 12 sites is shown in Figure 3. Overall, yield did not show a correlation with plant count, and at several sites showed a flat response in yield across the range of seeding rates. However, three trial sites did show an increase in yield as the seeding rate was increased — Elrose, Sovereign, and Herschel. When actual seeding rates were compared in these three sites (Figure 4), there was little difference in actual lb/ac at the three rates. However, plant populations were quite different as shown in Figure 3. Hershel had much lower plant populations compared to the other two responsive sites, due to a low germination rate that may have been caused by heavy straw cover.
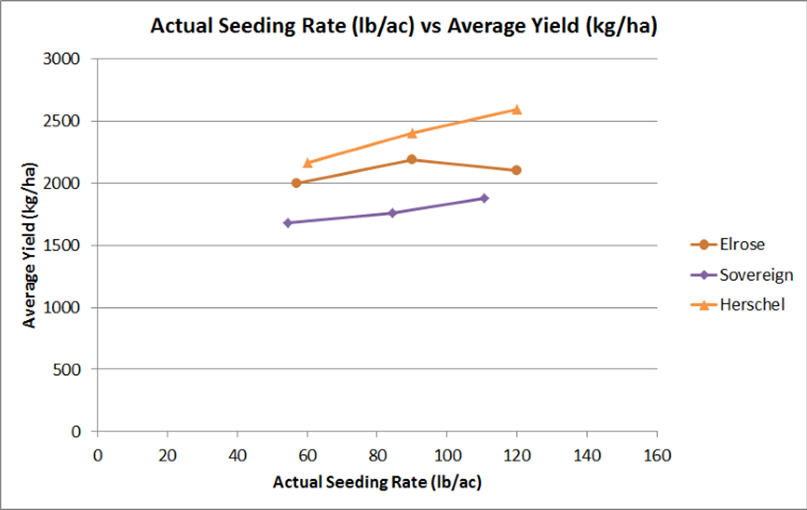
Table 1: 2017 Small Red Lentil Seeding Rate Study – Site Locations and Details. Rainfall amounts are regional from planting date to har- vest date. Weed pressure is rated as effect on yield (1 – high pressure, to 5 – low pressure).
| Location | Rural Municipality | Variety | 1x Seeding Rate (Avg Plant Count/m2) | 1x Seeding Rate (lb/ac) | Seeding Depth (inch) | Row Spacing (inch) | Growing Conditions | Rainfall (mm) | Weed Pressure (1 high to 5 low) |
|---|---|---|---|---|---|---|---|---|---|
| Lucky Lake | Canaan No. 225 | CDC Dazil | 197 | 61 | 1 | 10 | hot and dry | 77 | 4 |
| Davidson 1 | Arm River No. 252 | CDC Maxim | 112 | 55 | 1.25 | 12 | 70 | 5 | |
| Davidson 2 | Arm River No. 252 | CDC Maxim | 156 | 46 | 0.75 | 12 | 74 | 4 | |
| Elrose | Monet No. 257 | CDC Maxim | 154 | 57 | 1.5 | 10 | hot, good moisture | 97 | 5 |
| Eston 1 | Snipe Lake No. 259 | CDC Maxim | 183 | 75 | 1.5 | 10 | 93 | 5 | |
| Eston 2 | Snipe Lake No. 259 | CDC Maxim | 172 | 75 | 1.5 | 10 | 61 | 4 | |
| Outlook | Rudy No. 284 | CDC Maxim | 115 | 50 | 0.5 | 12 | 106 | 5 | |
| Milden | Milden No. 286 | CDC Proclaim | 172 | 56 | 1.5 | 12 | hot and dry | 98 | 4 |
| Rosetown 1 | St. Andrews No. 287 | CDC Maxim | 127 | 50 | 1.5 | 12 | hot, good moisture | 98 | 3 |
| Rosetown 2 | St. Andrews No. 287 | CDC Maxim | 163 | 60 | 1.5 | 10 | hot, good moisture | 98 | 5 |
| Sovereign | St. Andrews No. 287 | CDC Dazil | 139 | 54 | 2 | 10 | dry | 98 | 4 |
| Herschel | Mountain View No. 318 | CDC Maxim | 115 | 60 | 1 | 12 | 98 | 3 |
Weed pressure was generally low, but did increase to moderate levels in a few sites (Table 1). On a site-by-site basis, there was no correlation between plant counts and weed pressure.
This year’s trial also had low disease pressure overall, and no correlation was found between plant count and disease scores.
The target plant counts/m2 for this study were 120 plants (1 times), 180 plants (1.5 times), and 240 plants (2 times). The actual average 1 times rate in this year’s study had a plant count of 154 plants/m2, and ranged across the sites from a low of 112 plants/m2, to a high of 197 plants/m2 (Figure 3). This suggests that presently some producers seed small red lentils at higher rates than currently recommended, and have recognized the benefits of higher seeding rates. Therefore, as part of normal operations, producers may have already captured the yield benefit as found in the previous small plot studies (Shirtliffe1). This could also mean that growers are not accurately calculating seeding rates, but are targeting a certain rate based on lb/ac. Consequently, when seed size is smaller in a given planting year, there are more seeds put into the ground than when seed size is larger. Discussions did find that there was smaller seed size at some locations with 2017 trials, and some growers targeting seeding rates based on weight (i.e., 60 lb/ac), versus accurately calibrating seeding rates based on seed size by using TKW.
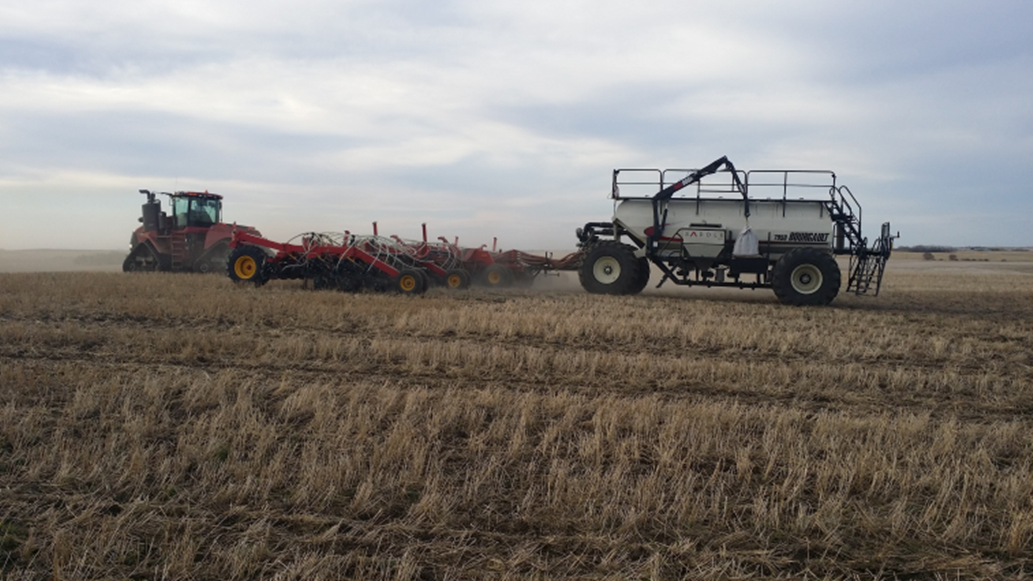
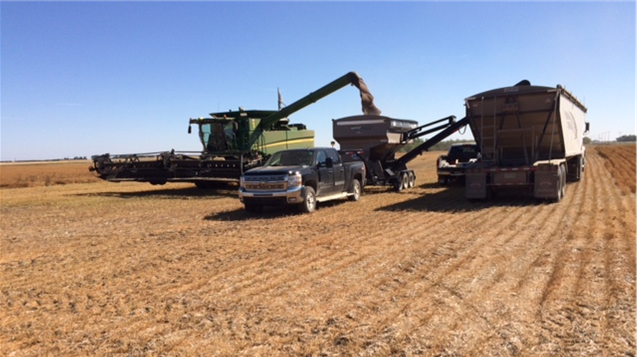
Weigh wagon setup at harvest, Aug 2017.
Economic Implications
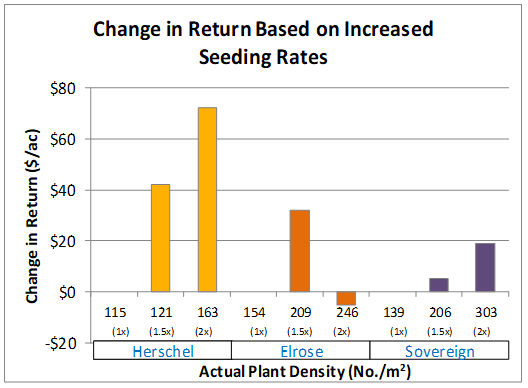
Out of the 12 field scale trials, three showed a positive response for at least one rate comparison (statistically significant to p<0.1) under 2017 growing conditions. The Herschel site had a dramatic increase of 437 kilograms per hectare (kg/ha) or 6.5 bushels per acre (bu/ac) when the plant stand went from 115 to 163 plants/m2. This equates to a $178/ha increase in profitability by going from a 1 times rate to the 2 times rate (Figure 5). The Elrose and Sovereign sites that had a positive yield response this year had smaller net profit increases at the 1.5 times seeding rate as compared to the 1 times rate. But at the 2 times rate, the Sovereign site was $47/ha more profitable, while the Elrose site saw a slight drop in profitability (-$13/ha), because the cost of extra treated seed was more than the gain in yield ($). These economics were based on an estimated cost of $0.52/lb for treated seed, the actual seeding rate for each site, and a harvested commodity price of $0.29/lb.
Due to the flat yield response in general, the cost of seed inputs decreased the net return for producers at most sites. Comparing the average profitability of 1 times seeding rate across the 12 sites, the 1.5 times seeding rate decreased the net return by $14.59/ac, and the 2 times seeding rate decreased the net return by $29.40/ac. Many producers seeded much more heavily, and actual plant densities were higher than the target plant counts. This could have resulted in lower net returns if higher seeding rates were used for normal operations.
Recommendations Based on Trial
Based on conditions at the sites in 2017, there was only a 25 per cent chance (3 out of 12 sites) of seeing a positive yield response to seeding rates higher than the targeted 120 plants/m2 with small red lentils. However, target plant populations were missed at the majority of sites, with higher plant stands resulting. To improve recommendations on seeding rates, there needs to be further studies on the expansion of seeding rates to include a lower seeding rate, and additional parametres in place to ensure seeding rates are calculated on seed size.
An interesting finding from this project is that small red lentils can be seeded at higher rates with no yield penalty as shown by no yield drop with even very high rates. Higher rates may be advantageous for increasing weed competition, but may pose an increased risk of disease under a wetter year.
In order for producers to maximize profits, these results highlight the need to calculate seeding rates based on the TKW of each seed lot as opposed to simply using a standard lb/ac rate that has been used in previous years. It is important to calibrate seeding equipment to deliver the correct rate (lb/ac) to achieve the recommended stand density (120 plants/m2 is a good starting point), based on the actual seed viability of the seed lot.
References
- 1 Shirtliffe, S. “The Effect of Seeding Rate and Seed Size on Lentil Diseases, Weeds, Yields and Profitability”. Growing Forward 2 Pulse Science Cluster Project AIP-CL03 annual report 2017.
- 2 Smith, L. “Ramp Up Rates Without Fear”. Pulse Point March 2017, Saskatchewan Pulse Growers, Ed. Andrea Lauder.
Acknowledgements
AgCall Inc. provided recruitment, trial management, and reporting services for this study.
