Published July 8, 2025
The symptoms of an emerging health issue in chickpea crops were first reported in southern Saskatchewan chickpea fields during the 2019 growing season. The symptoms have recurred annually since, with varying severity and geographical distribution. This issue has become a growing concern among growers, who typically first notice the symptoms in early to late July, during the flowering and early podding stages of crop development.
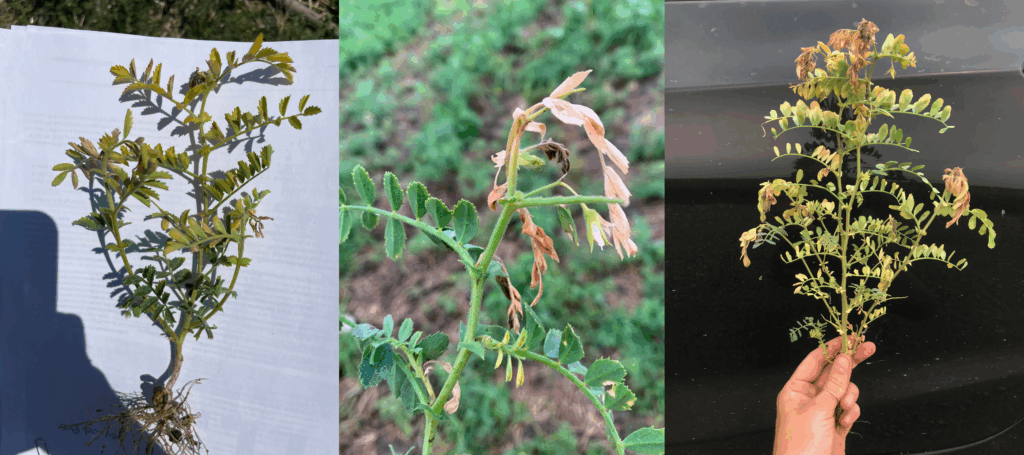
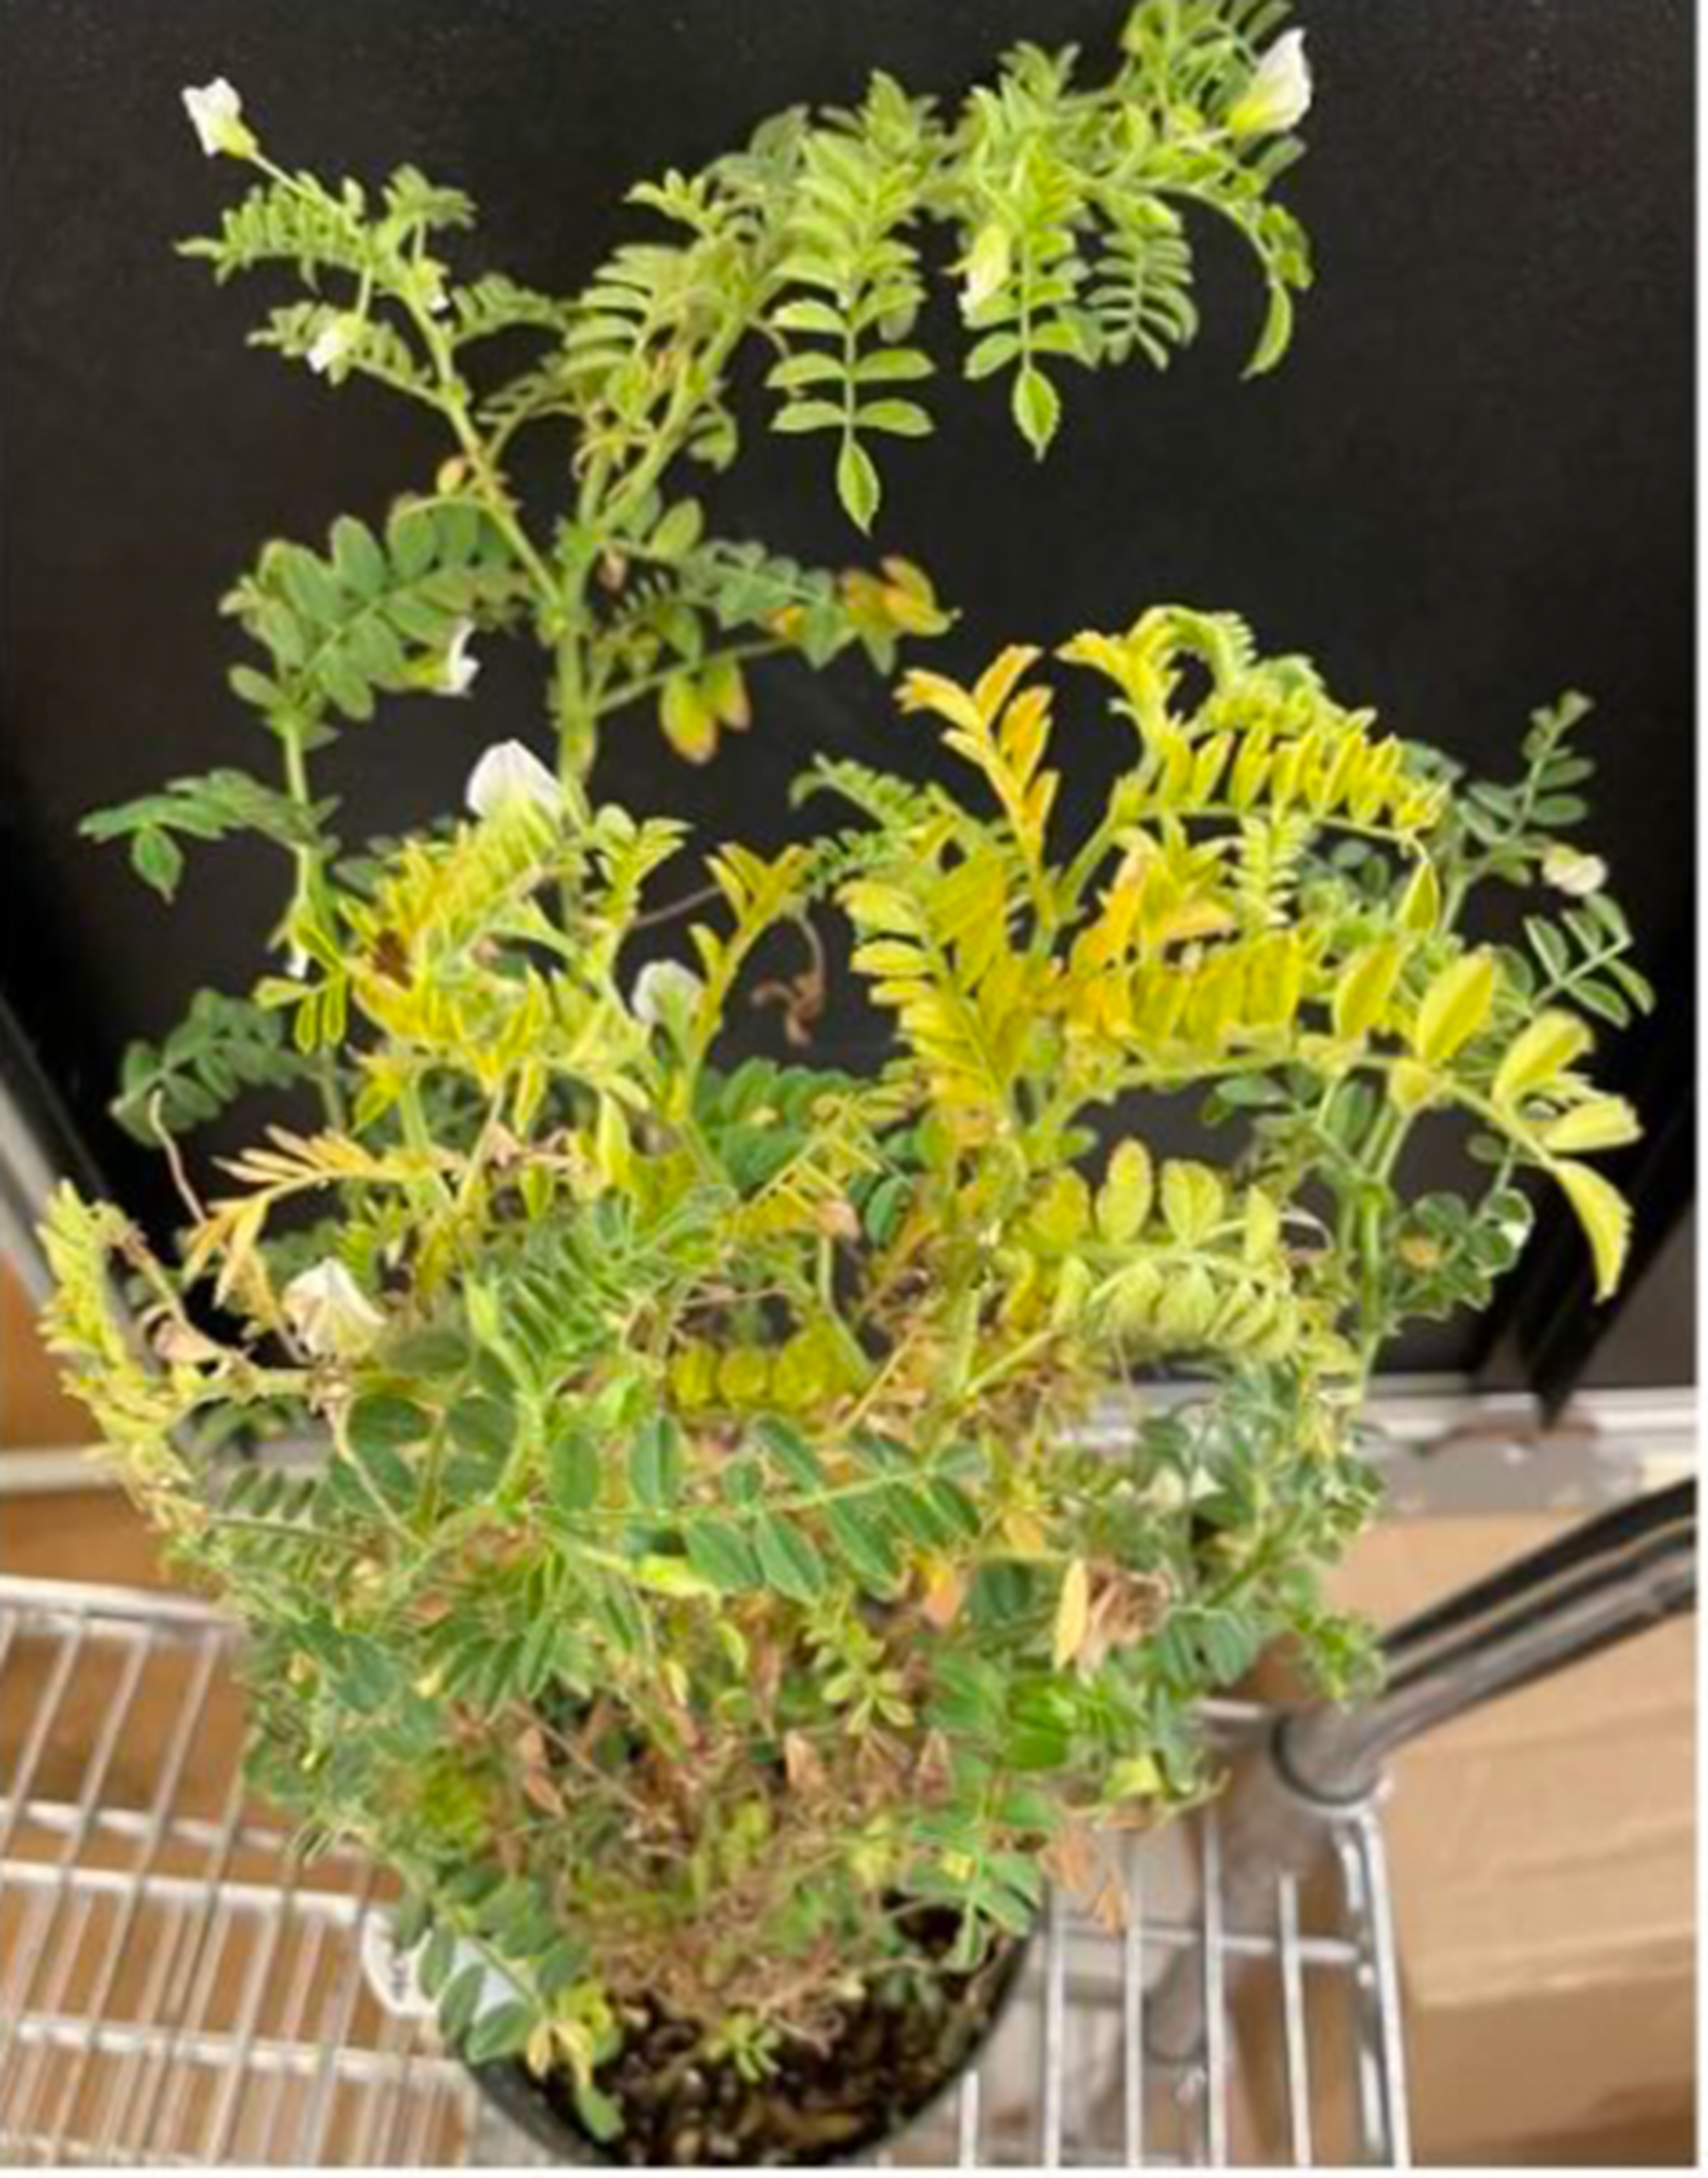
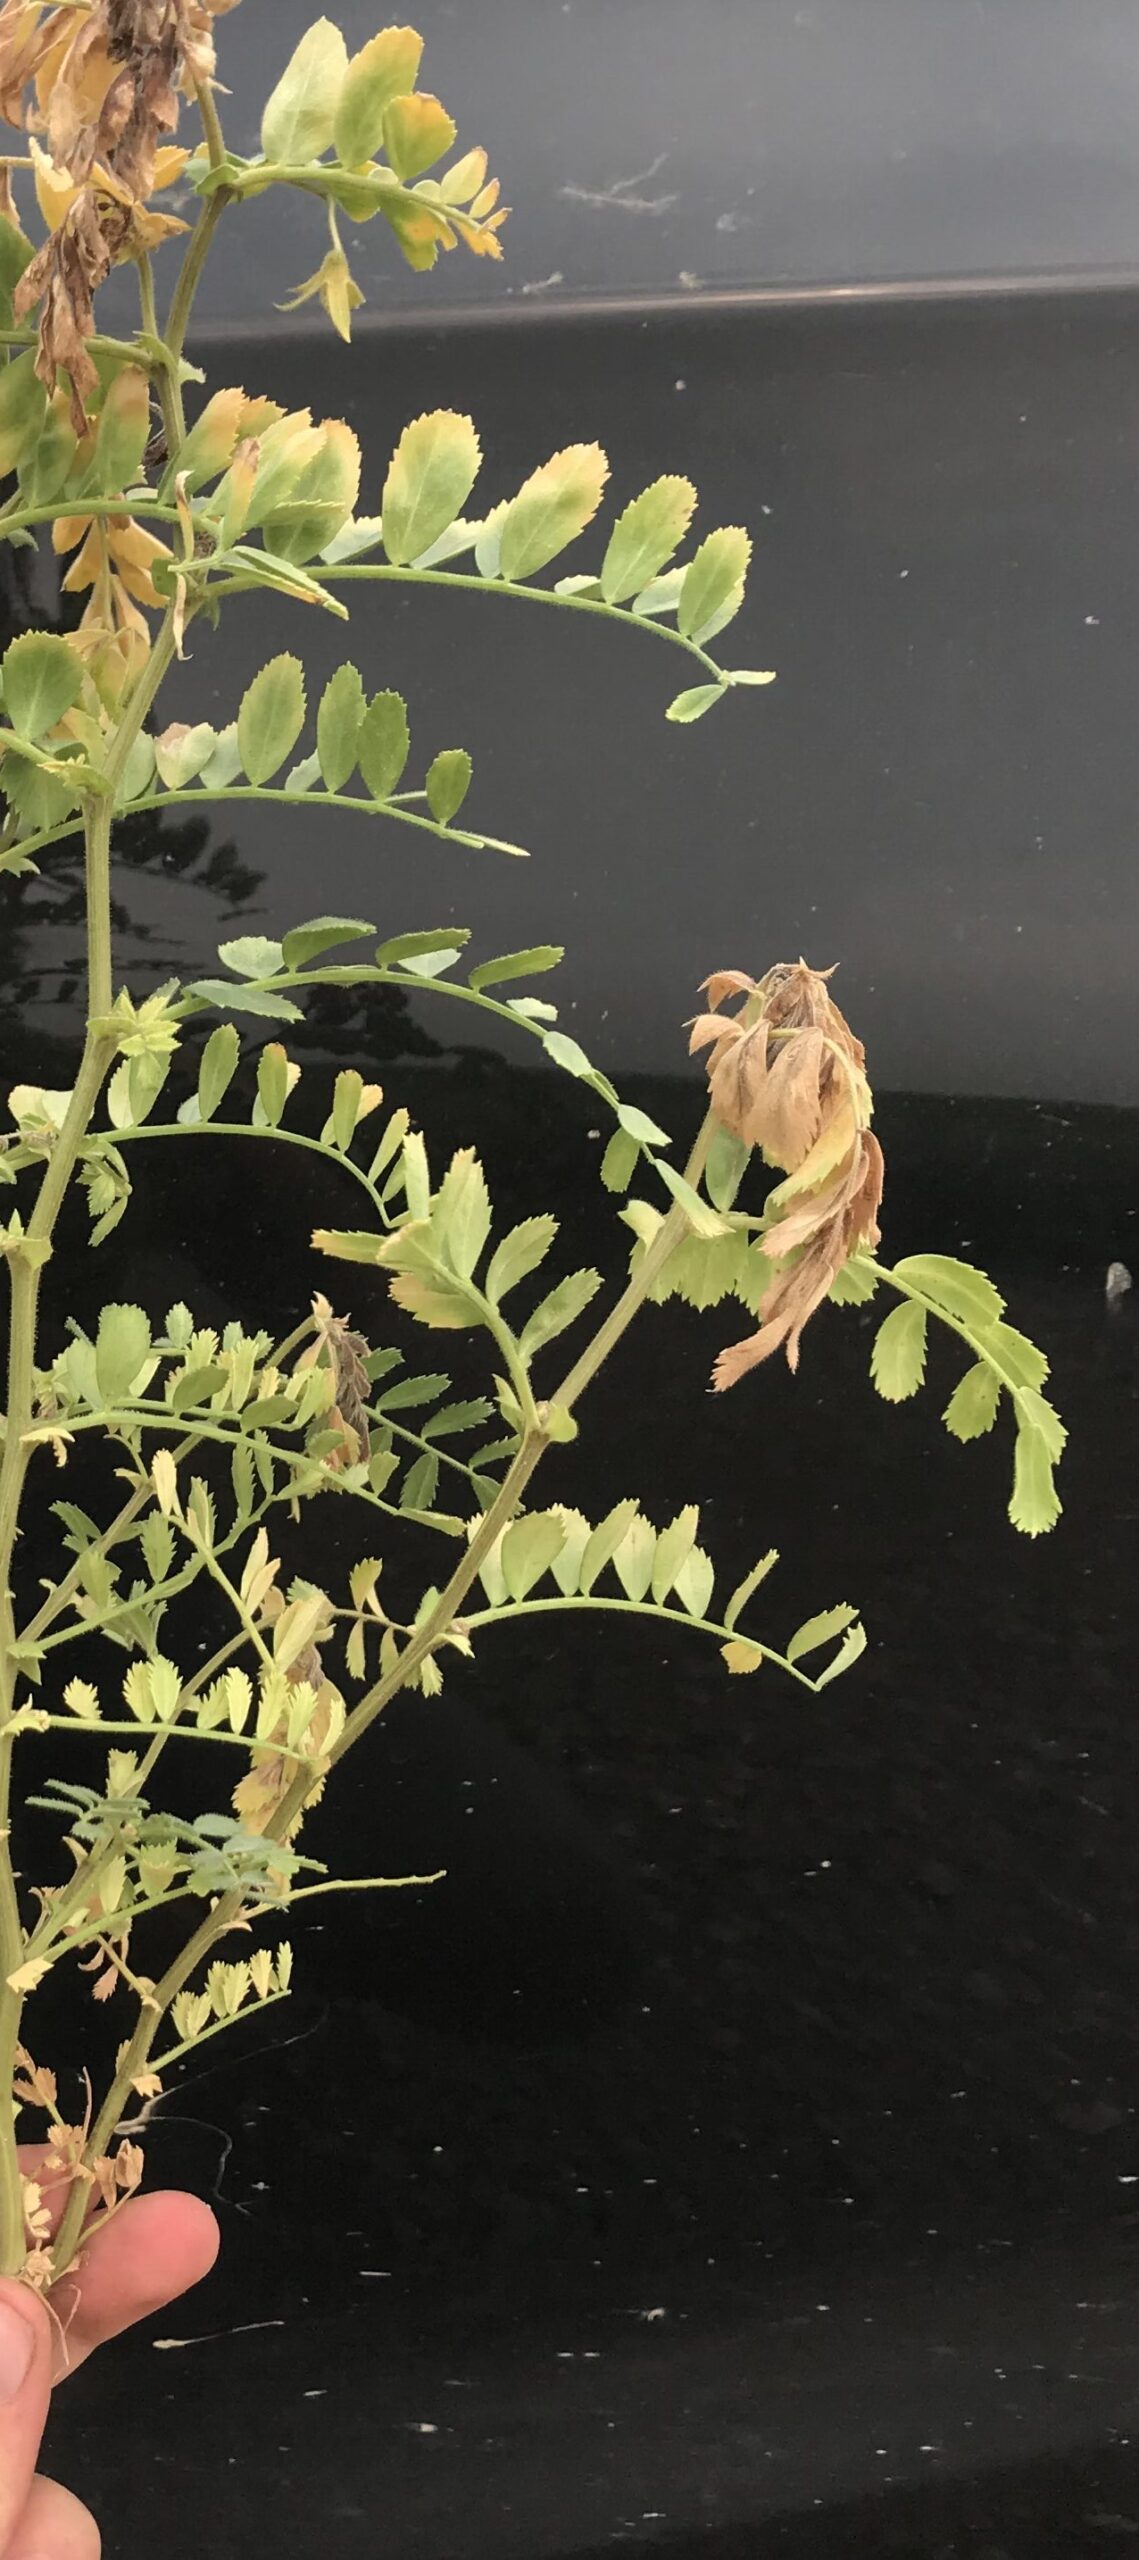
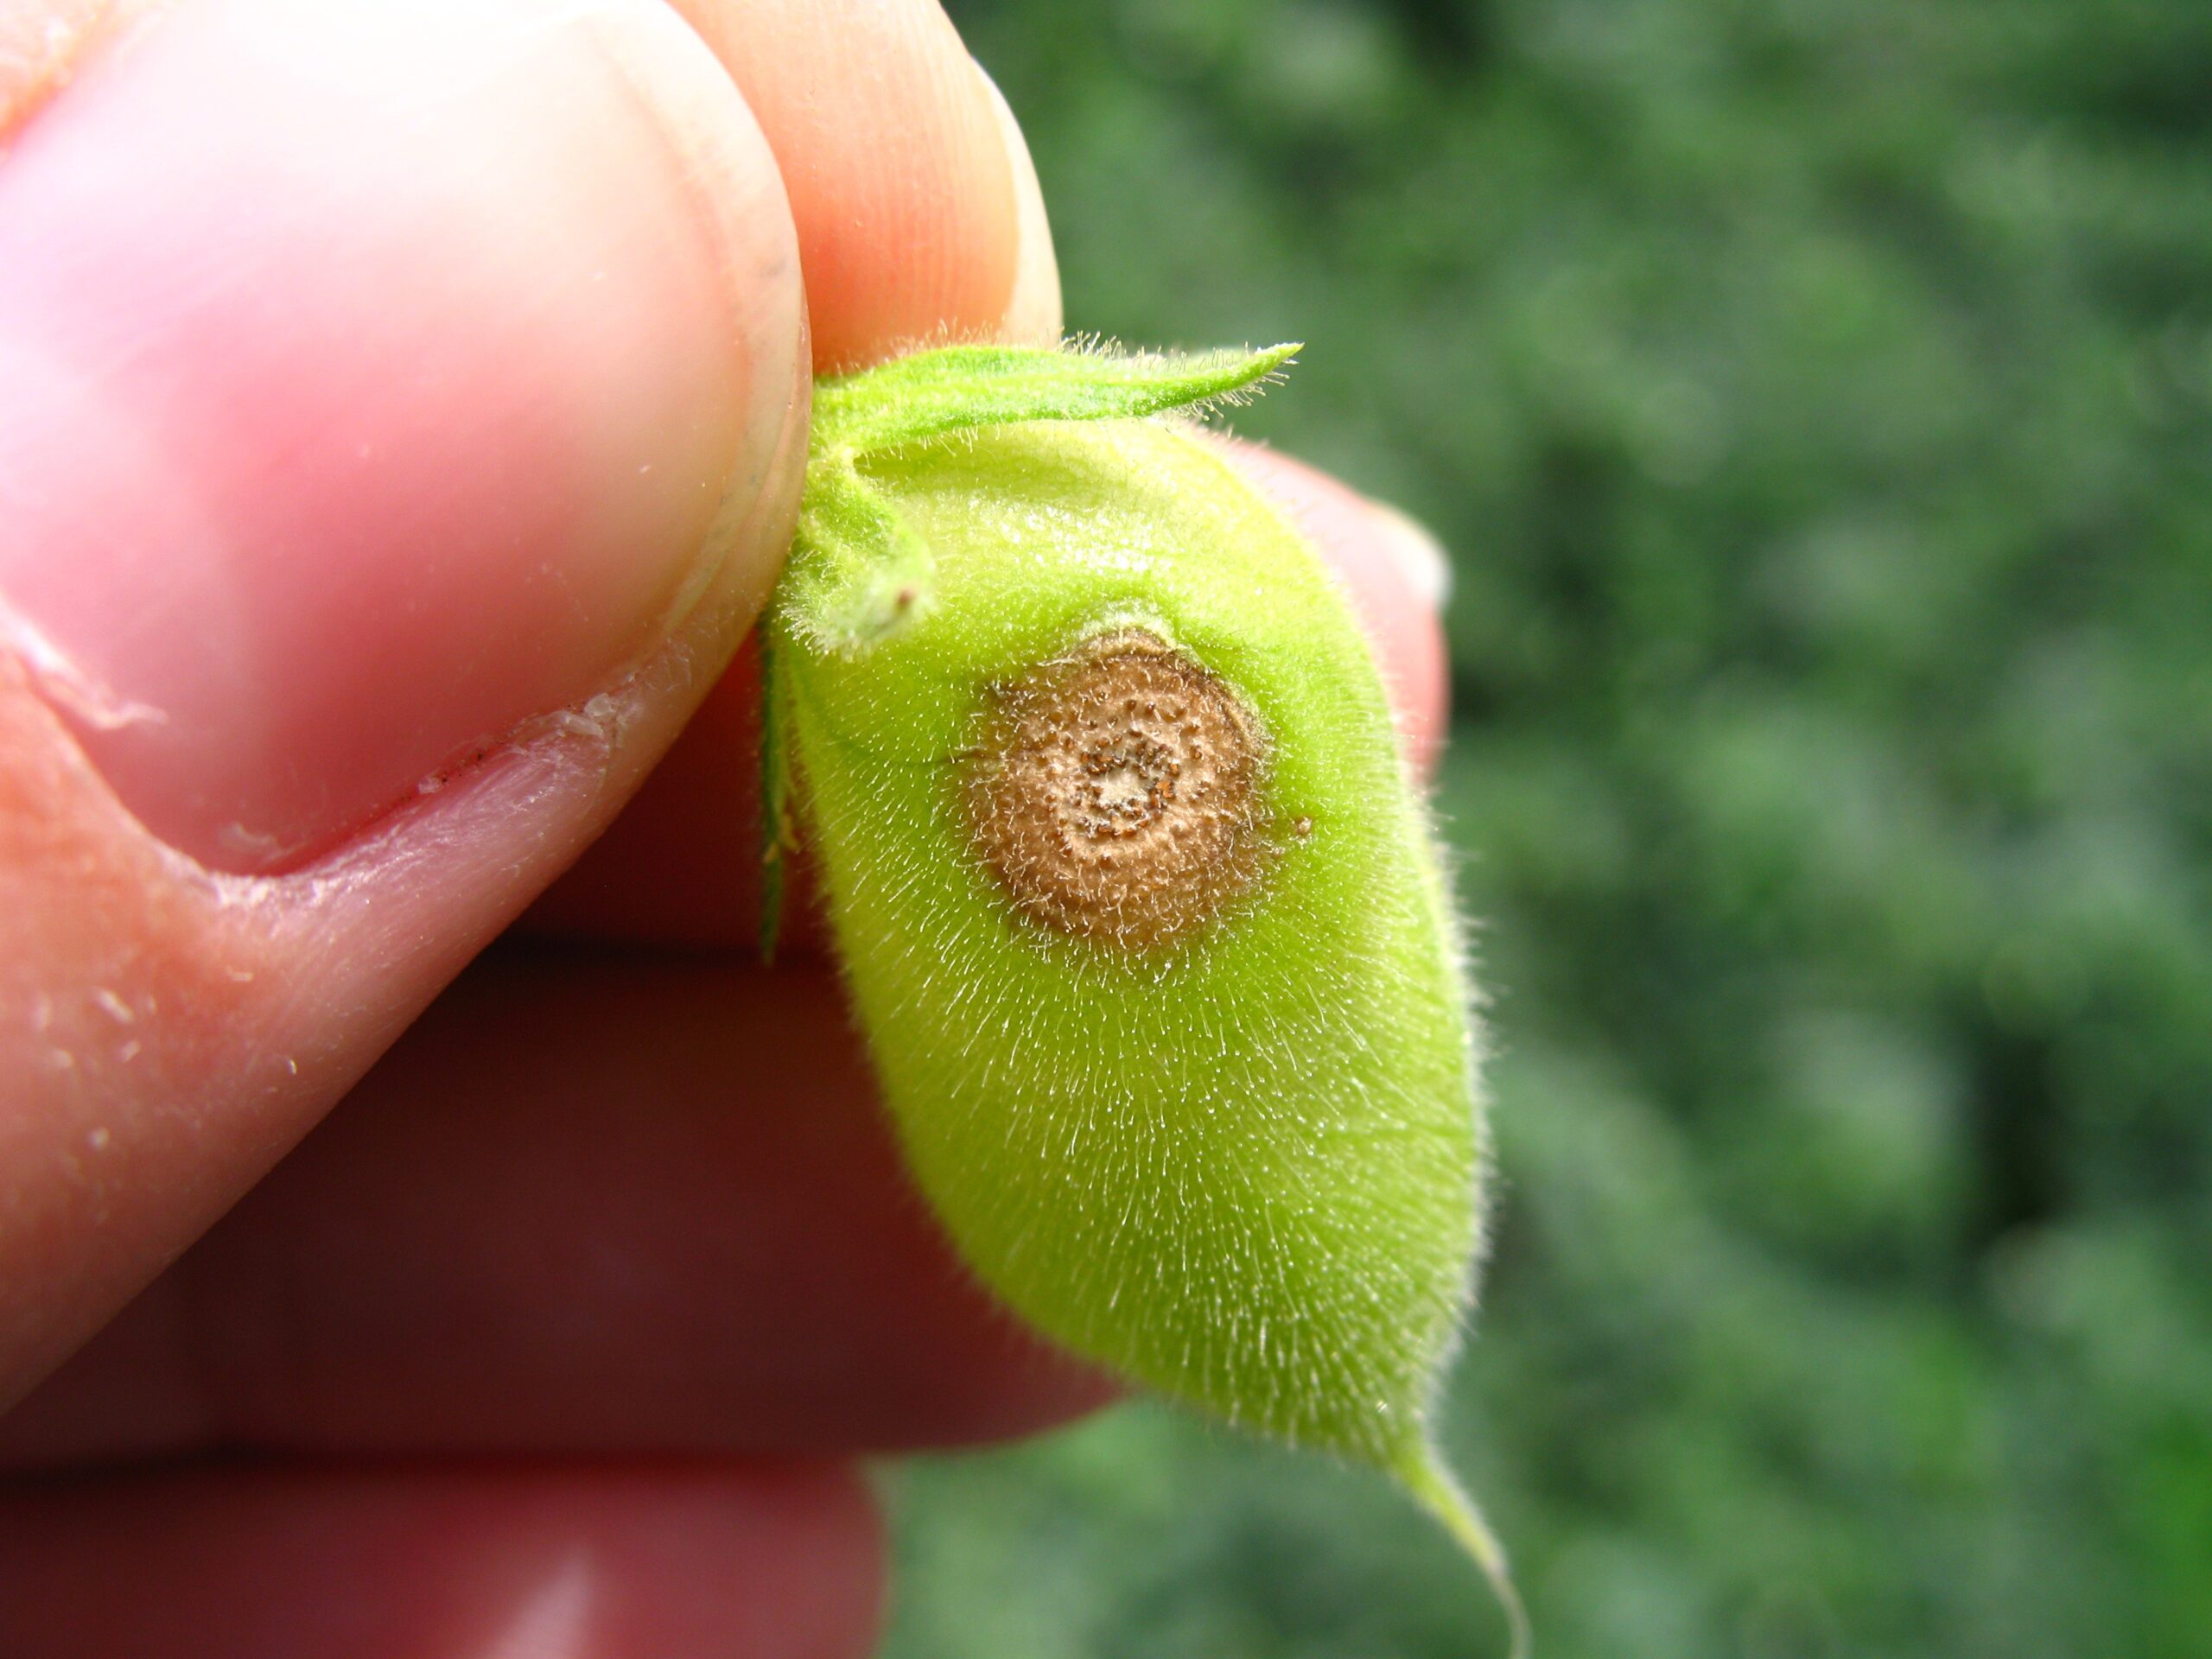
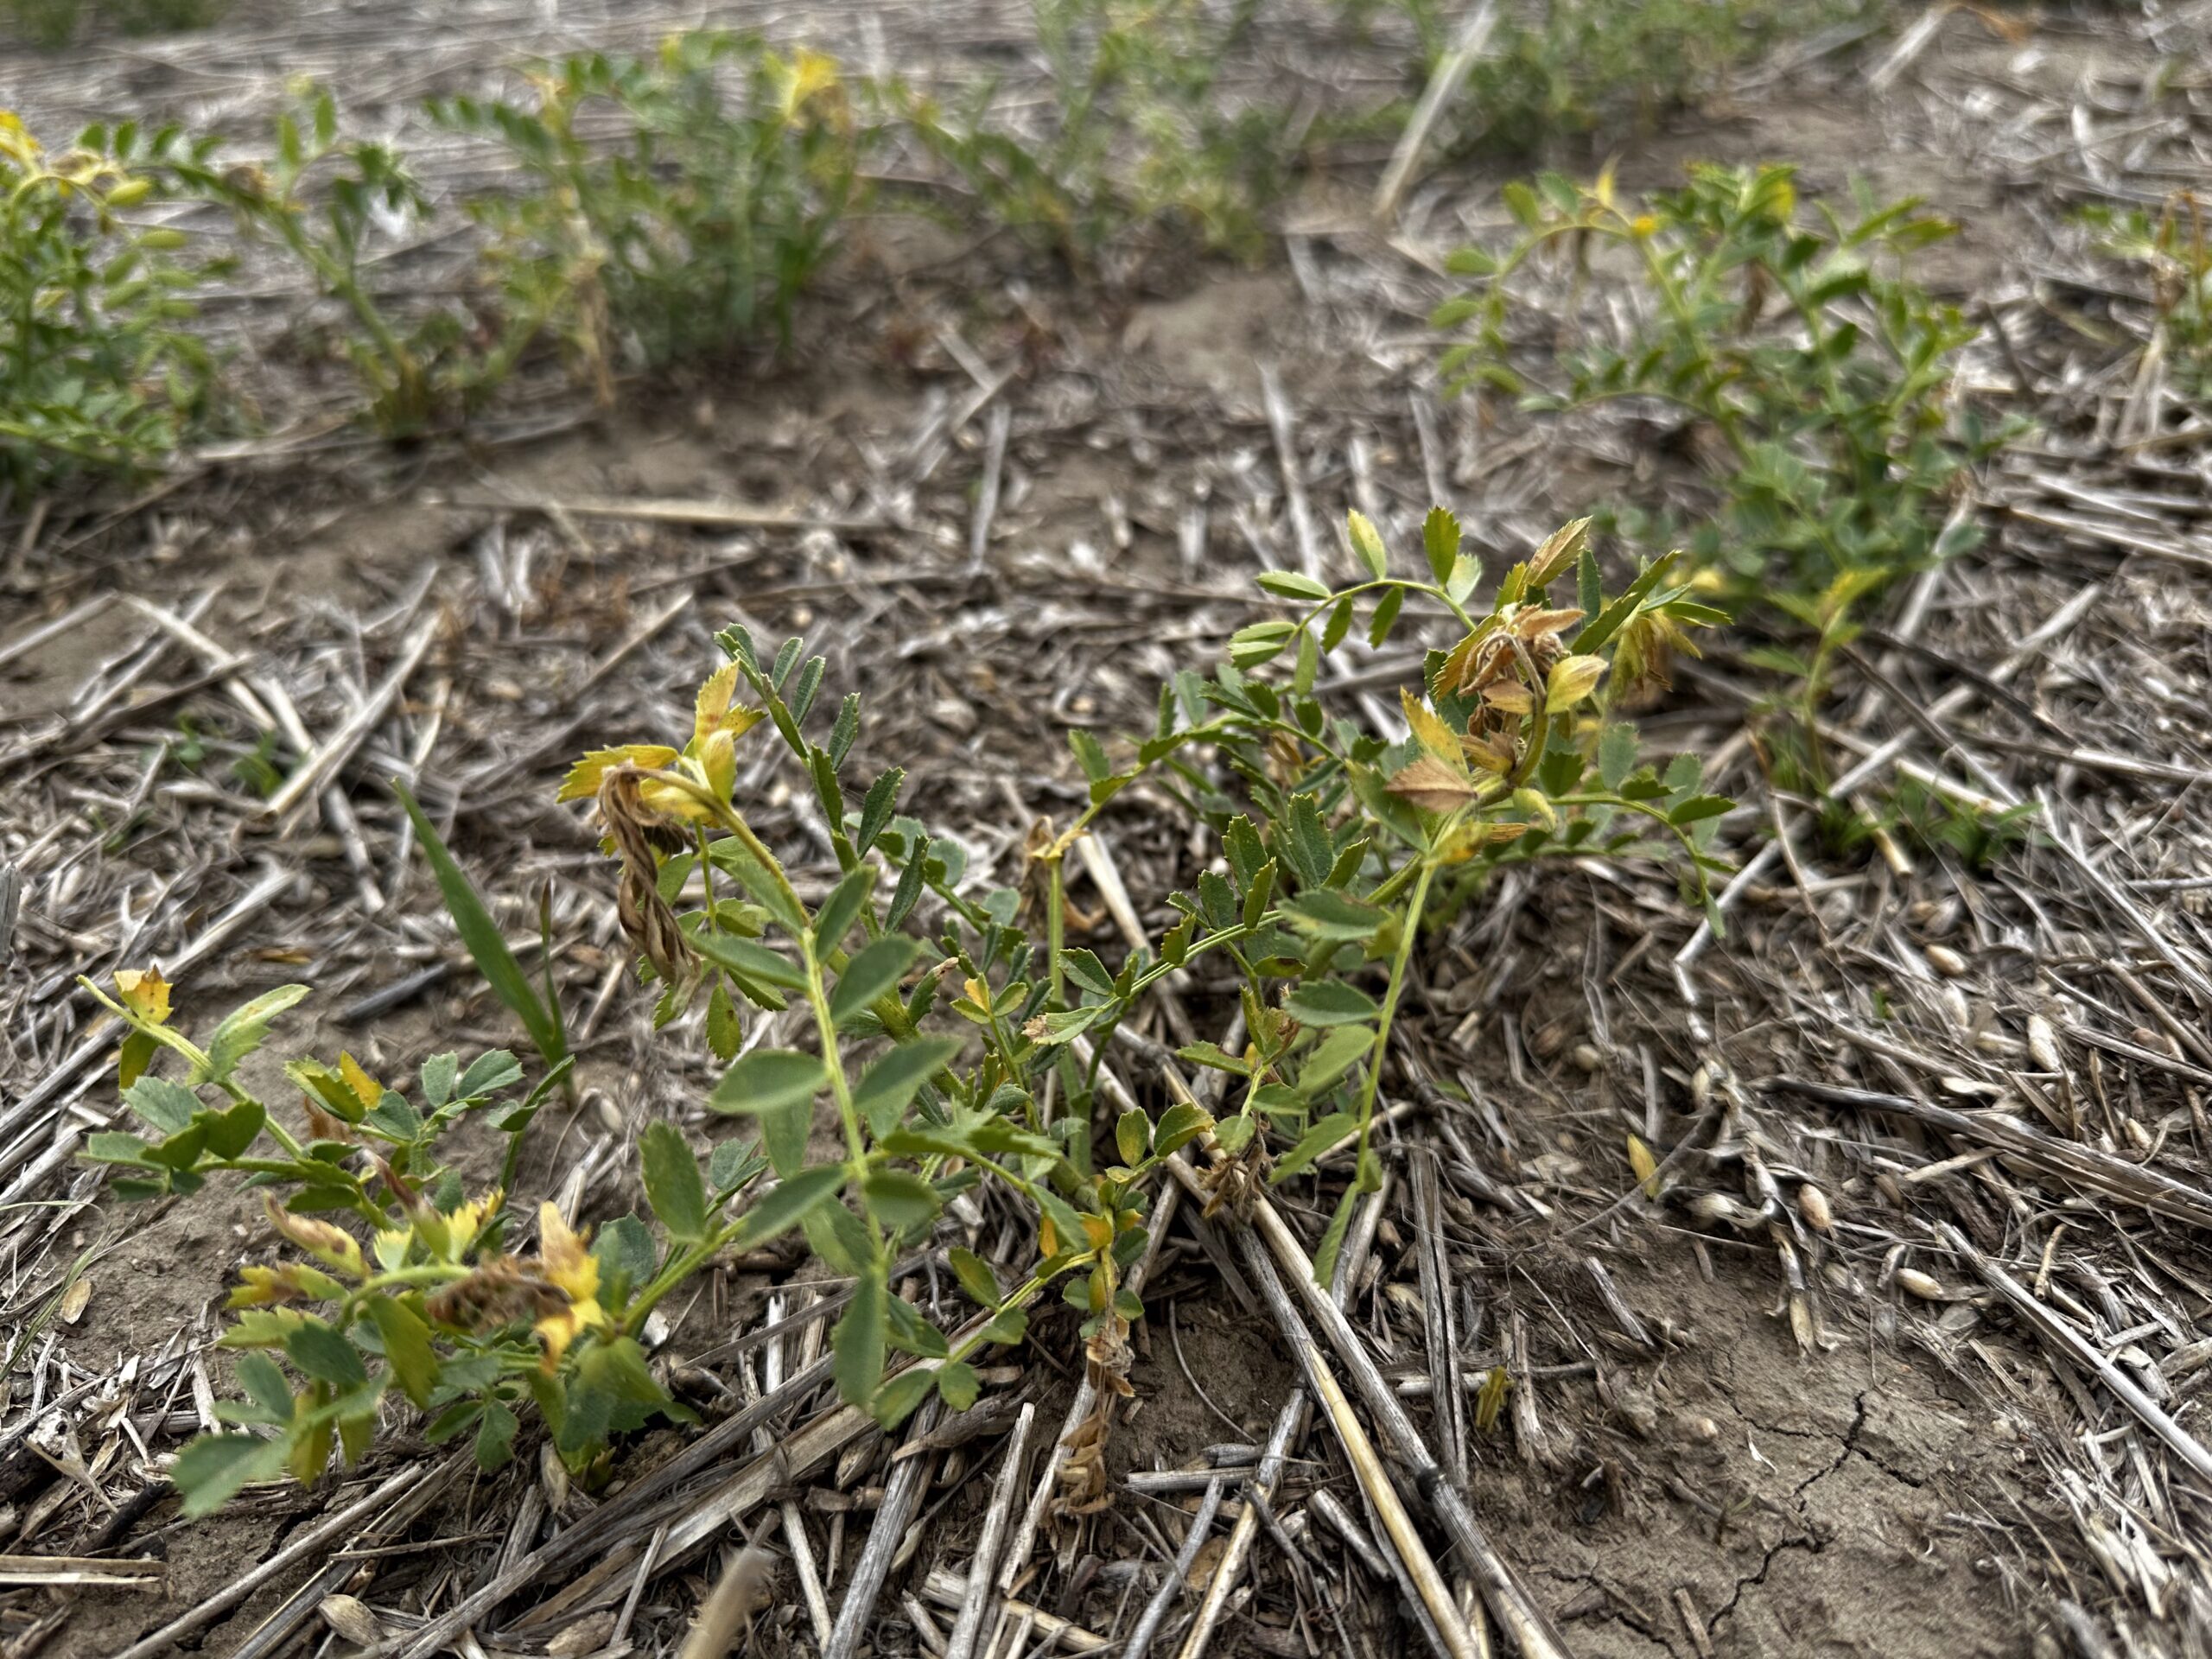
The onset of symptoms usually begins with the upper portions of the plant, manifesting as wilting and chlorosis at the terminal growth point. In some cases, the secondary growth in the leaf axis of the main branch also exhibits similar wilted and chlorotic characteristics. Within three to four days, symptoms progress to widespread browning or necrosis of the affected tissues. This stage is often accompanied by an uptick in Ascochyta blight symptoms in some fields; however, this could be a result of overlapping timelines in the phenology of both the health issue and Ascochyta blight. It is essential to distinguish between the two, as they are entirely separate issues. Over time, necrotic tissues dry and fall away in a phenomenon known as “tip dieback” and “premature leaflet drop”. Paradoxically, this can make field canopies appear healthier. Within approximately three weeks, plant regrowth and reflowering are observed. This creates a misleading appearance of crop recovery. Despite the appearance that the fields recovered, some pods within the plants remain empty. Additionally, in some cases, the maturity of plants is delayed, resulting in yield losses that are recorded to varying degrees in the majority of reported cases. Symptoms of the chickpea health issue are recorded on a scale from 1 to 5, with some leaf tip chlorosis measured as a 1.
Despite extensive efforts, a single causative agent has not been definitively linked to the Chickpea Health Issue. Starting in 2019, Saskatchewan Pulse Growers (SPG) initiated comprehensive evaluations in partnership with growers, agronomists, and research organizations through 2020. These efforts included sampling for herbicide residues, soil nutrient imbalances, and both foliar and root pathogens. The collected data did not implicate a single factor, reinforcing the hypothesis that the health issue is likely a combination of multiple factors involved, none of which would likely be able to result in the emergence of the health issue individually.
Factors investigated, such as seeding rate, did not affect symptom severity, though actual plant density was not measured. Seed treatment with Vibrance Maxx (seed treatment fungicide; active ingredients sedaxane, mefenoxam, fludioxonil) appeared to reduce severity compared to Apron Advance (seed treatment fungicide; active ingredients thiabendazole, fludioxonil, metalaxyl – M and – S). This was possibly due to Vibrance Maxx containing sedaxane, a broad-spectrum fungicide with stress mitigation properties. Use of the herbicide metribuzin correlated with more severe symptoms, although timing and symptom patterns suggest it exacerbated rather than directly caused the issue. Pre-emergent Group 14 herbicides did not impact symptoms. Fungicide use showed ambiguous effects; fields with four fungicide applications exhibited lower symptom severity, potentially due to better overall crop health; however, no consistent trend was observed with fewer applications. The role of naturally derived fungicides such as strobilurins remains unclear. Nematode presence (pin and spiral nematodes) was similar between healthy and unhealthy plants, but drought stress could amplify damage from nematode feeding. Previous crop history influenced symptom severity, with lentil and canola preceding chickpea linked to worse symptoms, possibly due to effects on nematode populations. Potassium (K) levels in plant tissues showed a negative correlation with symptom severity, although relationships with other nutrients were not observed. Higher K levels could indicate healthier root systems or more effective disease resistance mechanisms, resulting in crops with enhanced resistance to the chickpea health issue.
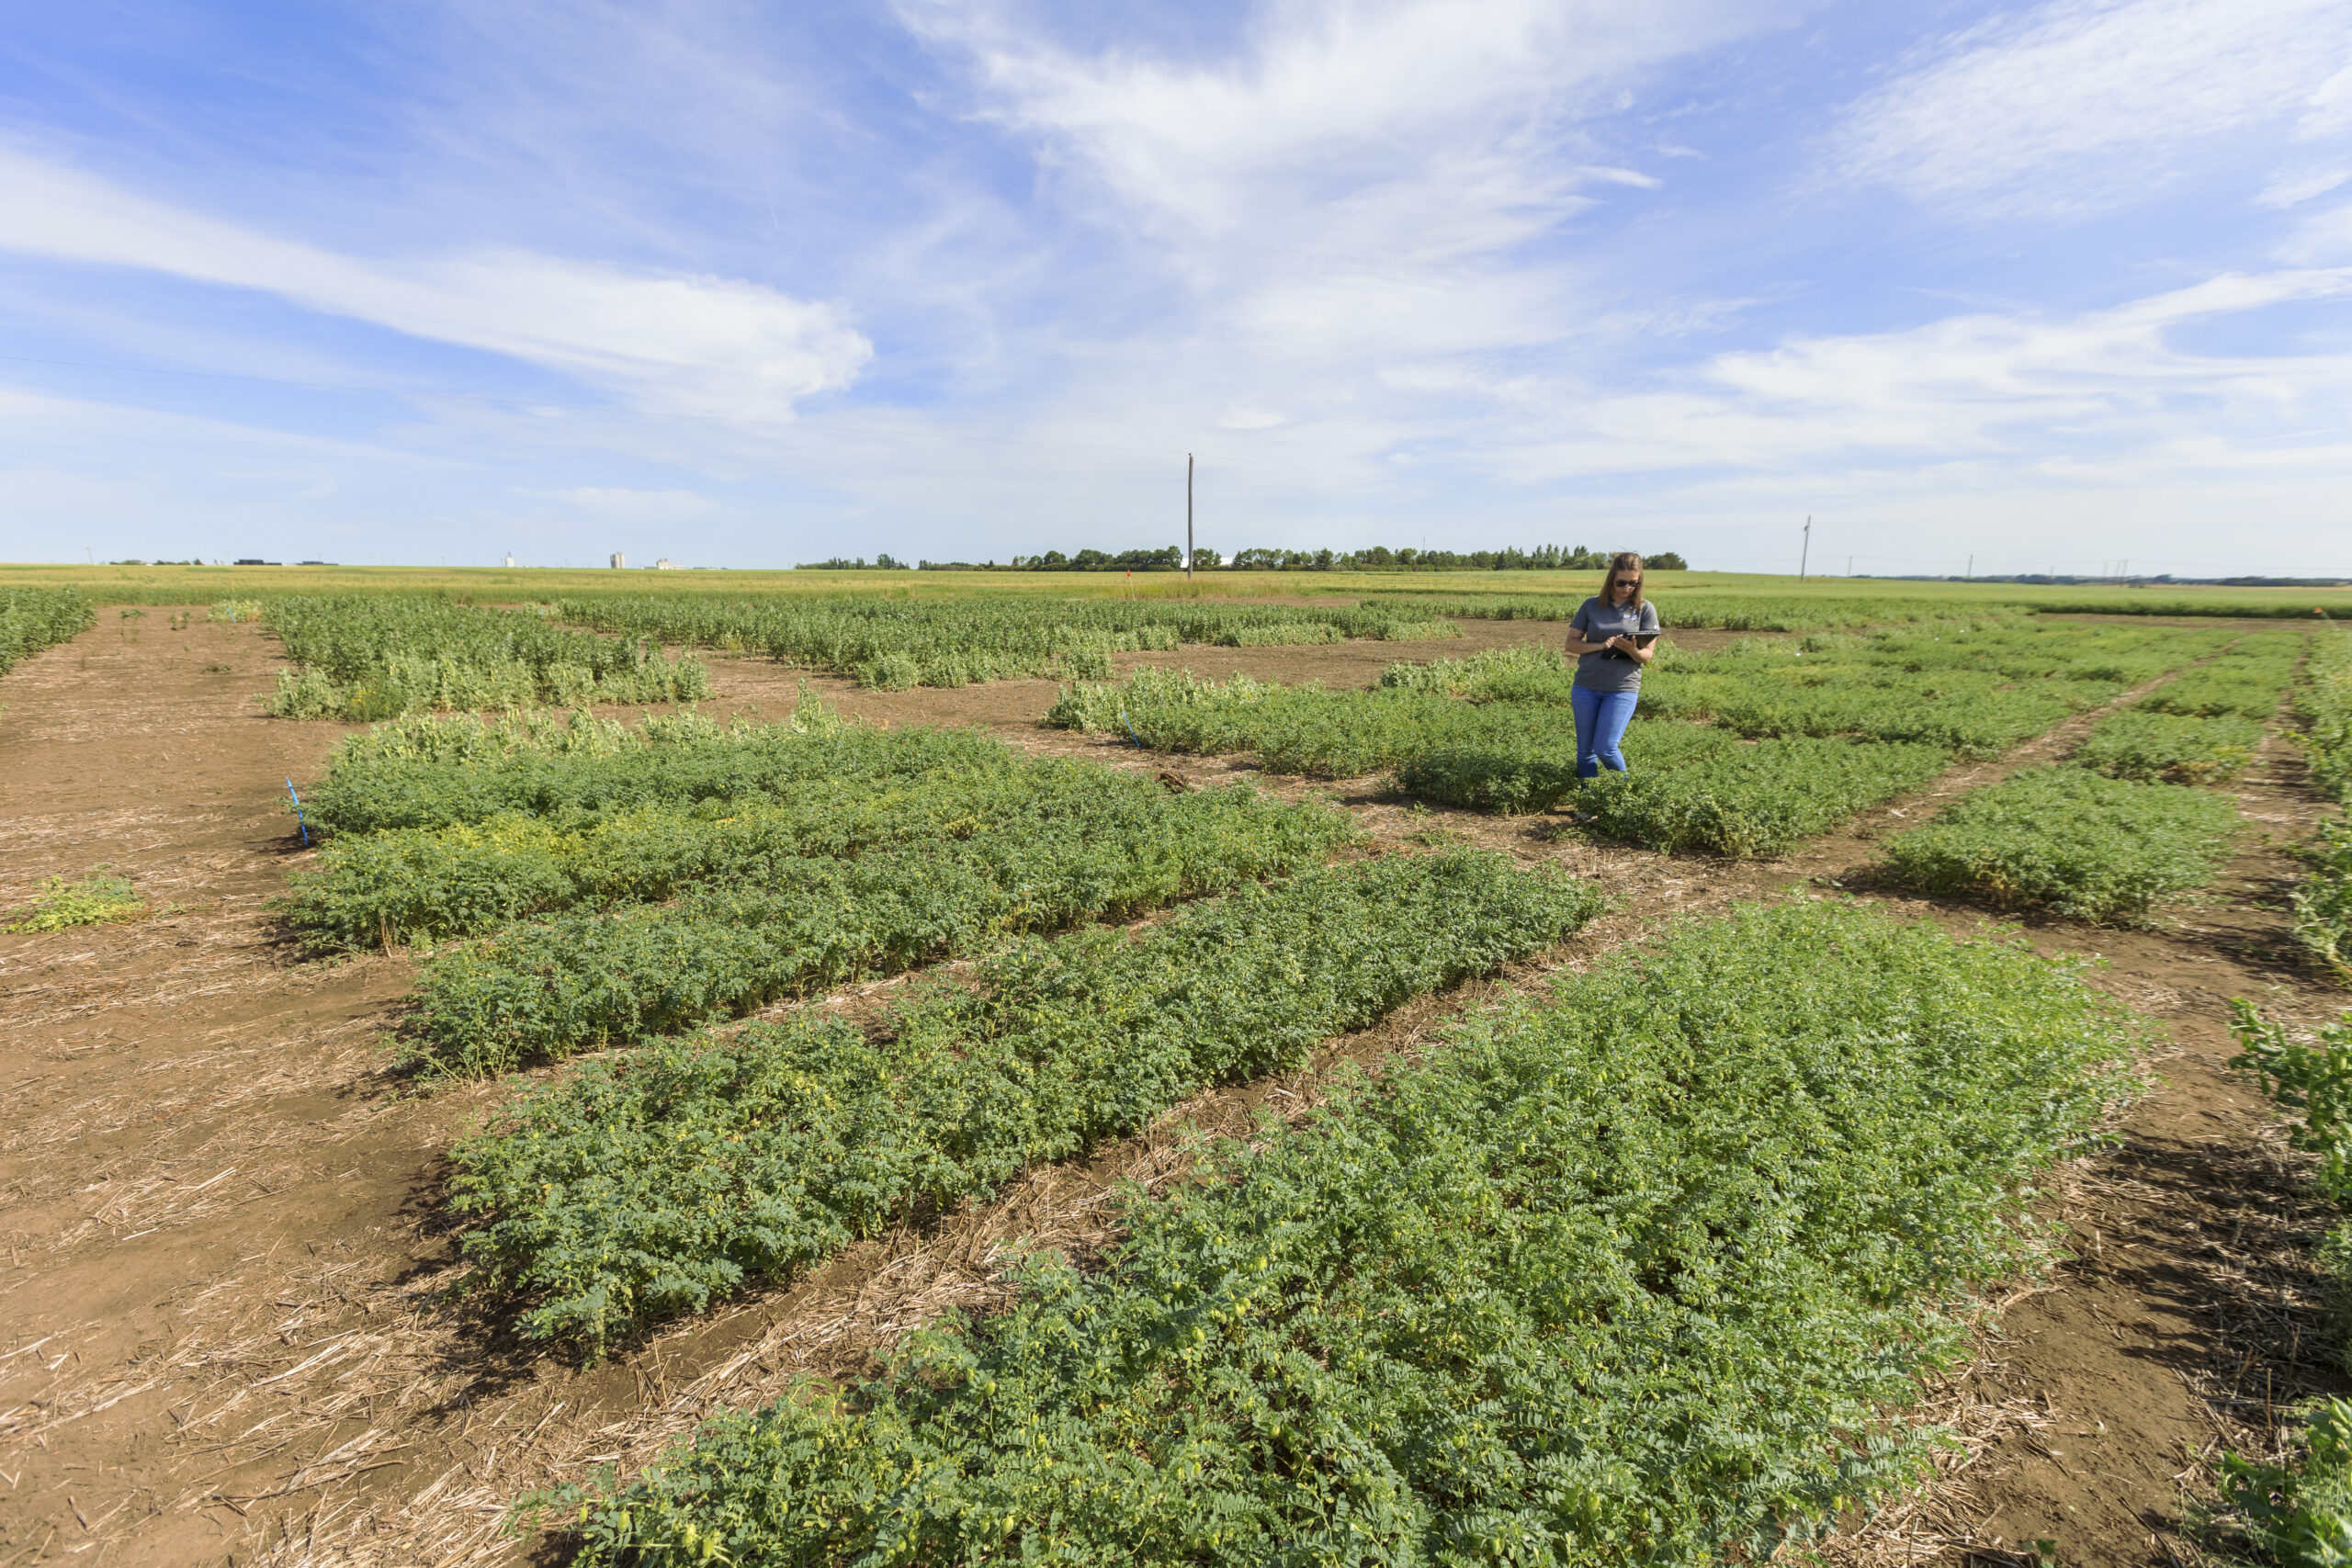
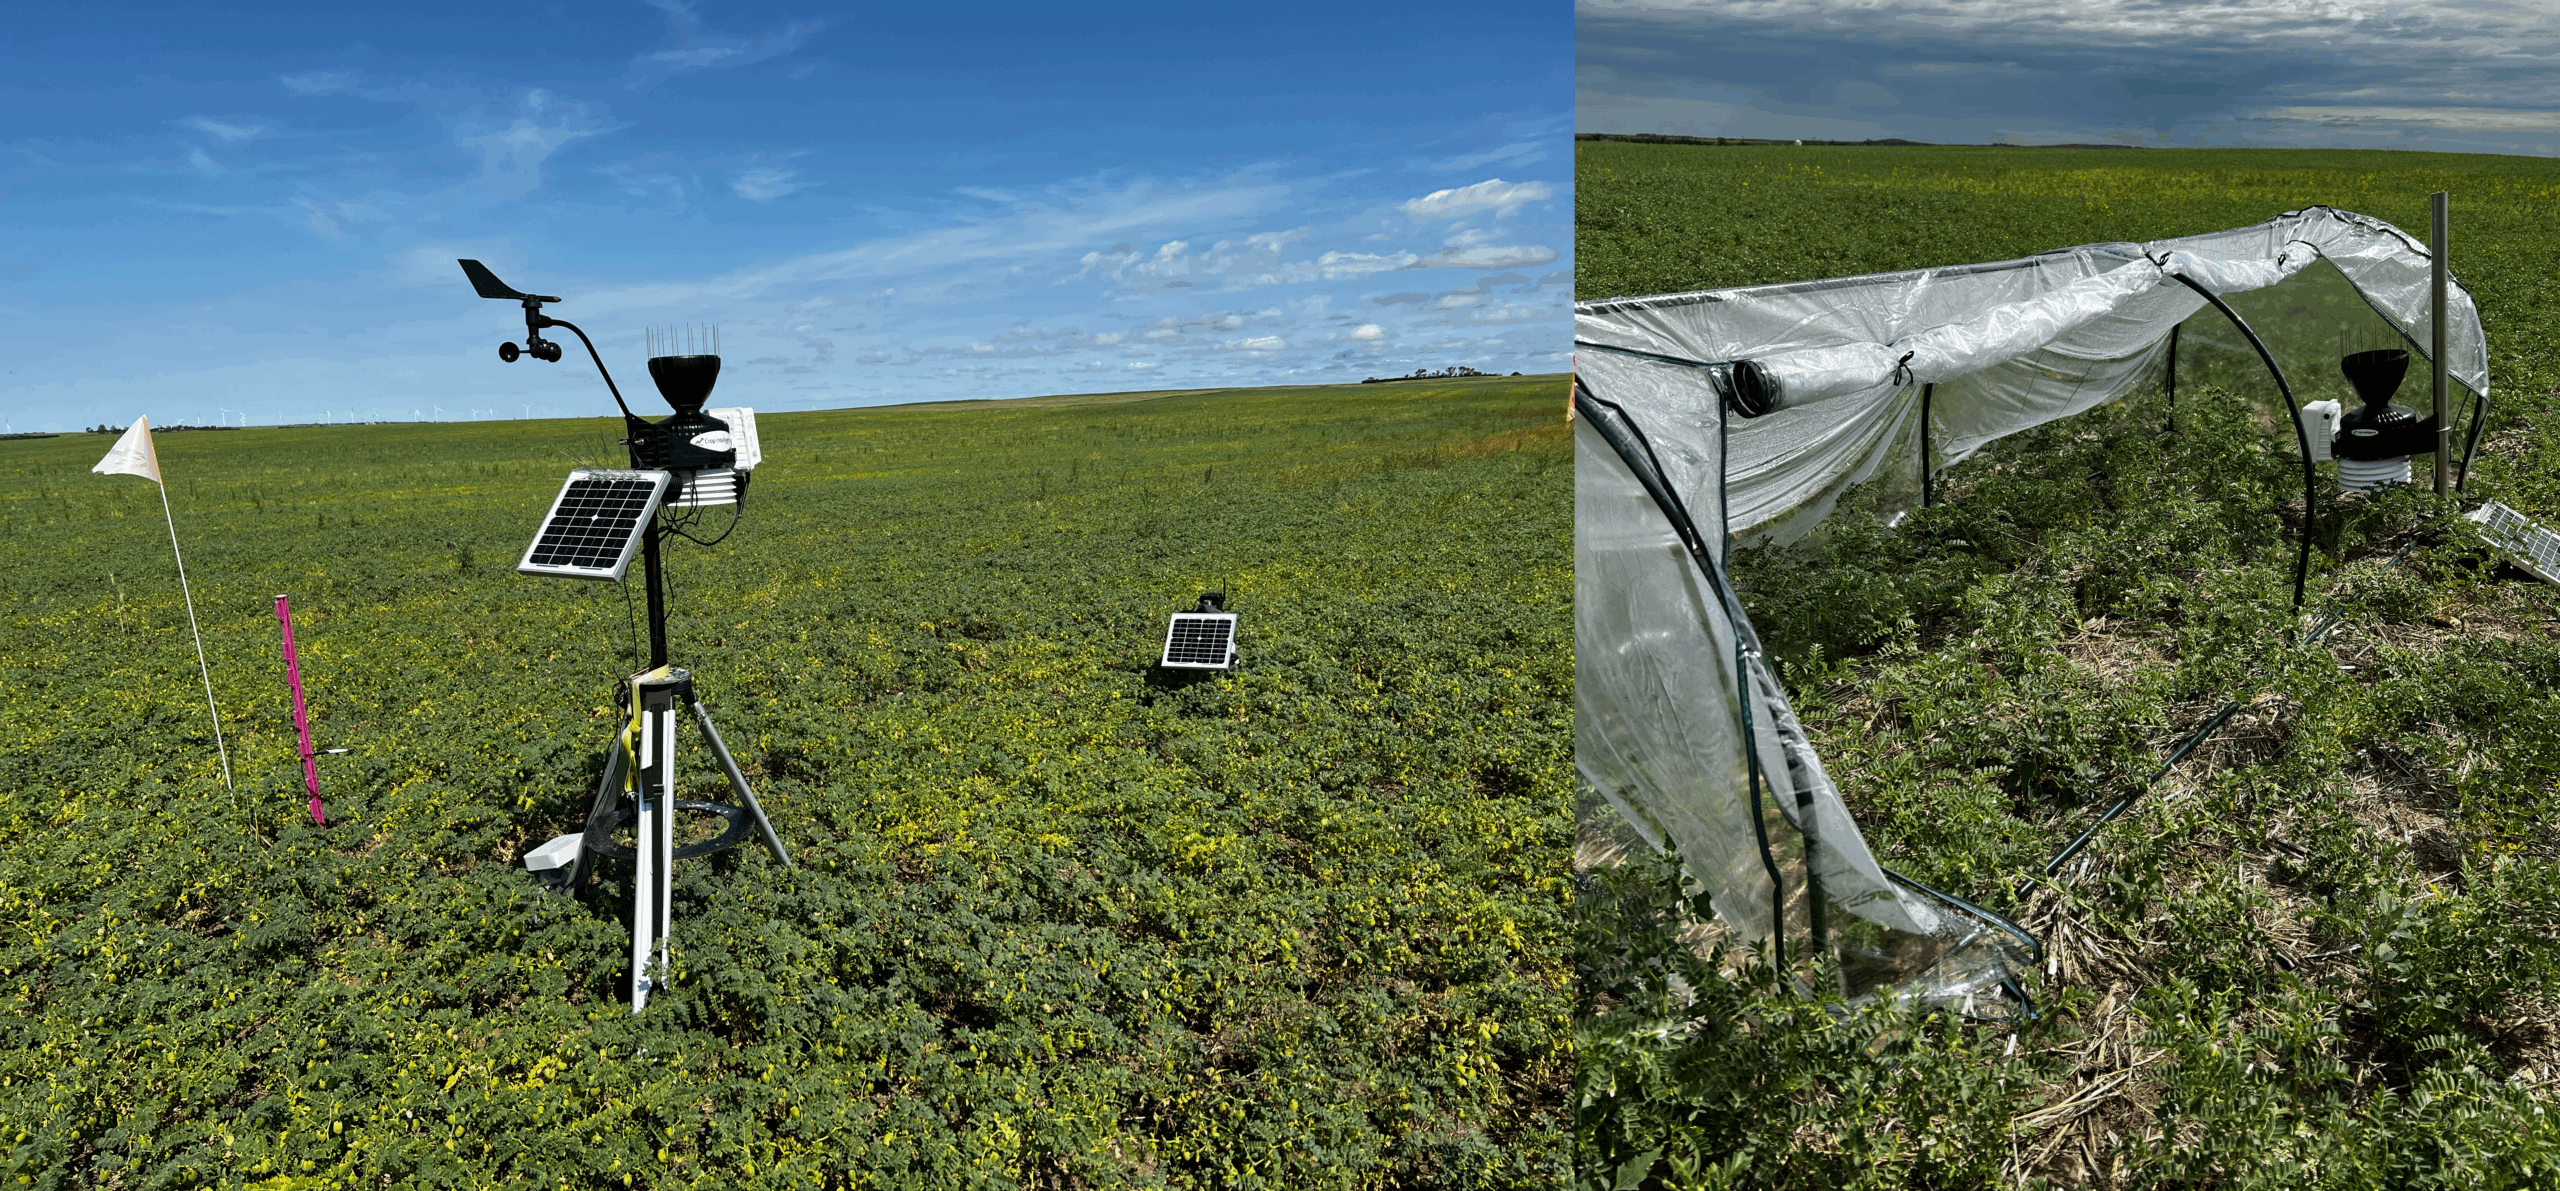
In response to these findings, chickpea fields in five regions with previously reported cases—Gravelbourg, Mossbank, Assiniboia, Coronach, and Ogema—were designated for season-long monitoring. These locations have been observed intensively over four consecutive growing seasons (2021–2024), forming the backbone of the ongoing Chickpea Health Project. The Chickpea Health Project was initiated as a collaborative monitoring project with Crop Intelligence, with the primary aim of gaining a deeper understanding of the potential influence of environmental and soil moisture conditions on chickpea health issues. In 2020, the symptoms were mainly observed on CDC Orion and to a lesser extent in CDC Leader. Before symptoms appeared in 2020, limited rainfall in May and early June was followed by heavy rain in late June to early July, accompanied by high humidity. Symptoms emerged 2–10 days after rainfall, although the timing varied between years and locations, depending on the severity of rainfall events. Fields two miles away that missed both rains were unaffected and did not show any symptoms.
During the 2021 growing season, most field sites received above-average precipitation in May but experienced declining rainfall through June, resulting in severe moisture deficits by July. Only Ogema maintained near-average levels before all sites saw substantial moisture recovery in August. Temperatures were unusually high, particularly in July, with extended periods exceeding 28°C, which impacted crop water use and yield. Water availability is a key driver of crop productivity, making the measurement of Crop Available Water (CAW) essential for estimating the Water Driven Yield Potential (WDYP)—the theoretical yield assuming full soil moisture access and average seasonal rainfall. WDYP is influenced by Management Factors (MF), which reflect the number of bushels produced per inch of available water. These factors vary by crop, season, and farm; for example, lentil typically has an MF of 4, while field pea is around 6.
CAW and WDYP varied by site, with chickpea yields generally aligning with MF expectations for chickpeas, except at Ogema and Gravelbourg, which recorded MFs of five and two, respectively. Despite starting with the highest CAW, Gravelbourg exhibited shallow root development (30 cm) and the lowest yields, which may have been due to extreme heat, limited rainfall, and soil sodium issues. In contrast, deeper rooting (up to 70 cm) and higher yields were observed at Ogema and Mossbank. Overall, yield was positively correlated with rainfall (r = 0.98, t(3) = 8.9, p = 0.003) and negatively correlated with high temperatures (r = -0.87, t(3) = -3.05, p = 0.0505), with Ogema achieving the highest chickpea yields and Gravelbourg the lowest, mainly driven by differences in environmental stress and soil conditions. Although the severity of the chickpea health issue was generally lower than observed in seasons prior, with many fields being considered primarily healthy in the context of the chickpea health issue, symptoms could still be found in the majority of fields surveyed when specifically sought out. The average, overall rating of severity in 2021 across all surveyed fields was 2.3.
In 2022, weather stations and soil probes were installed at chickpea fields within 14 days post-seeding to monitor environmental conditions, although Gravelbourg missed this target due to equipment issues; winter soil moisture recharge varied widely by region, and while May precipitation was above average at some sites, June was dry, with modest rainfall recovery in July and cooler in-season temperatures compared to 2021. Rooting depth varied across sites, with Gravelbourg again showing shallow root development and poor yield efficiency, while Ogema achieved the highest yields with moderate rooting and better access to moisture. WDYP and MF analyses indicated a strong negative correlation between high temperatures and yield efficiency, with Ogema achieving an MF of 3.9 and Gravelbourg only 2.4. Despite humidity being considered a potential trigger for chickpea health symptoms, tenting and saturation experiments failed to induce symptoms, possibly due to insufficient environmental stress. Across all sites, chickpea yields averaged 31 bu ac⁻¹, up from 2021, with the highest yields at Ogema and the lowest at Gravelbourg, primarily driven by differences in rainfall amounts and exposure to extreme heat during flowering and pod development.
By 2023, symptom severity was observed to be higher in drier years (2021 and 2023), suggesting a link to drought stress. Among cultivars, CDC Leader showed more severe symptoms than CDC Orion, a reversal of earlier observations in 2019. Although initially thought to be related to Ascochyta blight, experiments indicated no significant difference in A. rabiei susceptibility between these two cultivars. While it is now accepted that the Chickpea Health Issue is distinct from Ascochyta blight, it may be influenced by environmental stress and interactions with disease resistance traits. One proposed explanation for the differing symptom severity between CDC Orion and CDC Leader is the variation in their flowering timelines, as symptoms associated with the Chickpea Health Issue often emerge around the flowering stage. In chickpeas, resistance to Ascochyta blight appears to decline once the plants enter flowering, making them more susceptible to infection and other stress-related damage during this developmental window. However, it is unclear whether this is due to inherent chickpea resistance to Ascochyta blight or when the disease is present. CDC Orion has been observed to flower approximately two days earlier than CDC Leader, which may result in CDC Orion encountering vulnerability to both the emerging chickpea health issue and Ascochyta blight slightly ahead of CDC Leader. When symptoms are assessed at a single point in time, this could make CDC Orion appear more severely affected, simply because it is further along in the progression of symptoms. Furthermore, the earlier onset of flowering in CDC Orion may contribute to earlier and potentially more severe development of Ascochyta blight, which could compromise the plant’s ability to tolerate additional stressors, thereby amplifying the severity of observed symptoms. Due to this, the pathogen’s high virulence, severity, and polycyclic nature, it is now recommended that chickpeas be sprayed at an earlier growth stage for Ascochyta – specifically, that scouting start at the 8-node stage, rather than waiting until flowering. As soon as the early symptoms of ascochyta blight – tiny black dots resembling dirt – appear, spraying is recommended, especially if conditions are conducive to disease development.
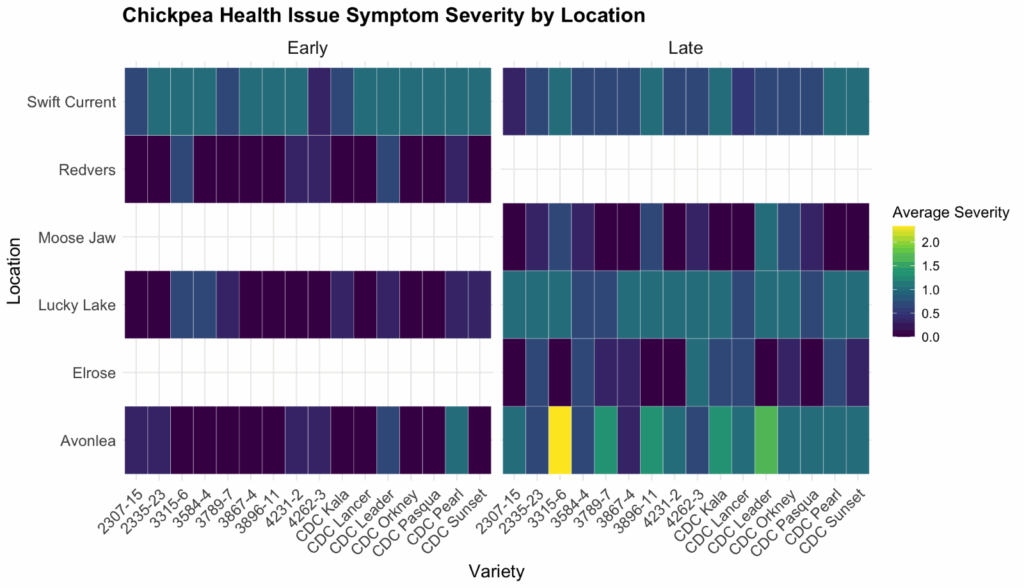
In 2024, surveys of small plot variety trials were organized by Saskatchewan Pulse Growers to assess symptom severity of the chickpea health issue across cultivars and timings. Saskatchewan Pulse Growers staff surveyed plots located in Redvers, Avonlea, Moose Jaw, Lucky Lake, Elrose, and Swift Current at two time points, early July and late July, to monitor varietal differences in symptoms and track plant symptoms to determine if they were mobile or static throughout the season. A linear mixed-effects model was used to assess differences in symptom severity across timing and variety, while controlling for random effects due to location differences and repeated measures between early and late timings. Results indicated a consistent and significant trend of increased severity recorded during late timing compared to early timing at all sites (t = 6.99, df = 127, p < 0.001). However, surveys were only received for early timing at Redvers and late timing at Moose Jaw and Elrose (Figure 1). The average symptom severity across all sites for early timing was 0.35, while late timing had an average rating of 0.67, nearly double that of early timing. Results demonstrated that CDC Leader showed a significantly increased average symptom severity (t = 2.56, df = 122, p = 0.011), as well as an unnamed variety (3315-6) (t = 2.8, df = 122, p = 0.006) compared to the variety demonstrating the smallest average symptom severity (unnamed variety 2307-15).
Overall, season-long monitoring has yielded valuable insights into how factors such as soil water availability, rooting depth, cultivar phenology, and past crop rotations influence symptom severity and yield outcomes. However, although these results demonstrate that much has been learned surrounding the chickpea health issue, there are still substantial gaps in the general understanding of how this issue affects chickpea development. There is still much to be learned about chickpea water usage, root development, yield potential, and the environmental impact on the initiation and progression of chickpea health issues. Ultimately, ongoing collaboration between researchers, agronomists, and growers will be essential to uncover the underlying mechanisms and develop reliable mitigation strategies. A continued, data-driven approach will not only support but also enhance chickpea productivity in Saskatchewan. Still, it may also offer valuable insights for pulse crop production in other regions facing similar emerging health concerns.