Background
Faba beans have high requirements for phosphorous and export large amounts phosphorus in the grain. A 50 bushel per acre faba bean crop has been estimated to remove 55-67 pounds (lb) of phosphorus in the seed, with a total uptake of 89-108 lb of phosphorus. Access to phosphorus in the soil through high soil phosphorus levels, or in combination with applications of fertilizer, is important for balancing nutrient management. Knowing the levels of safe rates of phosphorus that can be applied with the seed and the response of faba beans to side-banding phosphorus is important.
Previous work in Saskatchewan at Outlook, Melfort, and Saskatoon by Henry et al (1995), evaluated phosphorus rates up to 44 kilograms per hectare (kg/ha) and found faba beans to be the most tolerant to seed-placed phosphorus compared to peas and lentils. The research compared side-banding to seed placement and found that faba bean plant establishment was not affected by phosphorus placement. Faba bean seed yield was the most responsive to phosphorus fertilizer compared to peas and lentils, especially under irrigated conditions. The response was more consistent with side- banding than seed-placed phosphorus when all three crops were considered. Seed phosphorus concentrations were generally independent of placement method suggesting that the effect of seed placement is related to the effect on stand density. This project was carried out using a press drill, an older variety of faba beans (Erfordia), and some of the sites were fallow.
In 2015, Indian Head Agricultural Research Foundation (IHARF) evaluated the response of faba beans to seed-placed and side- banded phosphorus fertilizer at 25 and 50 kg/ha phosphorus pentoxide. There was no difference between the placement methods or rates on establishment in this single site project. There was an indication of higher yields and larger seed size at higher phosphorus rates. Further research was suggested using rates higher than 50 kg/ha for future projects.
Purpose
The objectives of the 2016 and 2017 phosphorus response in faba bean project were to:
- Determine faba bean response to higher rates of phosphorus fertilization in low phosphorus soils under zero till
- Confirm faba beans respond similarly to seed-placed (in-furrow) and side-band placement of phosphorus fertilizer at higher rates of phosphorus
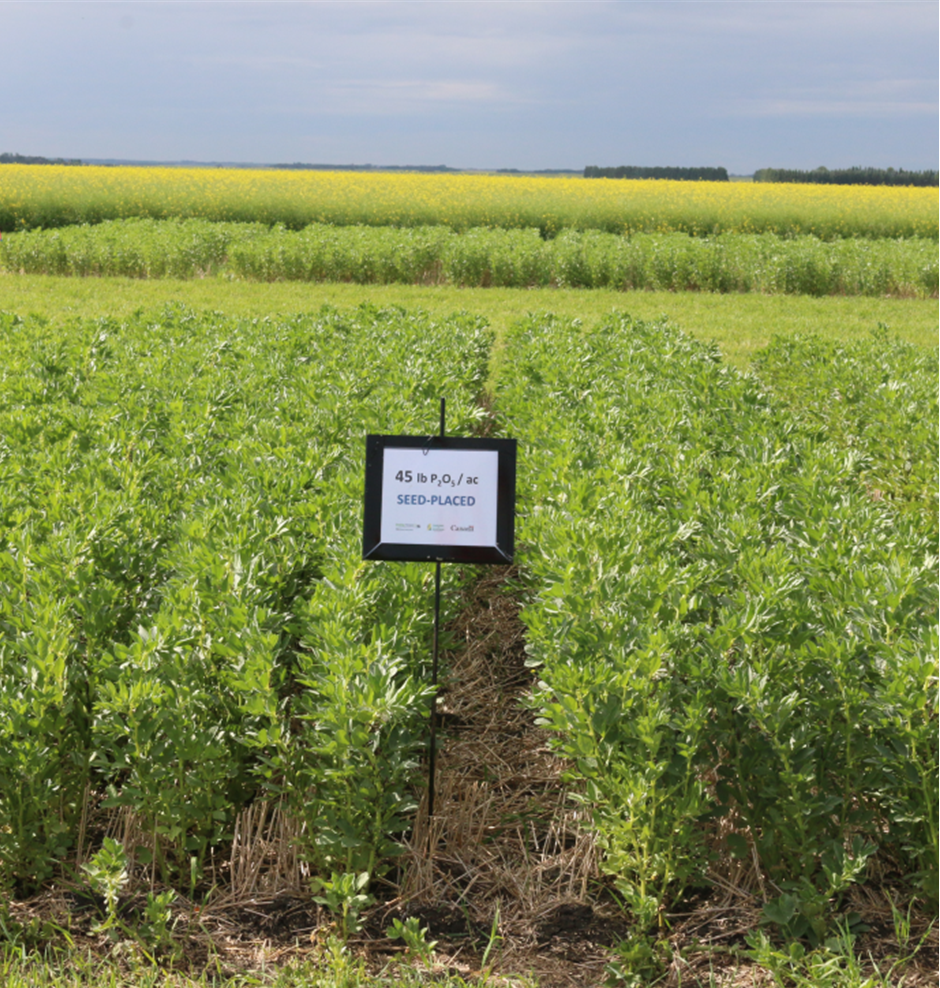
- Demonstrate the maximum safe rates of seed-placed monoammonium phosphate with faba beans when seeded into clay soils using a hoe drill, with low seed-bed utilization
Design of Experiment
The project was carried out by IHARF in 2016 and 2017. The trial was structured as a randomized complete block design with four replicates, two placement methods (seed-placed vs side-banded), and five phosphorus rates (0-80 kg phosphorus pentoxide per acre or 0-71 lb phosphorus pentoxide per acre).
In both years Snowbird (zero-tannin) faba beans were direct- seeded into standing cereal stubble in early May, using a SeedMaster plot drill equipped with eight openers on 30 centimetres (cm) (12 inch) row spacing. With an opener width of 16 millimetres (mm) (5/8 inch), the theoretical seed-bed utilization with this drill is less than six per cent. Seeding rate targeted 50 viable seeds per square metre (m2).
For the side-band treatments, fertilizer was placed 38 mm (1.5 inches) beside and 19 mm (3/4 inch) below the seed. The target seeding depth was approximately 38 mm (1.5 inches) and, although both springs were relatively dry, the seed was always placed into moisture.
Weeds were controlled using registered pre-emergent and in-crop herbicide applications, and fungicide was applied at mid-bloom to minimize the potential for disease. Pre-harvest glyphosate was applied at physiological maturity and the centre five rows of each plot were straight-combined.

Emergence was measured at two pre-determined intervals (targeted 15 and 30 days after seeding) by counting the number of seedlings in two separate 1 metre sections of crop row per plot. On the first measurement date, the sample areas were marked so that the same sections of crop could be reassessed at the later date. Yields were determined from the harvested grain samples, which were corrected for dockage and adjusted to 16% seed moisture content. Seed size was determined by counting and weighing a minimum of 200 seeds to determine thousand kernel weights. Weather data were estimated from a private weather station located approximately 2 kilometres (km) from the field trial site in 2016, and from an Environment Canada station approximately 3 km from the site in 2017.
All response data were analyzed using the mixed procedure of Statistical Analysis System, with the effects of year (Y), phosphorus treatment (P), and their interaction considered fixed, while replicate effects were considered random. Tukey’s standardized range test, which controls experiment-wise error and tends to be relatively conservative, was used to compare all possible combinations of individual treatments. Contrast comparisons were used to evaluate the control against all fertilized plots and seed- placed versus side-banded phosphorus. Orthogonal contrasts were used to determine whether the responses to seed-placed and side- banded phosphorus were insignificant, linear, or curvilinear (quadratic). All treatment effects and comparisons were considered significant at P ≤0.05.
Composite soil samples were collected from the study area each spring and submitted to AgVise Laboratories for analysis. Soil potential hydrogen (pH) for the upper 15 cm was 7.4-7.8 with 5-6% organic matter, and a relative high cation exchange capacity of 39- 47 monoethylene glycol. The soil is classified as an Indian Head heavy clay with clay-loam to clay surface textures. Residual nitrate nitrogen concentrations were moderately low (19-24 kg/ha) while sulphur and potassium were considered unlikely to be limiting at 47-78 kg/ha and 606-725 parts per million (ppm), respectively. Residual soil phosphorus was quite low at 4-9 ppm (Olsen-P), or approximately 7-16 kg/ha extractable phosphorus.

Results
There was no effect of increasing rates of seed placed phosphorus on plant establishment in either year. Both side-banded phosphorus and seed-placed phosphorus treatments had similar plant populations across all rates of phosphorus fertilizer at 15 days after seeding (Figure 2), and 30 days after seeding (data not shown).
Seed yields were affected by year and by phosphorus treatment but with no interaction, thereby suggesting that the phosphorus response was consistent, despite the contrast in weather between the two seasons. Even after hail damage in 2016, the overall average yield was 4,213 kg/ha, compared to 2,571 kg/ha under the much drier conditions of 2017. For both years and placement methods, there was significant linear yield increases with increasing phosphorus rates (Figures 3 and 4).


Averaged over the two years, yields increased linearly by 440 kg/ha (14%) as the phosphorus rate was increased from 0-80 kg/ha (Figure 5). There were no apparent yield differences associated with phosphorus placement for individual years or when averaged across years. However, the strong response in 2017 was not necessarily unexpected as phosphorus mobility and mineralization throughout the season are reduced under dry soil conditions.
Results for phosphorus treatment effects on faba bean seed weight (grams per 1,000 seeds) were reasonably consistent over the two years, with a slight reduction in seed size as phosphorus rate increased (Figure 6). This suggests the yield increases associated with phosphorus fertilization were not due to larger seed size, but rather were attributable to some other factor (ex. more pods per plant or more seeds per pod).


Table 1. Economic returns of increasing phosphorus rates based on results from 2015 to 2017 at Indian Head.
| Phosphorus | 2015 | 2016 | 2017 | |||||||
| Estimated Yields, bu/ac | Gross Return, $/ac | Net Return, $/ac | Estimated Yields, bu/ac | Gross Return, $/ac | Net Return, $/ac | Estimated Yields, bu/ac | Gross Return, $/ac | Net Return, $/ac | ||
| P Rate, lbs/ac (kg/ha) | Cost of P, $/ac | |||||||||
| 0 | 0 | 41.5 | 0 | 0 | 58.2 | 0 | 0 | 35.8 | 0 | 0 |
| 17.8 (20) | $8.37 | 45.0 | $22.87 | $14.51 | 60.2 | $12.99 | $4.63 | 36.8 | $6.66 | -$1.70 |
| 35.6 (40) | $16.73 | 48.5 | $45.75 | $29.02 | 62.2 | $25.99 | $9.25 | 37.8 | $13.33 | -$3.40 |
| 53.4 (60) | $25.10 | 52.0 | $68.62 | $43.52 | 64.2 | $38.98 | $13.88 | 38.9 | $19.99 | -$5.11 |
| 71.2 (80) | $33.46 | 66.2 | $51.97 | $18.51 | 39.9 | $26.66 | -$6.81 | |||
P at $0.47/lb; Faba bean price of $6.50/bu.
Estimated yields based on linear response curves and data for 2015 extrapolated to match phosphorus application rates used in 2016 and 2017 (see Figure 7). Gross return is based on the value of increased yield resulting from the addition of phosphorus. Net return is the gross return minus the cost of phosphorus.
Economic Implications
Overall, the results from this project suggest that faba beans will increase in yield when phosphorus fertilizer is applied where soils are low in phosphorus. The yield increases were as high as 14%, but the actual responses can vary from year-to-year and field-to-field. It is not only the yield response that is important, but the economic returns are the ultimate goal. Table 1 outlines the economic returns obtained with increasing phosphorus rates by year, including the 2015 trial data.
To evaluate the economics related to faba bean response to increasing phosphorus fertilizer, there are many factors involved including the price of phosphorus fertilizer, sale price, and yield potential for the crop. Environmental conditions influence yield potential but are out of grower’s control. Table 1 demonstrates the impact on net returns of different response curves from the faba bean studies at Indian Head from 2015 to 2017. The data from this table is based on the linear response curves as shown in Figure 7.

Yields differed by year and were highest in 2016, followed by 2015, and then lowest in 2017. Response to phosphorus fertilizer was the greatest in 2015, as shown by the steeper slope of the linear response curve, and least responsive in 2017.
Using linear response curves we can estimate net returns for each year of the study at Indian Head. In 2015 the phosphorus rates used were 25 and 50 kg/ha, and numbers were extrapolated to match the 2016 and 2017 rates as shown in Table 1. Gross return is used as the value of increased yield of faba beans in response to the addition of phosphorus fertilizer, compared to the control where no fertilizer was added. The net returns are the gross return minus the cost of the phosphorus fertilizer. Phosphorus fertilizer pricing for these calculations was $0.47 per lb, based on industry suggested pricing. The price of faba beans used is $6.50, based on average estimates obtained from industry and growers.
Economic results from Table 1 demonstrate the value of phosphorus fertilizer, especially when yield potential is higher (2016) and when there is higher response to phosphorus (2015). When yields were limited due to environmental conditions the net returns to phosphorus fertilizer were not attractive.
As the response in each year differs it is difficult to combine into an average response. In general we can say that there is a positive return to using phosphorus fertilizer with faba beans when the environment cooperates. Even in a year when yields are limited, the cost of the additional phosphorus fertilizer only resulted in slightly negative net returns at even the highest phosphorus rates (up to a loss of $6.81). When conditions are favourable for growing faba beans, the net returns from increasing phosphorus rates can be very attractive.
The price of phosphorus fertilizer can also influence economics. As price increases, the application costs increase and net returns decrease. As phosphorus fertilizer costs decrease, the potential net returns increase and it is more attractive to go after higher yields with higher phosphorus rates. The price of faba beans also comes into play with economics. To make the 2017 results neutral in terms of net returns, it takes faba bean prices to be $7 per bushel (bu) and phosphorus fertilizer to be $0.40.
Recommendations Based on Trial
In terms of safe rates of seed-placed phosphorus, the Saskatchewan Ministry of Agriculture suggests that rates should not exceed 25 kg/ ha with narrow openers. Saskatchewan Pulse Growers suggests a maximum safe seed-placed rate of 40 kg/ha assuming seedbed utilization of 10-15%. Despite the lack of injury observed at higher rates in the current project and previous Saskatchewan research, growers are not advised to exceed the current recommendations when seed-placing phosphorus. Regardless of the inherent crop sensitivity, seedling injury associated with phosphorus fertilizer toxicity is affected by several environmental factors and, as such, can vary dramatically from year-to-year and also across spatially variable landscapes. There is also the potential for antagonistic effects of high rates of seed-placed fertilizer on rhizobial inoculants with pulse crops however, this is not something that was specifically assessed in the current project or cited research.
Faba beans tolerate high amounts of seed-placed phosphorus fertilizer as demonstrated by this project, but it is only one location over two years. These results should not be taken to suggest that high rates of seed-placed phosphorus (ex. >40 kg/ha) will be safe under broader circumstances.
Results were generally consistent with past research which has shown faba beans to be relatively responsive to phosphorus fertilizer application compared to other traditional pulse crops. While published research on phosphorus management for faba beans is limited, this crop removes high amounts of phosphorus in the grain. Assuming the objective for a grower is to maintain or build residual soil phosphorus, then a grower should be applying phosphorus based on removal rates of the crop. A 50 bu/ac faba bean crop removes 55-67 lb phosphorus pentoxide in the seed which means 55-67 lb should be applied to keep a balance of nutrients in the field.
Future Research
The greatest limitation of the current project is that it was conducted over a relatively short period, a single geographic location, using a single drill configuration, and always on fields with low residual phosphorus. Broadening the scope of the work would provide insights into the potential for seedling injury (with high rates of seed-placed phosphorus) in coarser textured, lower organic matter, or low pH soils. Field sites with a broader range of residual phosphorus levels (ex. including fields with moderate and high concentrations of extractable phosphorus) would provide more information on the ability of soil tests to predict the likelihood of yield responses to fertilization. However, many growers are shifting towards managing phosphorus from a long-term perspective, seeking to maintain or build overall fertility over extended periods of time.
Further work with more sites on the response of faba beans to higher rates of phosphorus fertilizer is warranted. The yield response under good growing conditions did not level off as is expected when maximum response rates are exceeded.
Acknowledgements
Project Lead: Chris Holzapfel, MSc, PAg
Project Funding
Saskatchewan Pulse Growers (SPG)
This project was supported by the Agricultural Demonstration of Practises and Technologies (ADOPT) initiative under the Canada- Saskatchewan Growing Forward 2 bi-lateral agreement.