Published March 2023
Background
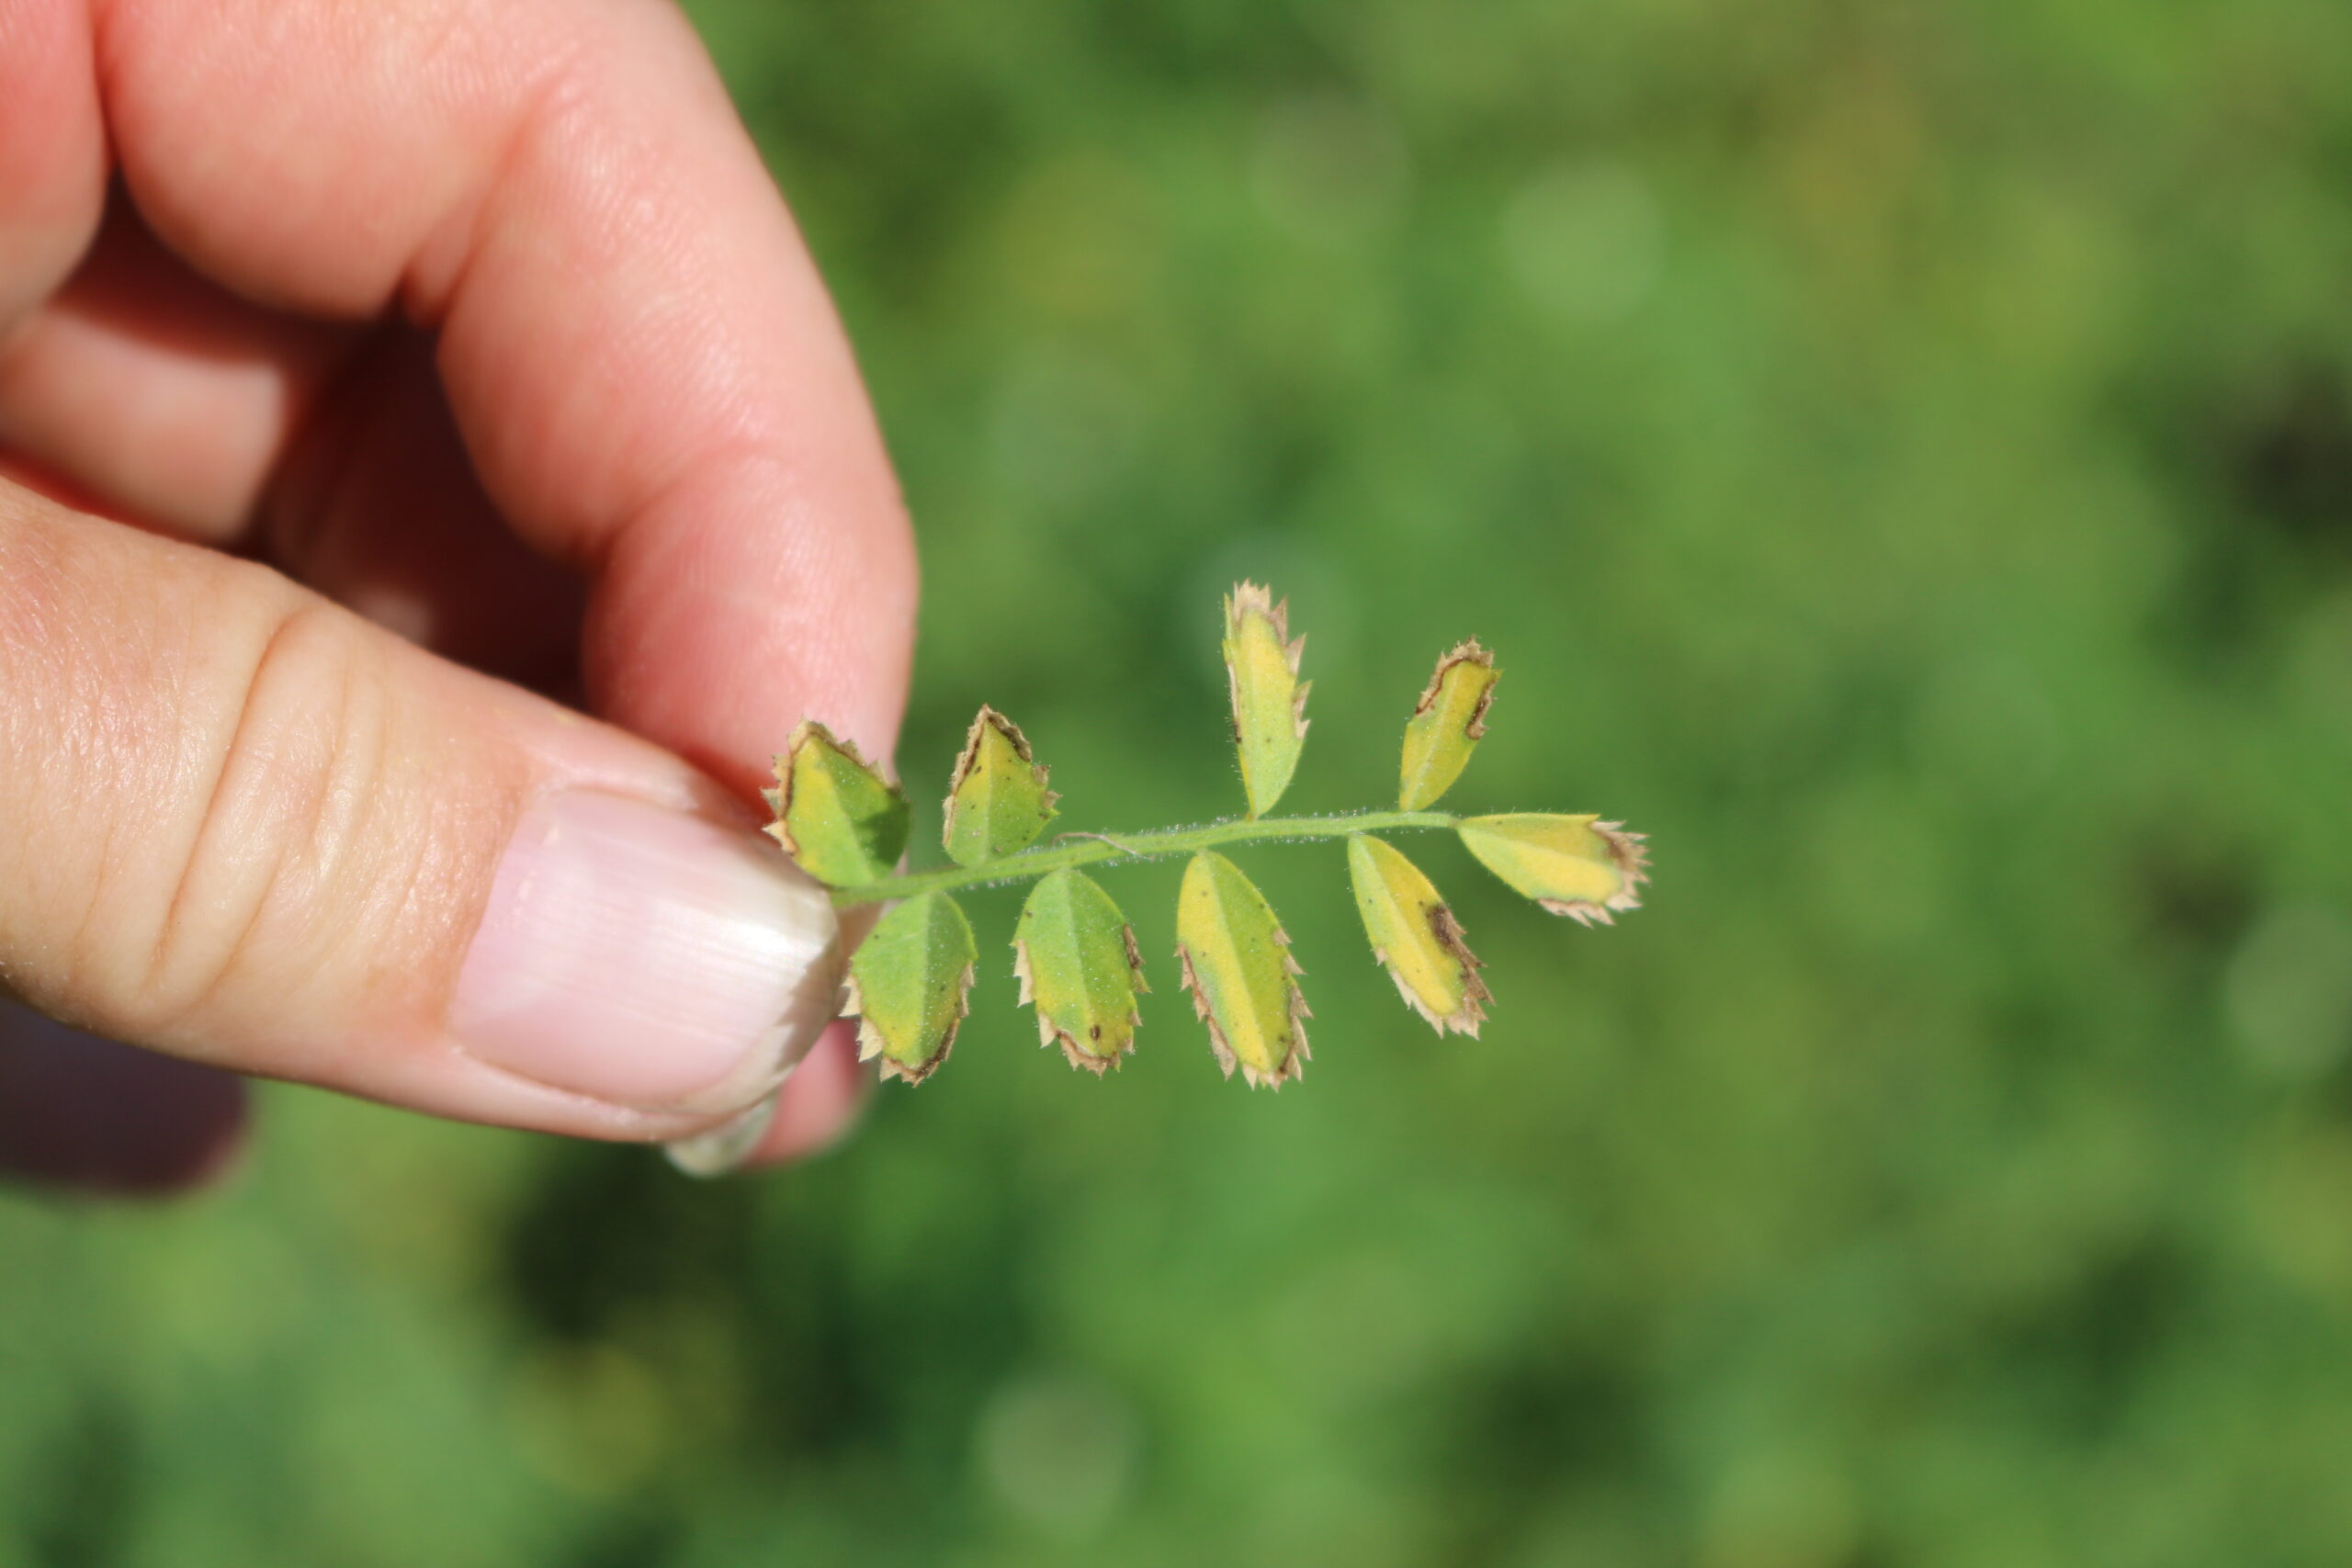
Saskatchewan Pulse Growers (SPG) teamed up with Crop Intelligence for a second season of The Chickpea Project, a collaborative field monitoring project initiated during the 2021 growing season. Initially motivated by a plant health issue in chickpea first reported in 2019, the Chickpea Project aimed to better understand the potential influence of environmental and soil moisture conditions on the chickpea health issue. Although a definitive cause of the chickpea health issue remains unknown, this monitoring project has provided valuable agronomic insights into the environmental responses, growth, and development of chickpea in Southern Saskatchewan.
Key Findings
- There is still a lot to be learned about chickpea water usage, root development, yield potential, and the environmental impact on the initiation and progression of the chickpea health issue.
- Chickpea rooting depth varied between 30 and 70 cm.
- Management factors for chickpea averaged 3.24 and varied between 2.4 and 3.9 bushels per inch of crop-available water.
- Chickpea grown at the highest-yielding site did not root the deepest but received the most in-season precipitation, the lowest duration of heat above 28°C, and had the highest starting and ending amounts of crop-available water.
- Chickpea grown at the lowest yielding site had the shallowest rooting depth, received the least in-season precipitation, the greatest duration of heat above 28°C, and had the lowest starting and ending amounts of crop-available water.
Materials and Methods
Description of Sites

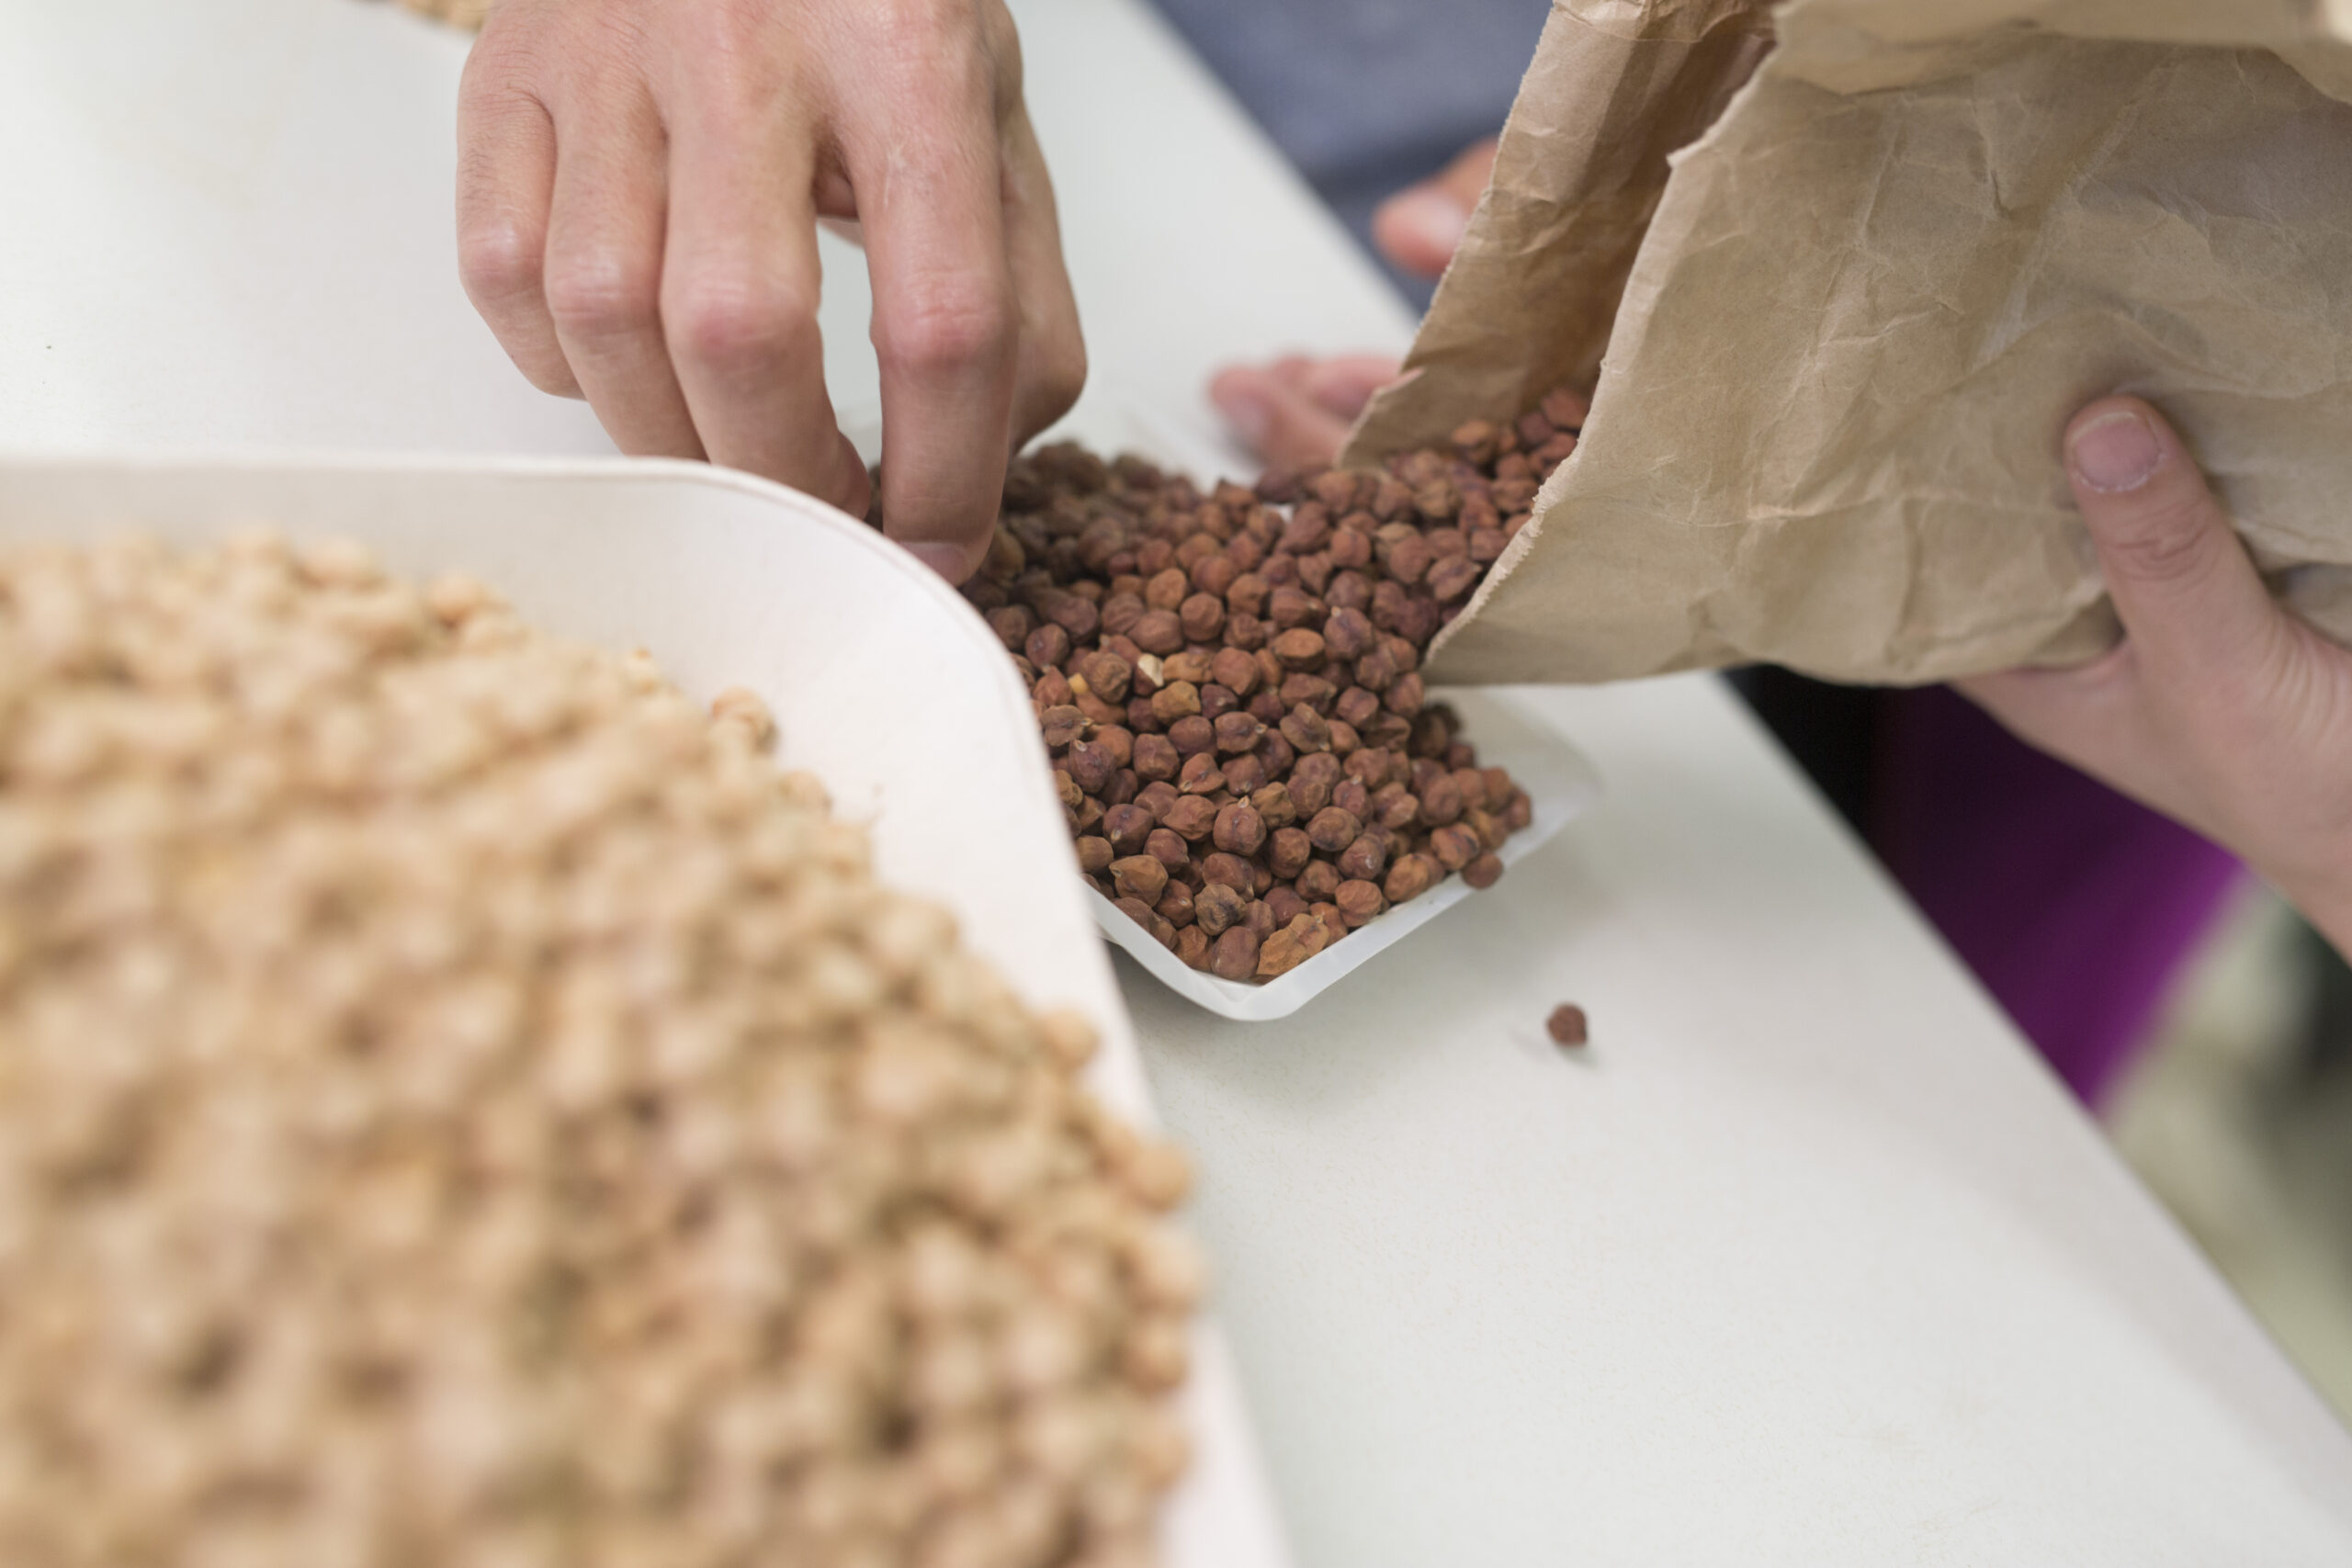
Five chickpea fields distributed throughout the region with previously reported chickpea health issues were selected as season-long monitoring sites during the 2022 growing season. All but one of these fields was managed by growers who also participated in the 2021 Chickpea Project . Fields were located near Gravelbourg, Mossbank, Assiniboia, Coronach, and Ogema, SK. Kabuli chickpeas (CDC Leader) were seeded at all five sites and were established on 2021 durum stubble (Gravelbourg, Assiniboia, Ogema), lentil stubble (Mossbank) and canola stubble (Coronach). Average final plant populations were 4.7 (Gravelbourg and Mossbank), 4.3 (Coronach), 4.2 (Ogema) and 4.0 (Assiniboia) plants ft-2.
Baseline soil properties and nutrient levels were determined through soil sample collection at benchmark locations corresponding to the weather station installation spots. These benchmark soil samples were collected at 0‒6, 6‒12, and 12‒24 inch depths and analyzed by A&L Canada Laboratories.
Table 1. Summary of baseline soil properties and nutrient levels chickpea monitoring sites.
| Site | Soil Texture | Sampling Depth (inches) | Soil Properties | Macro & Secondary Nutrients (ppm) | ||||||||
| SOM (%) | pH | CEC (meq/100g) | N | P | K | S | Mg | Ca | Na | |||
| Gravelbourg | Clay loam | 6 | 2.0 | 7.4 | 23.7 | 5 | 8 | 340 | 6 | 544 | 3650 | 13 |
| 12 | 1.7 | 7.7 | 28.9 | 8 | 7 | 236 | 8 | 673 | 4540 | 24 | ||
| 24 | 1.5 | 8.0 | 34.4 | 7 | N/A | 228 | 11 | 941 | 5180 | 50 | ||
| Mossbank | Clay loam | 6 | 2.8 | 7.1 | 28.3 | 9 | 13 | 414 | 10 | 649 | 3840 | 25 |
| 12 | 1.9 | 7.5 | 35.4 | 6 | 4 | 244 | 14 | 798 | 5610 | 26 | ||
| 24 | 1.6 | 8.0 | 36.7 | 5 | N/A | 199 | 20 | 1090 | 5390 | 61 | ||
| Assiniboia | Clay | 6 | 3.2 | 5.9 | 19.4 | 18 | 57 | 440 | 10 | 588 | 1930 | 37 |
| 12 | 2.6 | 6.4 | 21.7 | 16 | 11 | 255 | 9 | 1029 | 2220 | 57 | ||
| 24 | 2.6 | 7.2 | 36.7 | 18 | N/A | 240 | 9 | 1275 | 4670 | 110 | ||
| Coronach | Clay loam | 6 | 2.3 | 7.7 | 27.4 | 11 | 12 | 247 | 9 | 581 | 4380 | 19 |
| 12 | 2.1 | 7.6 | 44.4 | 17 | 6 | 133 | 426 | 1020 | 7060 | 78 | ||
| 24 | 2.2 | 7.9 | 39.1 | 12 | N/A | 155 | 37 | 858 | 6310 | 19 | ||
| Ogema | Clay loam | 6 | 2.7 | 6.1 | 14.6 | 11 | 29 | 451 | 12 | 461 | 1670 | 22 |
| 12 | 2.1 | 6.7 | 25.5 | 8 | 9 | 200 | 12 | 200 | 3760 | 32 | ||
| 24 | 1.6 | 7.3 | 27.1 | 9 | N/A | 170 | 14 | 170 | 3970 | 74 | ||
Weather Station Installment
Precise locations for the weather station installment were selected based on grower recommendations for representative areas within the field and using NDVI imagery. Above- and below-ground monitoring equipment were installed at the designated sites by a Crop Intelligence technician after the fields were seeded. The date of installation marked the beginning of data collection at these sites with moisture data being updated every 15 minutes. All Crop Intelligence equipment installations target a maximum window of 14 days after seeding to avoid excessive trampling of seedlings around the soil probes which can negatively impact plant development, rooting, and soil moisture data.
The Gravelbourg site was the only site where the 14-day goal was not met due to installation equipment issues. This grower had an additional Crop Intelligence station in a nearby field that was installed on May 4, 2022. The above ground data for May (rainfall and temperature) for the Gravelbourg chickpea station was extrapolated from this adjacent station.
Table 2. Dates of seeding, equipment installation, & harvest.
| Site | Seeding Date | Installation Date | Days Between Seeding & Install | Harvest Date | Days Between Seeding & Harvest |
|---|---|---|---|---|---|
| Gravelbourg | 16-May | 01-Jun | 16 | 03-Sep | 110 |
| Mossbank | 07-May | 19-May | 12 | 28-Aug | 113 |
| Assiniboia | 11-May | 18-May | 9 | 15-Sep | 127 |
| Coronach | 06-May | 12-May | 6 | 02-Sep | 119 |
| Ogema | 06-May | 12-May | 6 | 12-Sep | 130 |
2022 Environmental Conditions

Source: Crop Intelligence
The amount of soil moisture that was recharged over the winter months varied regionally with approximately 20 mm of winter recharge in the Gravelbourg area, 64 mm in Assiniboia, 75 mm in Coronach, 116 mm in Mossbank, and 179 mm in Ogema. These recharge values are regional estimates only and do not represent site-specific values as they were calculated by assessing the difference between crop- available water (CAW) that was recorded at the time of probe removal (November 2021) from the sites enrolled in the 2021 Chickpea Project and initial CAW at sites enrolled in the 2022 Chickpea Project.
Only Coronach and Mossbank received above-average precipitation during the month of May. It should be noted, however, that the Assiniboia site received a large rain prior to the installation of the station. Although the moisture from that rainfall event would have been captured in the soil readings, it is not reflected in the precipitation values. Precipitation levels fell below the thirty-year historical mean during June at all locations but increased in precipitation averages during July where the sites had received 62‒106% of the long-term average precipitation. Moisture levels remained at or below the historical means at all locations in August.
Relative to the 2021 growing season, in-season temperatures were generally cooler at all sites. This trend was particularly evident during July where 7‒15 days during the month and 31‒94 total hours reached temperatures greater than 28°C. On the high range, this equated to 10 days or 112 hours less of temperatures exceeding 28°C in 2022 compared to 2021. Humidity was also measured, in 15-minute intervals, throughout the course of this project with specific interest in humidity during flowering in July. Prolonged periods of high humidity, and not only rainfall events, have been observed as a potential environmental trigger to the onset of chickpea health symptoms. To date, specific criteria for intensity, frequency, and duration of humidity events has not been confirmed but it remains an important environmental consideration for symptom development of the chickpea health issue. The average minimum humidity during the month of July was 48.5% and the average maximum humidity during this period was 97.2% across all five site locations.
Table 3. Summary of temperature and precipitation data collected via Crop Intelligence weather stations at five chickpea monitoring sites during the 2021 growing season.
| Month | Environmental Conditions | Chickpea Monitoring Site | ||||
| Gravelbourg | Mossbank | Assiniboia | Coronach | Ogema | ||
| May | Temperature above 28°C (days) | 0 | 0 | 0 | 0 | 0 |
| Temperature above 28°C (hours) | 0 | 0 | 0 | 0 | 0 | |
| Total Precipitation (mm) | 45 | 48 | 6 | 71 | 22 | |
| June | Temperature above 28°C (days) | 4 | 4 | 4 | 5 | 4 |
| Temperature above 28°C (hours) | 26 | 18 | 19 | 23 | 18 | |
| Total Precipitation (mm) | 24 | 50 | 37 | 24 | 60 | |
| July | Temperature above 28°C (days) | 15 | 10 | 12 | 13 | 7 |
| Temperature above 28°C (hours) | 94 | 63 | 63 | 84 | 31 | |
| Total Precipitation (mm) | 63 | 83 | 68 | 63 | 96 | |
| August | Temperature above 28°C (days) | 22 | 16 | 17 | 21 | 8 |
| Temperature above 28°C (hours) | 143 | 105 | 110 | 124 | 50 | |
| Total Precipitation (mm) | 15 | 22 | 14 | 9 | 31 | |
| Total Season | Temperature above 28°C (days) | 41 | 30 | 33 | 39 | 19 |
| Temperature above 28°C (hours) | 263 | 186 | 192 | 231 | 99 | |
| Total Precipitation (mm) | 147 | 203 | 125 | 167 | 209 | |
Root Growth & Water Usage
CAW at the beginning of the season varied by site locations. Although yield is not determined by precipitation and soil moisture alone, crop access to water is an undeniably important contributor of yield. Measuring CAW is crucial to understanding the water-driven yield potential (WDYP) should the crop access all moisture in the profile and receive average rainfall throughout the season. The WDYP is not a static value across all crops, seasons, or farms. These differences are captured through individual management factors (MF) which estimate how many bushels can be grown for every inch of available water. These values can vary across farms and seasons, but it is typically assumed that lentil has a MF of four and field pea has a MF of six. Local data on chickpea is limited but the Crop Intelligence team assumed a MF equivalent to lentil estimates (four) heading into the season.
Post-harvest calculations revealed that the average MF across all sites was 3.24 during the 2022 season, indicating that an average of 3.24 bu ac-1 of chickpea was produced for every inch of CAW. The Ogema site (3.9 MF) was the most efficient at turning CAW into yield while the Gravelbourg site (2.4 MF) was the least efficient. Assiniboia (3.6 MF), Mossbank (3.3 MF) and Coronach (3.0 MF) were intermediate in their ability to produce yield from total available water. Data from these sites in the 2022 season indicates a strong correlation between MF and hours above 28°C during the months of May, June, and July as efficiency in water use and yield production per unit of available water declined with increased duration of high temperatures.
Table 4. CAW at start of month and amount removed by end of month.
| Month1 | Crop Available Water (CAW) | Chickpea Monitoring Site | ||||
| Gravelbourg | Mossbank2 | Assiniboia | Coronach | Ogema | ||
| May | Starting CAW (mm) | N/A | 172 | 165 | 157 | 224 |
| CAW removed (mm) | N/A | 0.5 | 3 | 3 | 3 | |
| June | Starting CAW (mm) | 124 | 174 | 163 | 158 | 218 |
| CAW removed (mm) | 23 | 16 | 19 | 15 | 22 | |
| July | Starting CAW (mm) | 108 | 146 | 130 | 131 | 191 |
| CAW removed (mm) | 35 | 90 | 84 | 54 | 104 | |
| August | Starting CAW (mm) | 85 | 107 | 167 | 75 | 143 |
| CAW removed (mm) | 19 | 26 | 19 | 11 | 36 | |
1Starting at date of installation in May.
2Installation of below-ground monitoring equipment did not occur at this site until June 1.
Rooting activity to a depth of 50 cm was achieved at all locations except Gravelbourg which only reached its maximum depth of 30 cm by the end of July. Assiniboia, Mossbank, and Coronach sites surpassed the average maximum rooting depth (58 cm) and had measurable root activity at 70 cm depths by the end of August. The Ogema site maximized its rooting depth at 50 cm by end of July.

Source: Crop Intelligence
In 2021 Ogema, the site with the most rooting activity and the least amount of CAW remaining in the soil profile, yielded the highest. Although Ogema was also the highest yielding site in 2022, it did not have the most root activity or the least CAW remaining. In 2022, this site produced an additional 16 bu ac-1 with 20 less cm of rooting depth and higher levels of CAW relative to the other sites. Perhaps higher, but not excessive, amounts of initial CAW at time of crop establishment followed by adequate moisture events during the growing season and moderate temperatures allowed the chickpea crop at Ogema to allocate more resources to aboveground growth and yield production rather than diverting them root development.


Source: Crop Intelligence


Source: Crop Intelligence
Additional Agronomic Investigations
Nutrient Analysis
Five chickpea fields distributed throughout the region with previously reported chickpea health issues were selected as season-long monitoring sites during the 2022 growing sea
- Total nitrogen was in target range and relatively balanced between new and old growth
- Magnesium and sulphur were very high in both new and old growth
- Potassium was low in both new and old growth with more potassium being allocated to the new growth during the flowering stage
- Phosphorus was low in both new and old growth during vegetation stage but was generally in target range for new growth during flowering stage
- At both stages there was a general trend of phosphorus being remobilized to new growth with increasing unbalance between old and new growth from vegetative to flowering stage, indicating that chickpea plants may have been trending toward a hidden hunger
- Calcium was in the high range on old growth during both stages but only within target levels for new growth; this discrepancy in calcium levels became greater at the flowering stage and could potentially indicate a tie-up of calcium supply to the plant
Disease Monitoring Stations
Additional aboveground disease monitoring stations equipped with temperature, humidity, and leaf wetness sensors were placed in high and low landscape positions of each field. The purpose of these additional stations was to gain insight into how canopy conditions varied by landscape and the subsequent impact on disease pressure. Data collected from these stations rarely suggested large differences in temperature, humidity, or leaf wetness between landscape positions during the 2022 growing season. Additional site year data and collection of specific disease ratings are required for definitive conclusions on differences in disease risk across a variable landscape.
Humidity & Saturation Experiments
Initiation of chickpea health issue symptoms through the placement of poly tents or localized flooding in respective humidity and saturation experiments was unsuccessful.
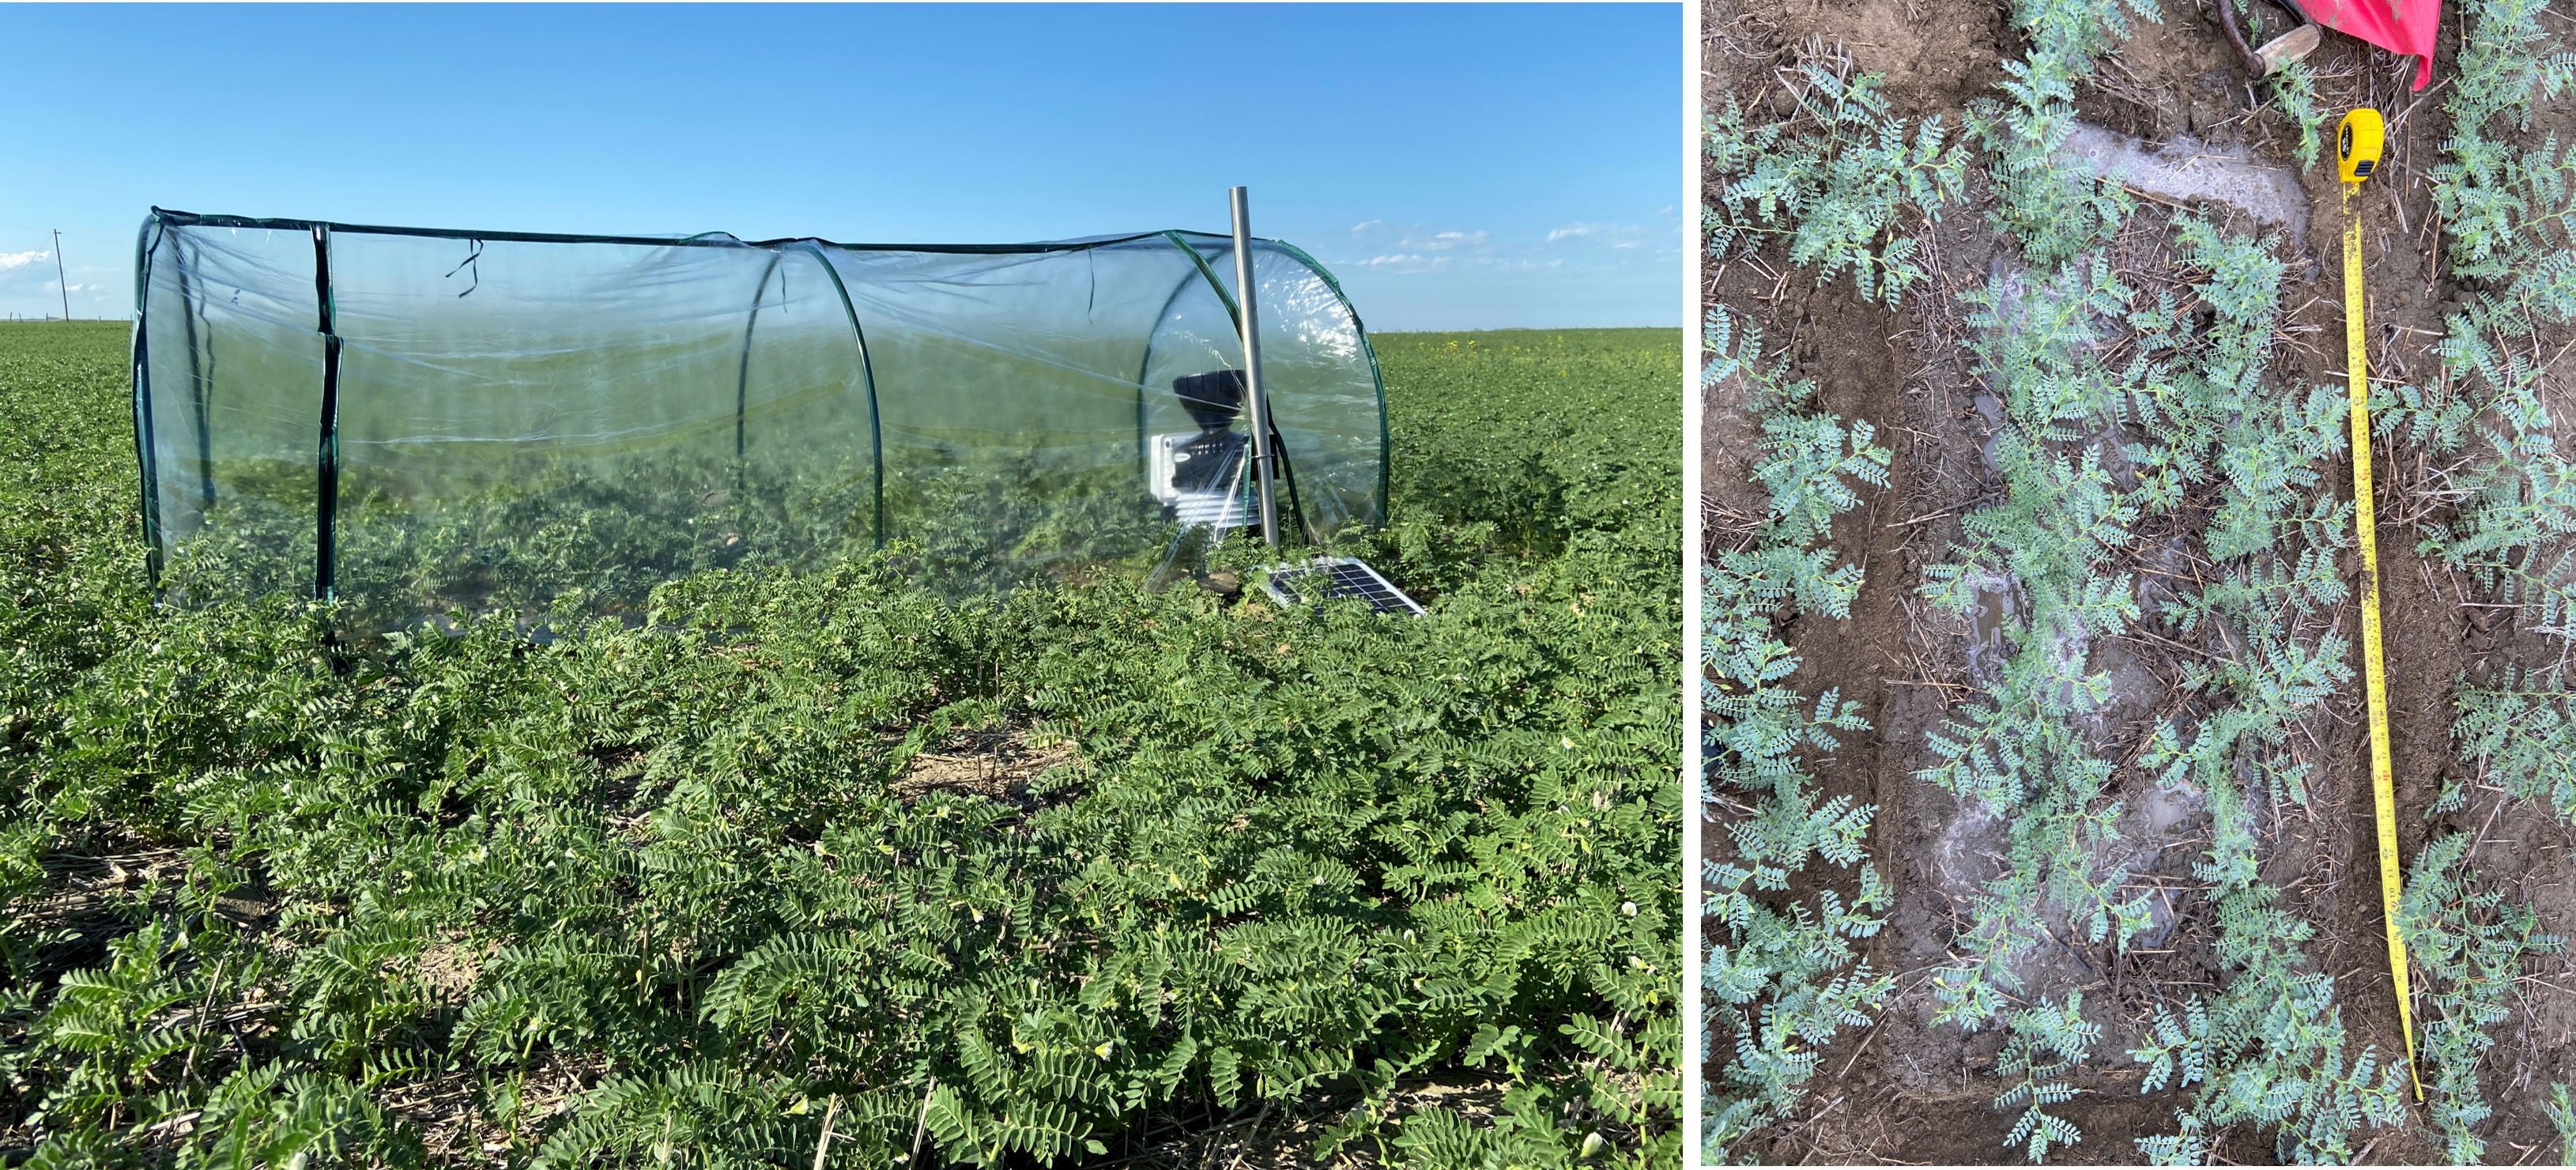
Based on agronomist recommendations that high humidity was a driver of symptom development, poly tents were established at the Assiniboia and Coronach sites on July 2, 2022, when chickpea crops were in early flowering stages. Each tent was equipped with a humidity sensor such that differences in humidity between the tent and field conditions could be compared should the onset of symptoms occur. Tents remained in place for one week and were monitored twice daily, with periodic venting of the tents to ensure that conditions were not excessively humid and became growth-limiting. Analysis of humidity patterns during this time indicated that the longest and only general humidity event recorded across all sites fell between July 3-6, 2022. There was also little difference in humidity intensity or duration measured under the tent versus in the field, thus explaining the neutral crop response and lack of symptom development under the tents.
Based on observations during the 2019 growing season where symptom development was seemingly initiated by a rainfall event on dry soils, the saturation demonstration aimed to evaluate if a simulated two-inch (50.8 mm) heavy rainfall event on July 4, 2022, at the driest field location in Gravelbourg, would initiate symptom development in the localized area receiving the moisture. Visual inspection of the chickpea crop in the simulated rainfall area did not reveal any symptom development at any point in subsequent development stages. It could be that the simulated rainfall amount was insufficient or too infrequent based on low moisture level in field.
Yield
Average chickpea yield across all five sites was 31 bu ac-1, a 6 bu ac-1 increase from 2021 results but ranged from 16-51 bu ac-1 with the highest yield measured at the Ogema location and the lowest at the Gravelbourg location for the second consecutive year.
Heat and rainfall had a direct impact on chickpea yield at these sites once again in the 2022 growing season. Rainfall measured during May-July was positively correlated to yield and the number of days and hours with temperatures above 28°C were both negatively correlated to yield. Comparisons of the environmental conditions between the two highest and lowest yielding sites revealed that chickpea grown at the Ogema site received 100% of average historical rainfall and 107 mm of additional in-season rainfall relative to Gravelbourg which only received 62% of the region’s historical mean precipitation. The chickpea grown at Gravelbourg experienced over 71 additional hours and 8 additional days of temperatures above 28°C, primarily in the month of July during flowering and pod development.
Table 5. Summary of chickpea yield (bu ac-1), rooting depth, and May‒July environmental conditions.
| Site | Yield (bu ac-1) | Max Rooting Depth (cm) | Temperature above 28°C | Total In-Season Precipitation1 (mm) | ||
| (days) | (hours) | (% of HM)1 | (mm) | |||
| Gravelbourg | 16 | 30 | 19 | 120 | 62 | 132 |
| Mossbank | 35 | 70 | 14 | 81 | 106 | 181 |
| Assiniboia | 27 | 70 | 16 | 82 | 69 | 124 |
| Coronach | 26 | 50 | 18 | 107 | 78 | 158 |
| Ogema | 51 | 50 | 11 | 49 | 100 | 239 |
1Thirty-year historical mean for region
Conclusions
The 2022 Chickpea Project again provided important data for chickpea root growth, water use, and yield responses to environmental conditions during the growing season. Furthermore, information collected during this study will provide important comparisons of chickpea development and yield factors during future seasons with differing environmental conditions. Data from this field investigation indicate that high yielding chickpea crops do not always root to the maximum depth, particularly when soil and in-season precipitation are adequate. However, in severely yield-limiting environments, rooting depth is also restricted and water use efficiency is diminished.
There is much more to learn about how chickpea responds to environmental and soil conditions and how those conditions influence not only the chickpea health issue but also chickpea yield and general agronomy decisions. For these reasons, Saskatchewan Pulse Growers and Crop Intelligence are excited to extend this study for a third year and collaborate on The 2023 Chickpea Project.
Acknowledgements
Saskatchewan Pulse Growers and Crop Intelligence gratefully acknowledge the growers who participated in this study including Craig Eger, Codie Nagy, Dan Green, Dustin DeWulf, and Scott Hepworth. Appreciation is also extended to SPG summer intern, Christina Franks, for agronomy support and assisting with in-season monitoring at these field sites.