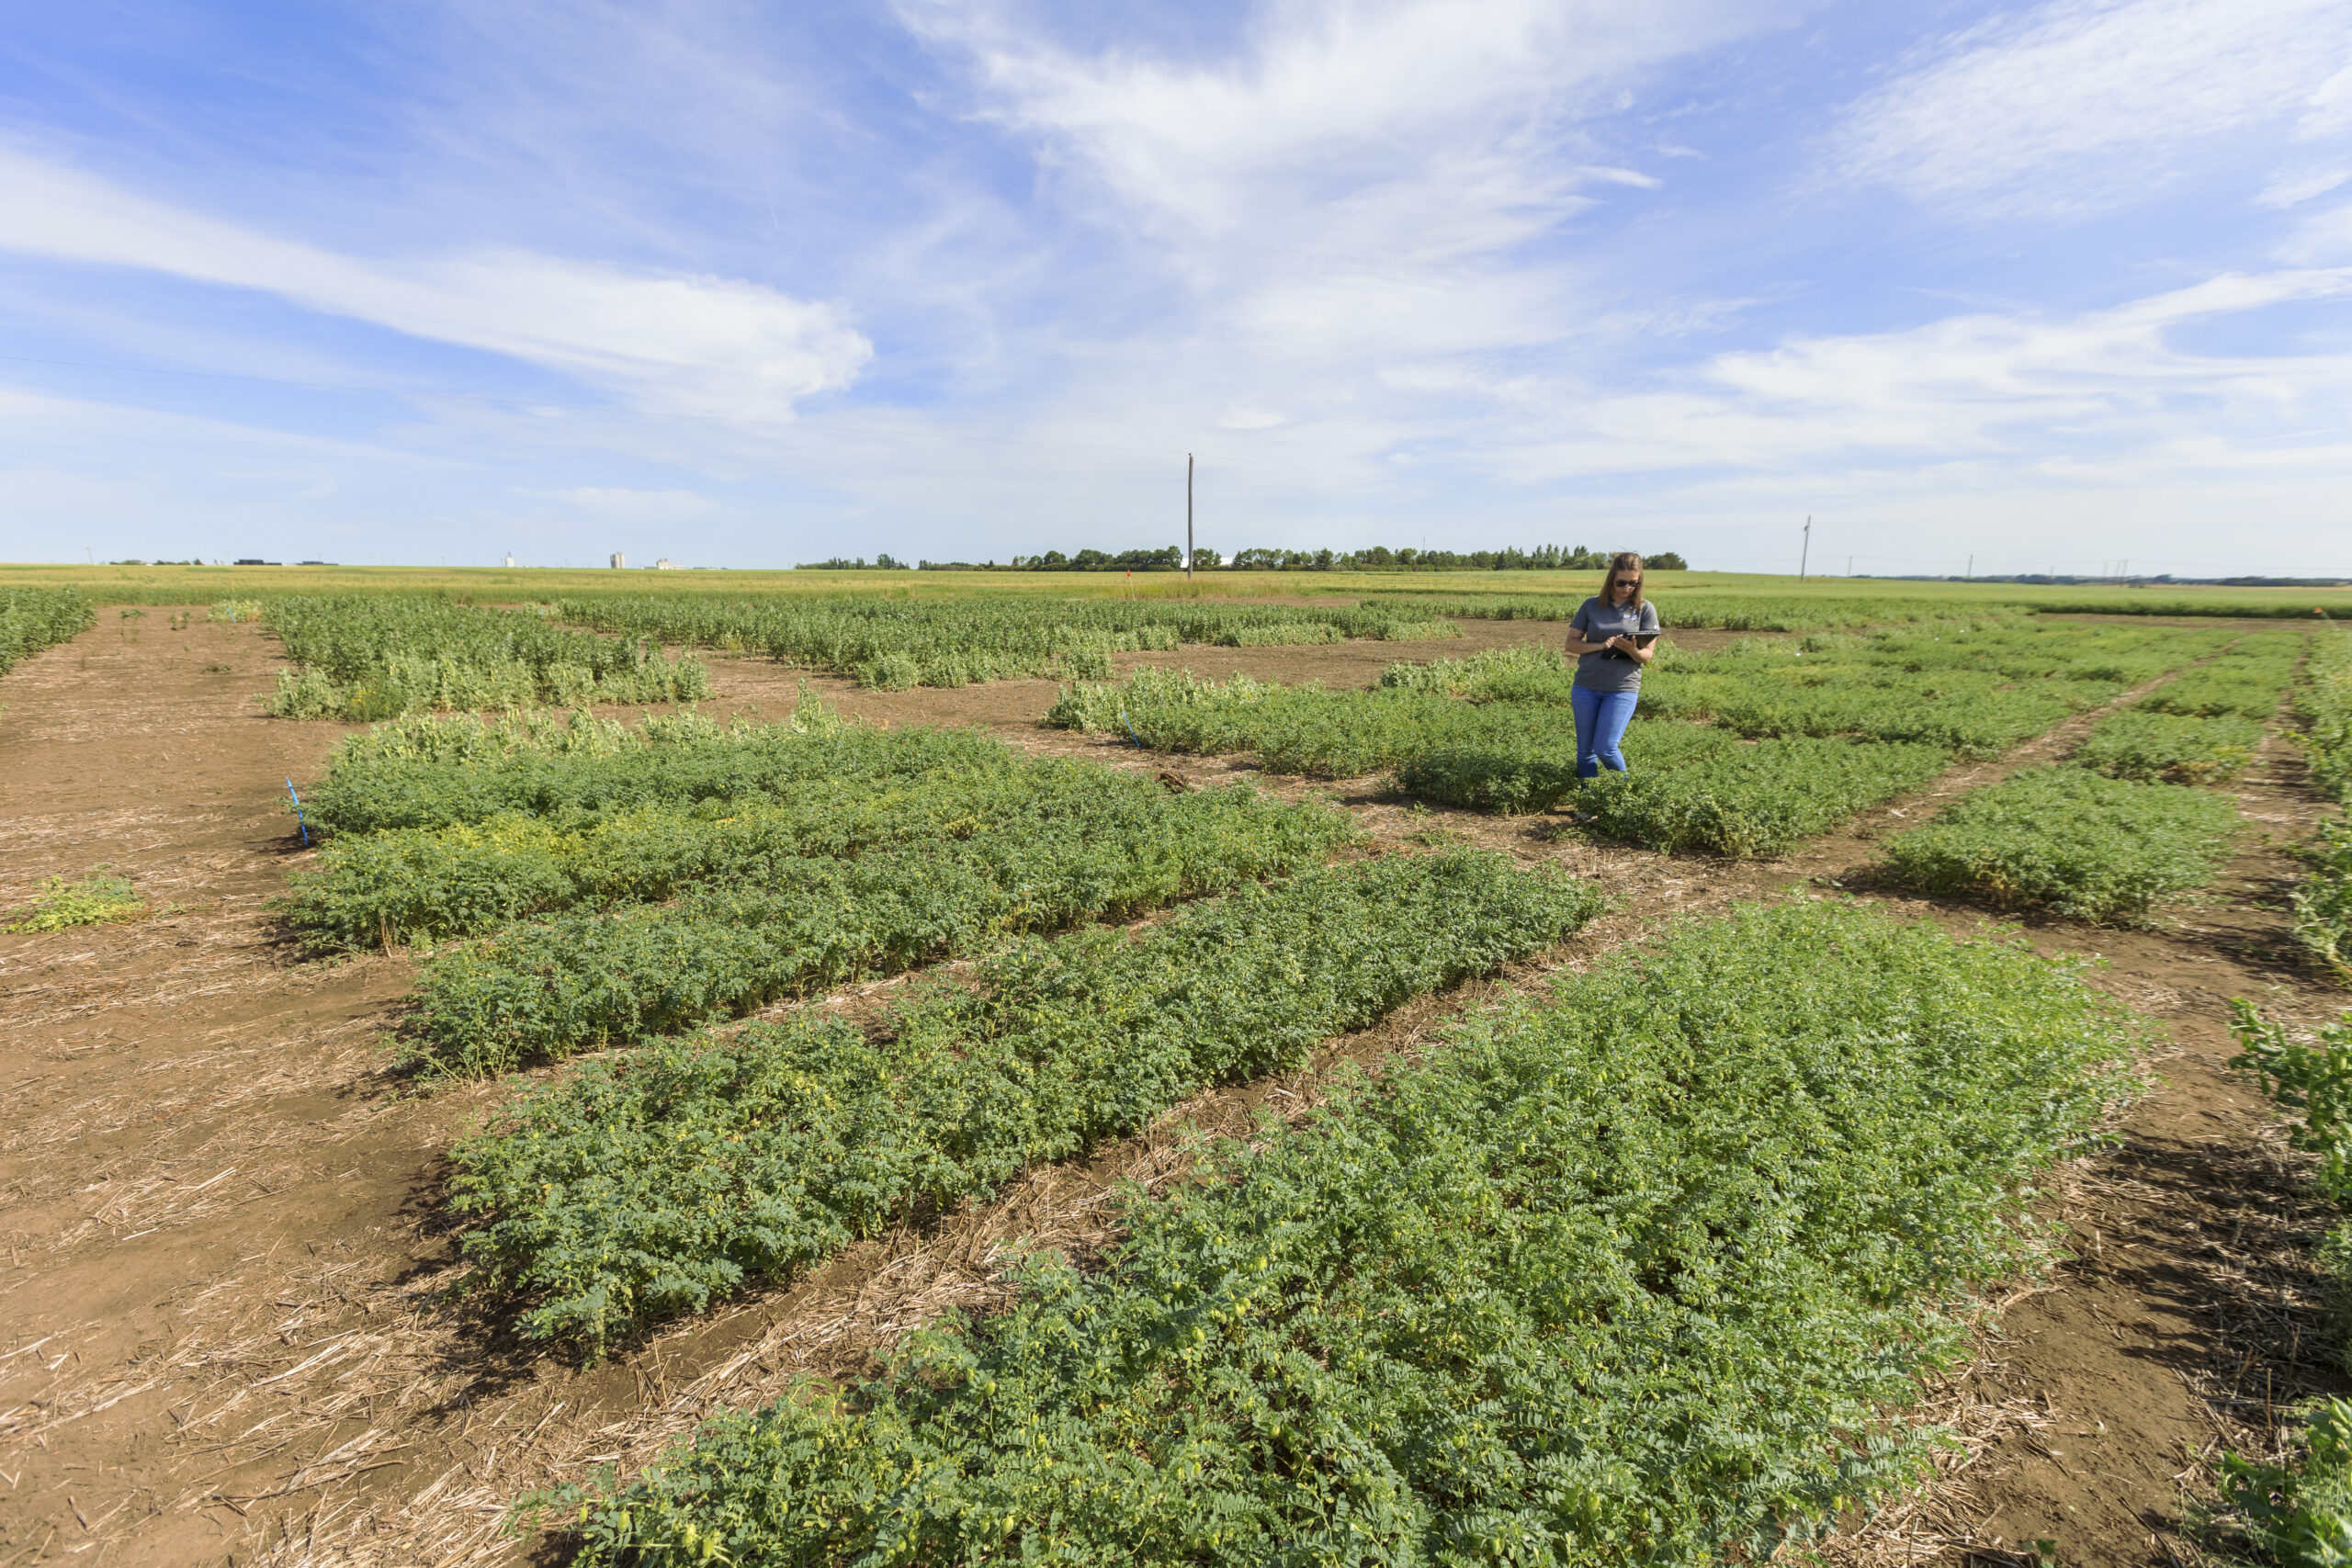
Surveys of pests in pulse crops are important for monitoring for new diseases and insects, as well as to follow the severity of pests over time. In 2023 pulse crops were surveyed across Saskatchewan for foliar and root diseases as well as insects in crop. A seed quality survey of commercial seed test labs was also initiated to evaluate diseases on seed samples from the 2023 production year.
Disease Surveys
Disease assessments were made by visually examining plants from predetermined sampling patterns within each field. It is important to note that diagnosis of foliar disease was only based on visual symptoms in the field and no lab confirmation was carried out (except where noted).
Incidence is calculated as the percentage of the total number of plants assessed that have symptoms of the disease. For example – 76 out of 100 plants or 76% incidence within a field which is then averaged over the fields evaluated in each region.
Prevalence is a measure of the presence or absence of the disease in the field and is expressed based on the percentage of fields positive for that symptom. For example – Anthracnose symptoms are found in 31 out of the 36 lentil fields which equates to 86.1% prevalence.
Lentil
A total of 54 lentil fields were surveyed for the presence and incidence of diseases in Saskatchewan. The survey was completed between July 10 to August 9 and ranged in staging from R2 (full bloom) to R6 (full pod). The number of surveyed crops was highest in Southwest Saskatchewan, with 23 of the 54 crops surveyed located in this region. The distribution of the remaining surveyed crops across the province was as follows: 11 (West Central), 11 (Southeast), 6 (East Central) and 3 (Northwest). Disease assessments were made by visually examining 20 plants from each of 5 sites along a W-pattern in each field. Individual sites were located at least 50m from the field edge and at least 30m apart. Crops were assessed for the incidence of anthracnose (Colletotrichum truncatum), ascochyta blight (Ascochyta lentis), sclerotinia stem and pod rot (Sclerotinia sclerotiorum), botrytis stem and pod rot (Botrytis cinerea) and stemphylium blight (Stemphylium spp.) and the prevalence of root rot complex (Fusarium spp./Pythium spp./Rhizoctonia solani/Aphanomyces euteiches) and all previously listed diseases. Incidence is calculated as the percentage of plants assessed (out of 100 plants total per crop) with symptoms of the disease, while prevalence is a measure of the presence or absence of the disease in the field. All disease assessments were made based on visual symptoms observed in the field.
Root rot complex symptoms were present in 74% of the surveyed crops (Table 1). Across the regions, prevalence ranged from 61% to 100% of fields.
Anthracnose was the most prevalent foliar disease in 2023 and was identified in 74% of the surveyed crops with an overall average incidence of 20% (Tables 1 and 2). The incidence of anthracnose was highest in Northwest Saskatchewan (65%) followed by the East Central (49%).
Stemphylium blight was observed in 20% of fields with an average incidence of 4% (Tables 1 and 2). Across the regions the prevalence of stemphylium blight ranged from 0% (West Central and East Central) to 36% (Southeast) of surveyed fields.
Sclerotinia stem and pod rot was observed in 6% of crops with an average incidence of 0.1% (Tables 1 and 2). Sclerotinia stem and pod rot were found only in one and two fields each in the Southwest and West Central regions, respectively.
Ascochyta blight was rare and only observed in four fields in the Southwest and one field in the West Central regions with an average incidence of 2% in fields with affected plants. It is important to note that diagnosis was only based on visual symptoms in the field. Plants having visual symptoms that were consistent with ascochyta blight were not confirmed with additional testing.
Table 1. Prevalence of Disease in Saskatchewan Lentil Crops Surveyed in 2023
| Region1 | Number of Fields Surveyed | Prevalence (%) (number of fields with symptoms) | |||||
| Root rot complex | Anthracnose | Ascochyta blight | Sclerotinia stem & pod rot | Botrytis stem & pod rot | Stemphylium Blight | ||
| SW | 23 | 61 (14) | 65 (15) | 17 (4) | 9 (2) | 0 | 26 (6) |
| SE | 11 | 64 (7) | 64 (7) | 0 | 0 | 0 | 36 (4) |
| EC | 6 | 83 (5) | 100 (6) | 0 | 0 | 0 | 0 |
| WC | 11 | 100 (11) | 83 (9) | 11 (1) | 11 (1) | 0 | 0 |
| NW | 3 | 100 (3) | 100 (3) | 0 | 0 | 0 | 33 (1) |
| Overall | 54 | 74 (40) | 74 (40) | 9 (5) | 6 (3) | 0 | 20 (11) |
1Region: Southwest (SW); Southeast (SE); East Central (EC); West Central (WC); Northwest (NW).
Source: Saskatchewan Pulse Disease Situation Report 2023 submitted to Western Forum on Pest Management by Alireza Akhavan from Saskatchewan Ministry of Agriculture
Table 2. Disease Incidence in Saskatchewan Lentil Crops Surveyed in 2023
| Region | Incidence of disease (%) (Incidence in only infected fields)2 | |||||
| Root rot | Anthracnose | Ascochyta blight | Sclerotinia stem & pod rot | Botrytis stem & pod rot | Stemphylium Blight | |
| SW | 24 (39) | 12 (19) | 0.3 (2) | 0.1 (2) | 0 | 8 (30) |
| SE | 21 (32) | 23 (35) | 0 | 0 | 0 | 0.5 (2) |
| EC | 25 (30) | 49 (49) | 0 | 0 | 0 | 0 |
| WC | 70 (70) | 6 (7) | 0.1 (1) | 0.1 (1) | 0 | 0 |
| NW | 71 (71) | 65 (65) | 0 | 0 | 0 | 1 (3) |
| Overall | 35 (48) | 20 (27) | 0.1 (2) | 0.1 (1) | 0 | 4 (17) |
2Average incidence of disease for all crops surveyed (disease incidence averaged across only fields with disease symptoms)
Source: Saskatchewan Pulse Disease Situation Report 2023 submitted to Western Forum on Pest Management by Alireza Akhavan from Saskatchewan Ministry of Agriculture
Soybean
A total of 20 soybean fields were surveyed and assessed for disease incidence and severity in Saskatchewan. The survey was completed between August 2nd and September 6th while crops were between growth stage R3 (Beginning pod) to R8 (Full maturity). Nineteen of the surveyed fields were in the Southeast and one field was in the East Central. Ten plants were assessed for the incidence and severity of diseases at five sites located in a W-pattern (at total of 50 plants per field). Individual sites were at least 50m apart and located at least 50m from the field edge. Each of the 50 plants were assessed for the presence of the following diseases: brown spot (Septoria glycines), bacterial blight (Pseudomonas savastanoi pv. glycinea), downy mildew (Peronospora manshurica), white mould (Sclerotinia sclerotiorum), pod and stem blight (Diaporthe sojae), anthracnose (Colletotrichum spp.), frogeye leaf spot (Cercospora sojina) and phytophthora root rot (Phytophthora spp.). Disease severity was also assessed for brown spot, bacterial blight and downy mildew using a 0-5 rating scale with 0 meaning no disease present and five meaning that there were severe symptoms with defoliation. The prevalence of iron deficiency chlorosis, sudden death syndrome (Fusarium virguliforme), soybean rust (Phakopsora meibomiae and P. pachyrhizi), charcoal rot (Macrophomina phaseolina), northern stem canker (Diaporthe caulivora) and soybean cyst nematode (Heterodera glycines) was estimated by recording the presence or absence in the field. All disease assessments were made based on visual symptoms in the field. Samples were collected and submitted to Dr. Yong Min Kim to test for the presence of root rot pathogens.
The most prevalent disease in Saskatchewan was bacterial blight and brown spot. Bacterial blight was present in 95% of fields surveyed with an average incidence of 79% in infected fields (Table 3). The average disease severity was 2.2 as rated on a 0 to 5 rating scale.
Symptoms consistent with brown spot were also observed in all surveyed crops with an average incidence of 86% and average severity was 1.6 as rated on a 0 to 5 rating scale.
Symptoms suggesting Phytophthora root rot were found in one field and were submitted to Dr. Yong Min Kim for further analysis and the pathogen was not isolated.
Iron deficiency chlorosis was seen in two fields this year. No additional diseases including frog eye leaf spot, downy mildew, white mould, anthracnose, soybean rust, northern stem canker, sudden death syndrome and charcoal rust were observed.
Symptoms suggesting cercospora leaf blight were found in several fields this year but were not confirmed at the Crop Protection Laboratory following plating and microscopy.
Table 3. Prevalence, Incidence, and Severity of Bacterial Blight, Brown Spot, Frog Eye Leaf Spot, and Downy Mildew in SK Soybean Fields
| Region | Prevalence (%)1 | Average Incidence in only infected fields (%)2 | Average Severity3 |
| Bacterial blight | 95 | 79 | 2.2 |
| Brown spot | 100 | 86 | 1.6 |
| Frog eye leaf spot | 0 | 0 | 0 |
| Downy mildew | 0 | 0 | 0 |
1Prevalence = the percent of crops surveyed with symptoms of the disease
2Average incidence of the disease averaged across crops with disease symptoms
3Average severity of infected plants averaged across crops with disease symptoms
Source: Saskatchewan Pulse Disease Situation Report 2023 submitted to Western Forum on Pest Management by Alireza Akhavan from Saskatchewan Ministry of Agriculture
Pea
In total, 42 field pea crops were surveyed in Saskatchewan in 2023. The highest number of surveyed crops were in Southwest and East Central Saskatchewan with 11 and 9 of the surveyed fields located in these two regions. The distribution of fields across the six regions in the province is described in Table 6. The survey was completed between June 28th and July 27th. Crop growth staged ranged from R1 (flower bud) to R6 (mid maturity). Disease assessments were made by examining 10 plants from each of 5 sites along a W-pattern with at least 30m between sampling sites. Crops were assessed for the incidence of root rot complex (Aphanomyces euteiches, Fusarium spp., Rhizoctonia spp., and Pythium spp.), Mycosphaerella/Ascochyta complex [Peyronellaea (Mycosphaerella) pinodes, Ascochyta pisi and Phoma medicaginis f.sp. pinodella], downy mildew (Peronospora viciae), white mould (Sclerotinia sclerotiorum), and bacterial blight (Pseudomonas syringae pv. pisi). The severity of the root rot complex and mycosphaerella/ascochyta blight was assessed for each plant using the rating scales described below (Tables 4 and 5). All disease assessments were made based on visual symptoms in the field. Unless requested by an individual surveyor for a specific sample, no additional testing was conducted to confirm diagnosis.
Table 4. Severity scale for root rot complex of field pea (modified from Chatterton et al. 2019)
| Rating | Lesions | % affected | Pruning |
|---|---|---|---|
| 1 | none | 0 | 0 |
| 2 | Small (<1 cm), lesion near seed attachment | 0 | 0 |
| 3 | Small coalescing lesions approx. 180° around stem | 10-20% | 0 |
| 4 | Lesions extending and completely encircling stem | 20-95% | 5-20% |
| 5 | Increasingly discolored and extended epicotyl lesions | 100% | 20-50% |
| 6 | Epicotyl lesions encircling stem extending up to 2 cm | 100% | 50-80% |
| 7 | Tap root (including epicotyl) completely lesioned | Dead | Dead |
Table 5. Severity scale for mycosphaerella/ascochyta blight leaf rating of field pea (modified from Liu et al. 2013)
| Rating | Description |
|---|---|
| 1 | no disease |
| 2 | mild to moderate disease on less than 5% of plant |
| 3 | moderate to severe disease on 5-20% of plant |
| 4 | moderate to severe disease symptoms on 20-50% of plant |
| 5 | moderate to severe disease symptoms 50-80% of plant |
| 6 | disease on all or most of the plant, plant stunted but alive |
| 7 | plant stunted/dying |
Root rot complex was present in 90% of the surveyed field pea crops with an average incidence of 62% across the province (Tables 6 and 7). Average disease incidence ranged from 23% (Northeast) to 82% (Southeast). Disease severity was generally low with an average severity of 2.5 across the province.
Mycosphaerella/Ascochyta complex was present in 90% of the surveyed fields and was assessed based on per cent of plant affected. Average incidence was 55% and ranged from 35% (Northeast) to 75% (Northwest) and average severity was quite low at 1.8 across the province.
Downy mildew was present in 17% of the surveyed field. Average incidence was 1.4%. White mould was present in only one of the surveyed fields this year.
Symptoms consistent with bacterial blight were present in 40% of crops. Bacterial streaming test was conducted with a microscope on representative samples from a portion of assessed fields, but no additional testing was performed to identify/confirm the causal organism. Presence of this disease may be influenced by crop damage due to adverse weather in these regions.
Table 6. Prevalence of root rot complex, mycosphaerella/ascochyta complex, white mould, and bacterial blight in Saskatchewan field pea crops in 2023.
| Region | Number of Fields Surveyed | Prevalence (%) (number of fields with symptoms) | ||||
| Root rot complex | Mycosphaerella/Ascochyta complex | White mould | Bacterial blight | Downy Mildew | ||
| SE | 8 | 100 (8) | 100 (8) | 0 | 88 (7) | 13 (1) |
| SW | 11 | 91 (10) | 73 (8) | 0 | 64 (7) | 27 (3) |
| EC | 9 | 89 (8) | 100 (9) | 0 | 22 (2) | 11 (1) |
| WC | 7 | 100 (7) | 86 (6) | 14 (1) | 0 | 29 (2) |
| NE | 4 | 50 (2) | 100 (4) | 0 | 0 | 0 |
| NW | 3 | 100 (3) | 100 (3) | 0 | 33 (1) | 0 |
| Province | 42 | 90 (38) | 90 (38) | 2 (1) | 40 (17) | 17 (7) |
Source: Saskatchewan Pulse Disease Situation Report 2023 submitted to Western Forum on Pest Management by Alireza Akhavan from Saskatchewan Ministry of Agriculture
Table 7. Incidence and severity of field pea diseases in Saskatchewan in 2023.
| Region | Root rot complex | Mycosphaerella/Ascochyta complex | White mould | Bacterial Blight | Downy Mildew | ||
| Average Incidence (%) | Average Severity | Average Incidence (%) | Average Severity | Average Incidence (%) | Average Incidence (%) | Average Incidence (%) | |
| SE | 82 | 2.6 | 65 | 1.9 | 0 | 13 | 0.3 |
| SW | 64 | 2.8 | 43 | 1.7 | 0 | 9 | 1.3 |
| EC | 53 | 2.3 | 68 | 2.0 | 0 | 5 | 2.9 |
| WC | 65 | 2.8 | 48 | 1.7 | 0.3 | 0 | 2.3 |
| NE | 23 | 1.4 | 35 | 1.4 | 0 | 0 | 0 |
| NW | 79 | 3.4 | 75 | 2.4 | 0 | 33 | 0 |
| Province | 62 | 2.5 | 55 | 1.8 | 0 | 8 | 1.4 |
Source: Saskatchewan Pulse Disease Situation Report 2023 submitted to Western Forum on Pest Management by Alireza Akhavan from Saskatchewan Ministry of Agriculture
Chickpea
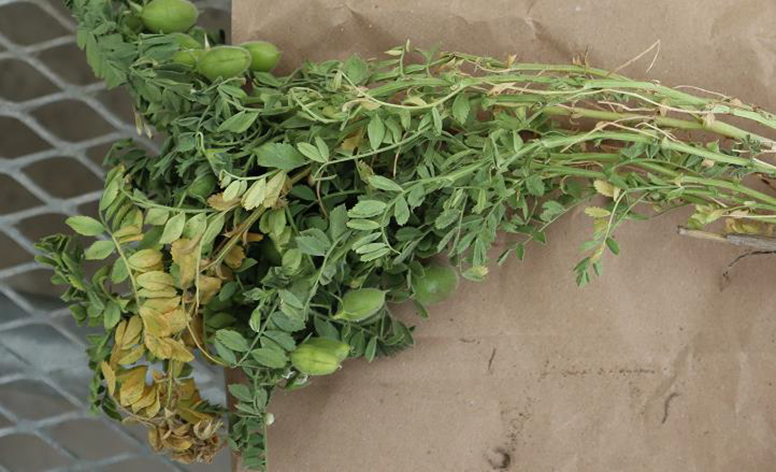
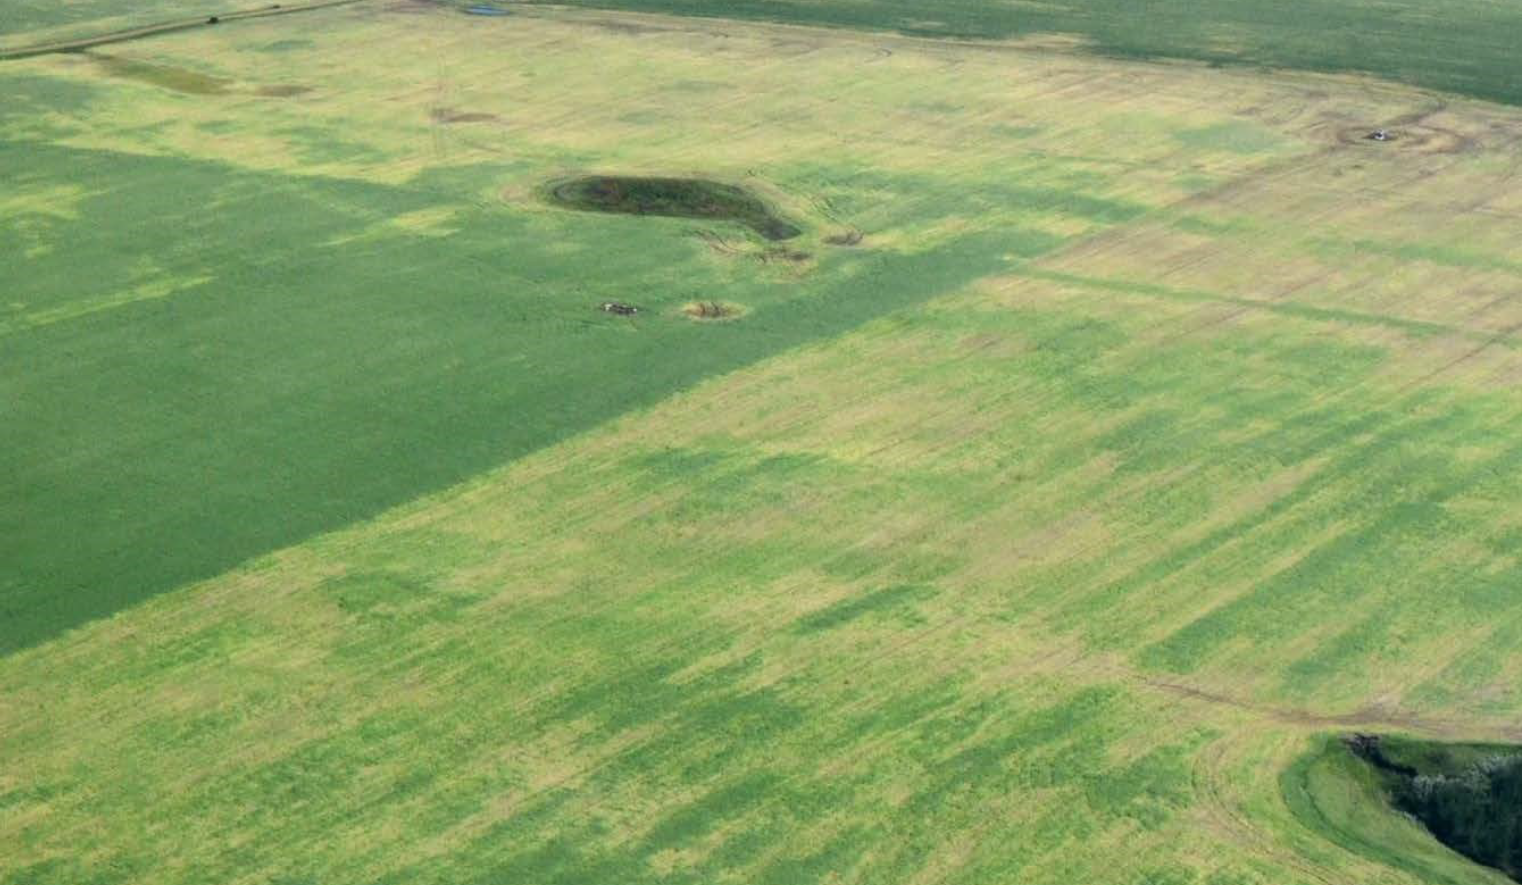
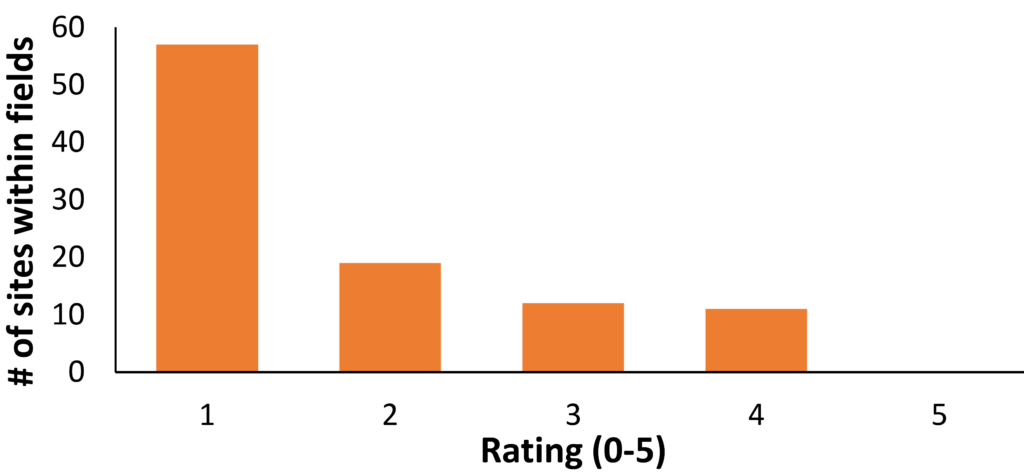
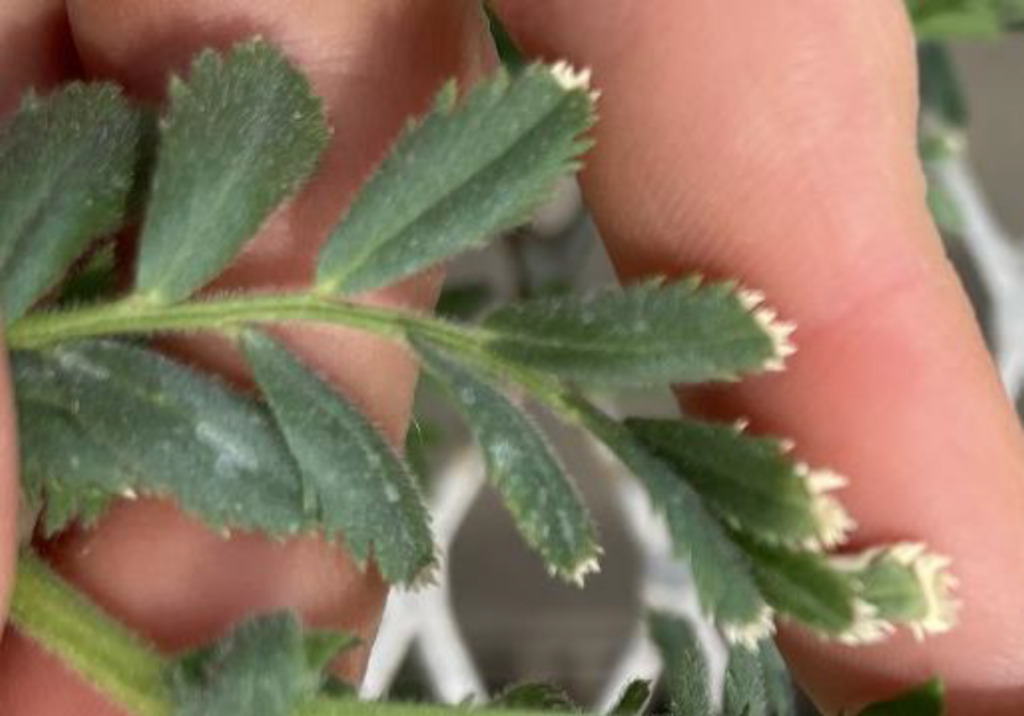
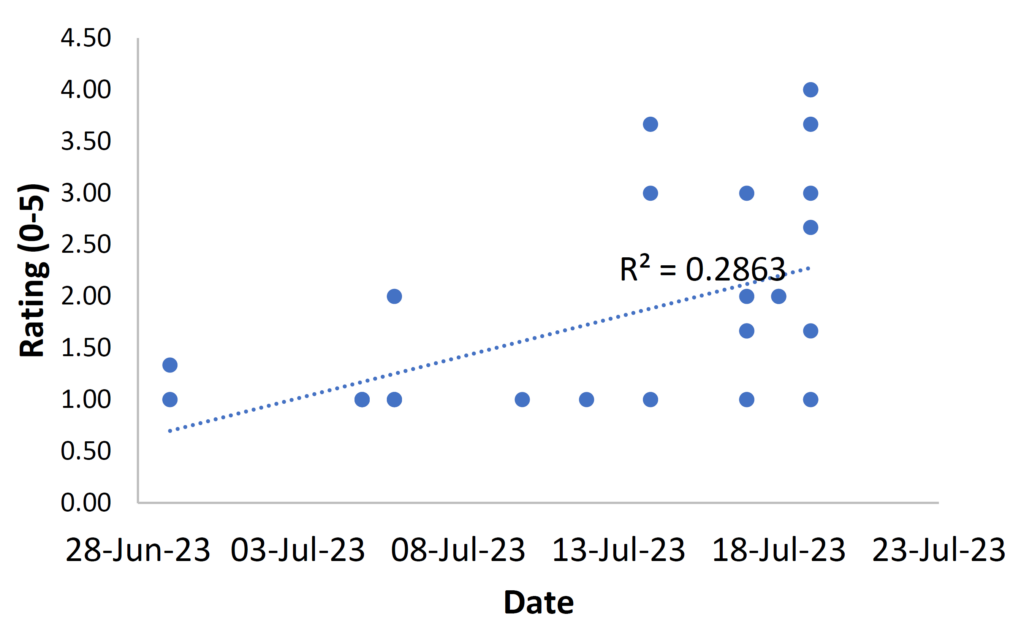
Chickpea fields were surveyed as part of the ongoing Chickpea Health Issue investigation. This survey was led by Dr. Michelle Hubbard, Research Scientist with Agriculture and Agri-Food Canada in Swift Current. 38 chickpea fields across 28 RMs were assessed from June 29 to July 20 and rated on a scale of 0–5 for aboveground symptomology of chickpea health issue. Samples of symptomatic and asymptomatic plants were collected for future nutrient analysis by Dr. Jeff Schoenau (University of Saskatchewan). Soil samples were also gathered from some fields for future testing for nematodes Dr. Mario Tenuta (University of Manitoba). The symptoms observed were generally mild, with a rating of 1 on the 0-5 scale being the most common rating assigned to symptomatic sites (Figure 1). The overall average of all non-zero ratings was 1.77 on the 0-5 scale. These mild symptoms consisted almost exclusively of whitening of leaf tips (Figure 2). However, more severe symptoms were also observed (Figure 3), generally later in the season (Figure 4).
Source: 2023 Saskatchewan Survey of Chickpea for an Emerging Health Issue submitted to Western Forum on Pest Management by Michelle Hubbard, AAFC Swift Current
Source: 2023 Saskatchewan Survey of Chickpea for an Emerging Health Issue submitted to Western Forum on Pest Management by Michelle Hubbard, AAFC Swift Current

Source: 2023 Saskatchewan Survey of Chickpea for an Emerging Health Issue submitted to Western Forum on Pest Management by Michelle Hubbard, AAFC Swift Current
Source: 2023 Saskatchewan Survey of Chickpea for an Emerging Health Issue submitted to Western Forum on Pest Management by Michelle Hubbard, AAFC Swift Current
Source: Saskatchewan Provincial Insect and Pest Report 2023 submitted to Western Forum on Pest Management by James Tansey, Saskatchewan Ministry of Agriculture.
Insect Surveys
Various insect surveys were coordinated by Saskatchewan Ministry of Agriculture and the University of Saskatchewan, results are presented below along with comments.
Grasshoppers (various species)
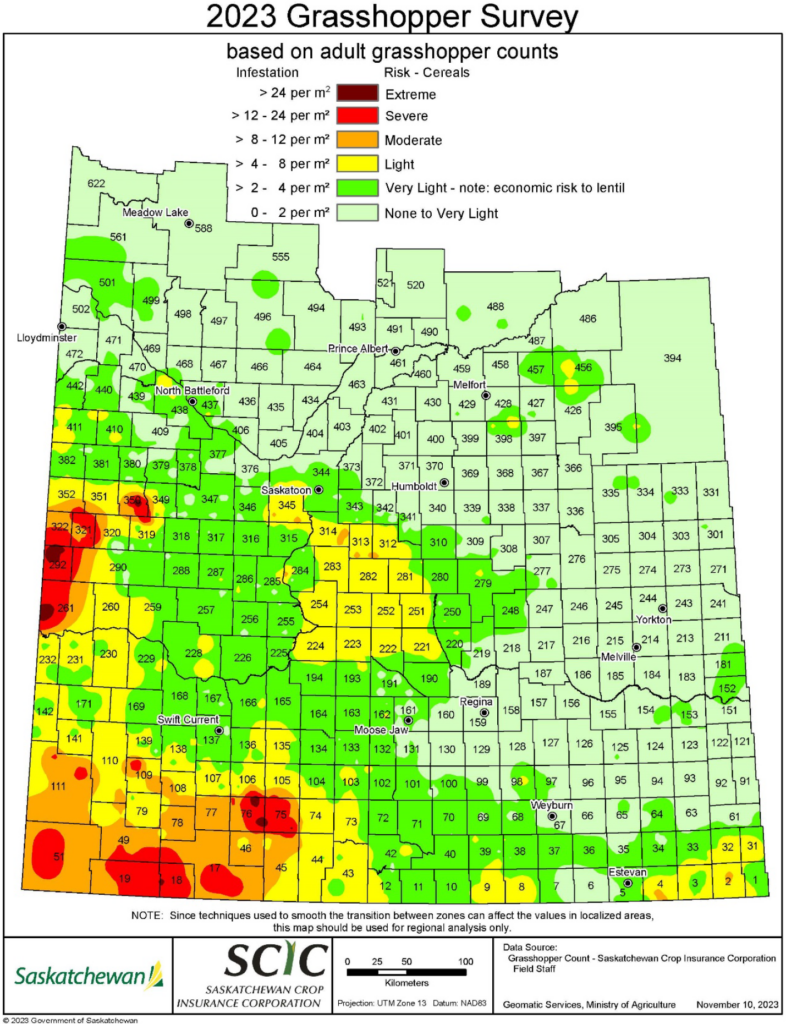
Grasshopper numbers increased again from 2022 and many incidents of spraying were reported throughout the province and in many crops. The survey was conducted at approximately 1100 sites from July to September. Significant populations were reported across the province, especially in South Central, Southwestern, and Southeastern regions in several crops. Very heavy populations (>50 m-2) were detected in the West Central (RM 292). Populations >10 m-2 were detected at an additional 63 sites primarily in the West Central and Southwest regions with hotspots in the Southeast. No pest grasshoppers were reported from only 17 of 1100 sites. A hotter than normal May and June meant grasshopper development was well ahead of normal with the Prairie Pest Monitoring Network reporting adult two-stripe grasshoppers being found June 19. Discussion between researchers concluded none of them remember ever seeing adult two-striped grasshoppers in June before. Drought-like conditions and a quicky developing pest grasshopper population mean that many areas had crops that were under severe feeding pressure earlier than normal and unable to outgrow feeding damage leading to earlier insecticide applications. A side effect of grasshoppers reaching adult stage earlier than normal is that egg laying also starts earlier than normal. Prairie Pest Monitoring Network model predictions for egg laying (oviposition) showed it to be well underway the first week of August, on a normal year oviposition would only be just beginning across most of the prairies that first week of August. High populations of pest grasshoppers making it to adult stage and oviposition sets a potential scenario up for 2024 for high pest grasshopper pressure again in some areas.
Source: Saskatchewan Provincial Insect and Pest Report 2023 submitted to Western Forum on Pest Management by James Tansey, Saskatchewan Ministry of Agriculture.
Lygus spp.
Source: Saskatchewan Provincial Insect and Pest Report 2023 submitted to Western Forum on Pest Management by James Tansey, Saskatchewan Ministry of Agriculture.
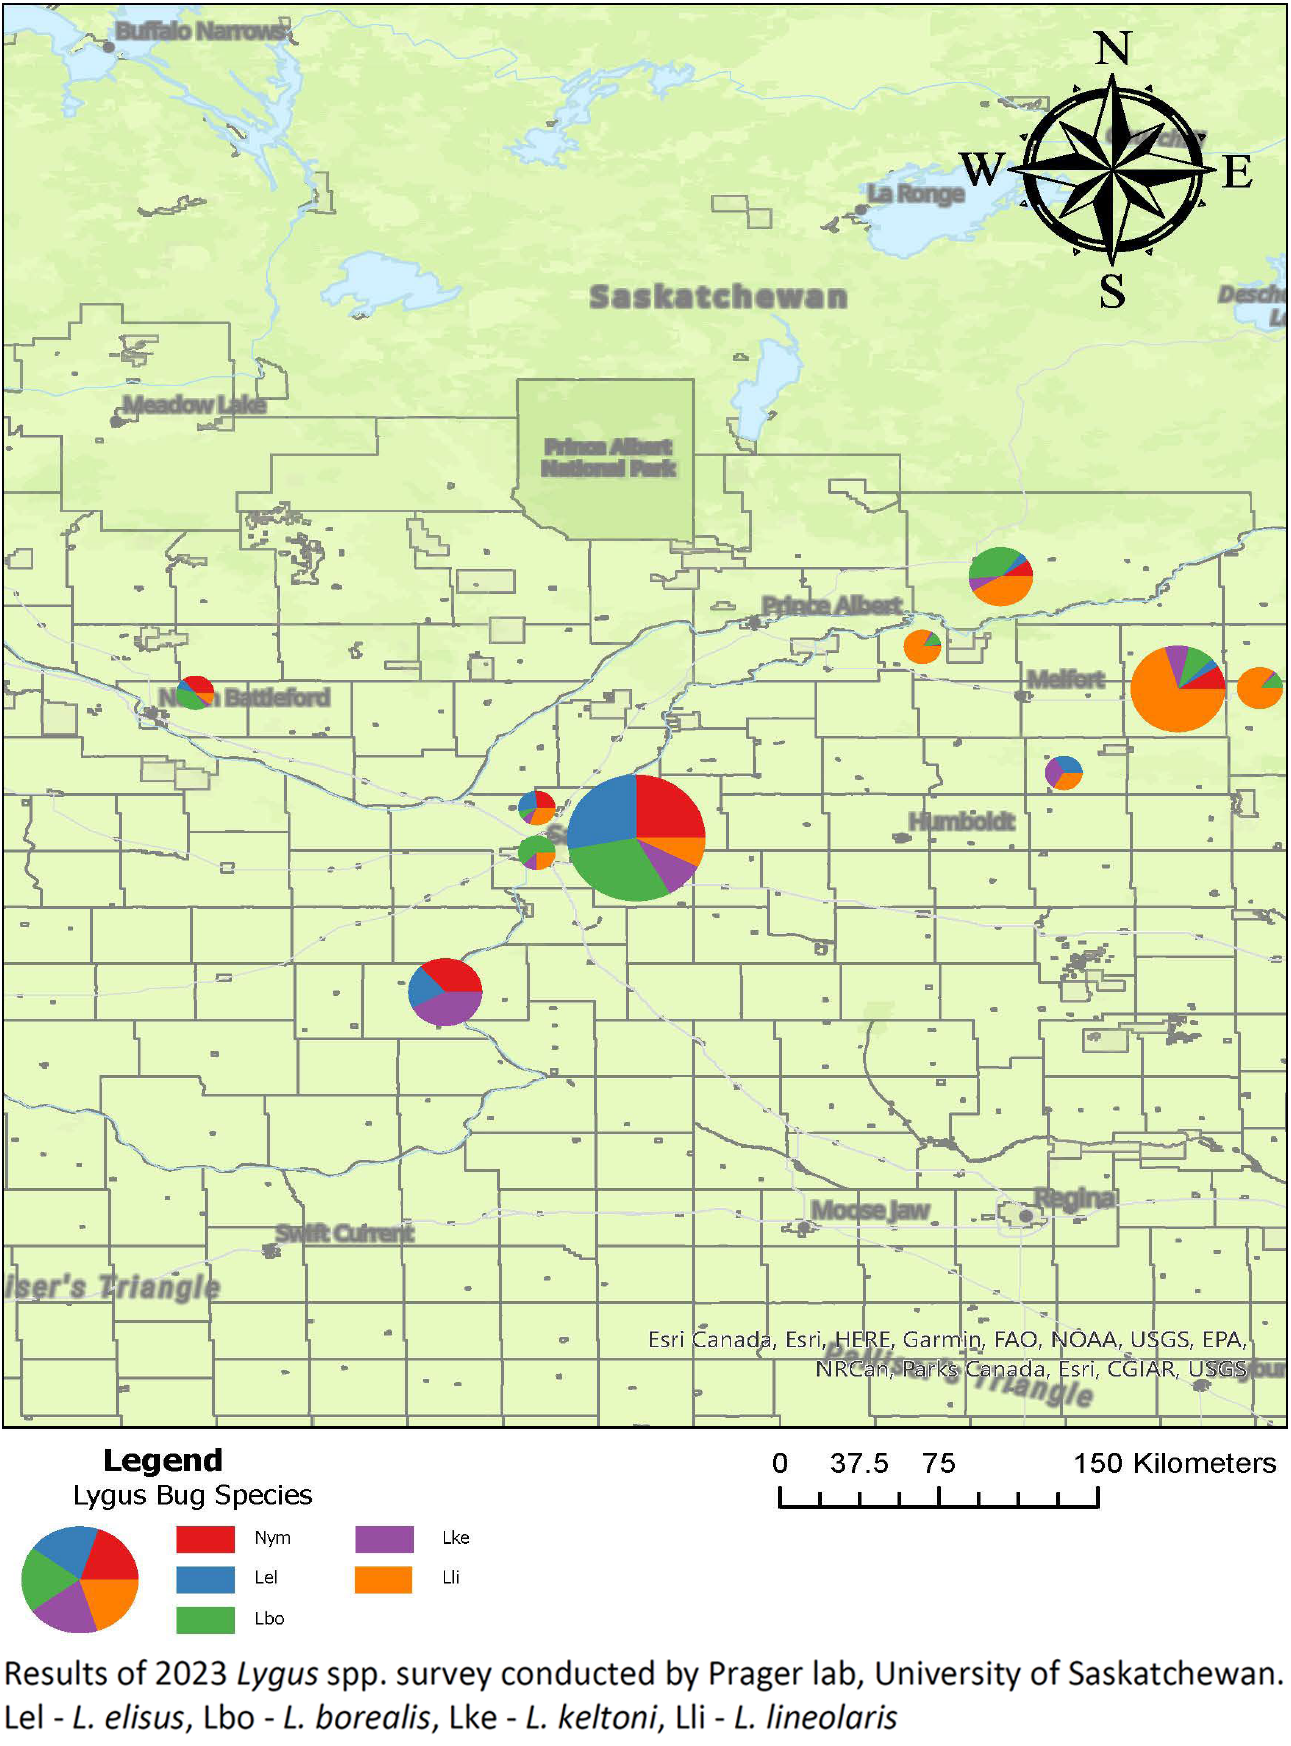
The survey was performed by the Prager Lab at the University of Saskatchewan. The survey results (Figure 6) indicate four species of Lygus present in the province: L. lineolaris, L. elisus L. borealis, and L. keltoni. Results of the survey showed that L. lineolaris was more prominent in the north, L. elisus and L. borealis more prominent around Saskatoon/central, and L. keltoni more prominent further south. Preliminary work by the Prager Lab has show that lygus tolerance in faba bean is extremely low.
Pea Leaf Weevil (Sitona lineatus (L.))
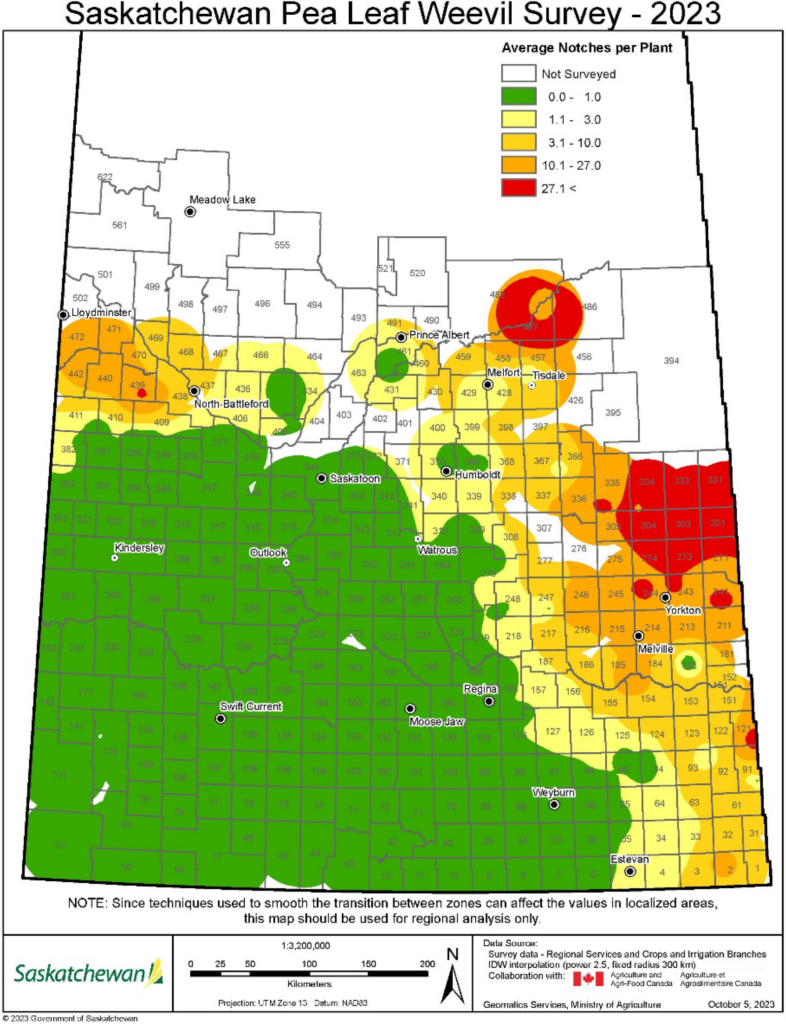
Pea leaf weevil populations were surveyed again in 2023. This invasive insect continues to expand its range in the north and east. Populations increased substantially again in 2023 in a large region extending from the east to northwestern pea production areas. Heavy feeding pressure was reported in faba beans in the Northwest. Pea and faba growers in these areas should consider the use of insecticidal seed treatments to limit damage. Neonicotinoid seed treatments remain the best protection against the pea leaf weevil in field peas when numbers warrant.
Seed Quality Survey
The interim results (as of January 4, 2024) of commercial plate tests for seed-borne pathogens of 268 field pea, 349 lentil, and 55 chickpea samples are summarized in Tables 8-9. The nine-year summary of the seed quality survey in Table 9 shows 2023 interim data compared to 2015-2022 results. The number of pathogen-free samples (PFS) continues to be very high across key seed-borne diseases evaluated in field pea, lentil, and chickpea samples with only Ascochyta in field pea at levels below 87%. Alternatively, 95.7% of lentil samples assessed for Ascochyta were pathogen-free. Generally, mean severity of infected samples was much lower than final seed survey results from 2022. The 2023 interim data for Ascochyta in chickpea indicates a higher proportion of PFS and lower mean infection level relative to 2015-2022 data with 2023 having the lowest mean infection over the past nine years at 0.3% and second highest amount of PFS, second only to 2017 (97.2%). Ascochyta in lentil is on the lower end of average for PFS but is showing the lowest mean infection since 2015 (0.1%). Just over half of the field pea samples tested had PFS and was comparable to 2022’s results with mean infection 0.5% lower than 2022. Anthracnose in lentil is at a historic high for PFS and a historic low for mean infection. Read this factsheet to learn more about seed tests and how they can benefit your farm operation.
Table 8. 2023 Saskatchewan Seed Sample Results by Crop District for Seed-Borne Ascochyta and Anthracnose
| Crop District | Lentil | Field Pea | Chickpea | |||||
| Ascochyta | Anthracnose | Ascochyta | Ascochyta | |||||
| PFS1 | Mean2 | PFS | Mean | PFS | Mean | PFS | Mean | |
| (%) | ||||||||
| 1A | 100 | 0 | 100 | 0 | 76.9 | 0.8 | – | – |
| 1B | – | – | – | – | 91.7 | 0.5 | – | – |
| 2A | 100 | 0 | 92.5 | 1.3 | 90.9 | 0.5 | 100 | 0 |
| 2B | 97.4 | 0.3 | 100 | 0 | 60 | 0 | 88.9 | 0.8 |
| 3AN | 100 | 0 | 100 | 0 | – | – | 85.7 | 0.5 |
| 3AS | 100 | 0 | 100 | 0 | 88.9 | 0.5 | 84.2 | 0.3 |
| 3BN | 100 | 0 | 100 | 0 | 92.3 | 0.5 | 66.7 | 1 |
| 3BS | 100 | 0 | 100 | 0 | – | – | 100 | 0 |
| 4A | 100 | 0 | 100 | 0 | 100 | 0 | – | – |
| 4B | 100 | 0 | 100 | 0 | 66.7 | 1.8 | – | – |
| 5A | 100 | 0 | 100 | 0 | – | – | – | – |
| 5B | – | – | – | – | 10.5 | 2 | – | – |
| 6A | 93.9 | 0.4 | 100 | 0 | 61.1 | 1.2 | 100 | 0 |
| 6B | 94.4 | 0.6 | 93.1 | 0.3 | 57.1 | 2 | – | – |
| 7A | 98.3 | 0.3 | 100 | 0 | 63.6 | 0.5 | 100 | 0 |
| 7B | 66.7 | 0.4 | 100 | 0 | 58.8 | 1 | – | – |
| 8A | – | – | – | – | 5.9 | 2.3 | – | – |
| 8B | 0 | 0.4 | 100 | 0 | 16.7 | 2.6 | – | – |
| 9A | 50 | 0.8 | 100 | 0 | 60 | 1.2 | – | – |
| 9B | – | – | – | – | 30 | 1.8 | – | – |
| Average | 95.7 | 0.2 | 98 | 0.1 | 55.2 | 1.1 | 87.3 | 0.3 |
1 PFS – percent of samples that are pathogen-free (pathogen-free samples)
2 Mean – average infection level of samples with disease
Source of interim seed quality data for 2023: Prairie Diagnostic Seed Lab, 1105 Railway Ave., Weyburn, SK; 20/20 Seed Labs Inc., 507 – 11th Ave., Nisku, AB; Discovery Seed Labs Ltd., 450 Melville St., Saskatoon, SK
Table 9. Nine-Year Summary of Pulse Seed Samples Tested at Accredited Labs from Seed Grown From 2015-2023 in Saskatchewan (2023 data is interim results as of January 4, 2024)
| Crop | Pathogen | 2015 | 2016 | 2017 | 2018 | 2019 | 2020 | 2021 | 2022 | 2023 (int.) | |||||||||
| PFS1 | Mean2 | PFS | Mean | PFS | Mean | PFS | Mean | PFS | Mean | PFS | Mean | PFS | Mean | PFS | Mean | PFS | Mean | ||
| (%) | |||||||||||||||||||
| Lentil | Ascochyta | 2022 | 0.1 | 2022 | 0.4 | 98.1 | 0.9 | 98 | 0.4 | 95.5 | 0.8 | 97.9 | 0.5 | 99.3 | 0.4 | 91.8 | 0.4 | 95.7 | 0.2 |
| Anthracnose | 72.4 | 1 | 60.4 | 0.8 | 95.1 | 0.7 | 94.1 | 0.5 | 89.2 | 0.9 | 85.3 | 1.2 | 97.2 | 0.9 | 85.6 | 1.1 | 98.0 | 0.1 | |
| Botrytis | 54.8 | 1.8 | 14.8 | 3.3 | 90.3 | 1.1 | 96.2 | 1 | 93.2 | 1 | 95.9 | 0.8 | 98.5 | 0.5 | 97.7 | 0.9 | 98.6 | 0.1 | |
| Sclerotinia | 90.3 | 0.4 | 33.3 | 1 | 95.4 | 0.8 | 97.7 | 0.5 | 96 | 0.7 | 97.8 | 0.5 | 99.8 | 0.3 | 97.7 | 0.7 | 99.4 | 0.05 | |
| Pea | Ascochyta | 36.5 | 2.4 | 8.4 | 5.4 | 66.4 | 1.6 | 59 | 2.4 | 36.3 | 4.7 | 33.9 | 2.8 | 75.9 | 1.2 | 53.6 | 1.6 | 55.2 | 1.1 |
| Botrytis | 74.8 | 1.6 | 61.1 | 0.9 | 93.3 | 0.6 | 99.1 | 0.9 | 93.6 | 1 | 93.6 | 0.8 | 99.5 | 0.6 | 96.8 | 0.9 | 99.6 | 0.1 | |
| Sclerotinia | 90.6 | 0.3 | 78.3 | 0.7 | 98.5 | 0.4 | 99.2 | 0.6 | 99 | 0.6 | 99.1 | 0.6 | 100 | 0 | 97.3 | 1.1 | 98.9 | 0.1 | |
| Chickpea | Ascochyta | 40 | 4.1 | 65.6 | 4.7 | 97.2 | 0.6 | 74.9 | 1.2 | 51.3 | 3.2 | 44.1 | 3.2 | 71.6 | 0.7 | 62.2 | 1.4 | 87.3 | 0.3 |
| Botrytis | 42.4 | 3.8 | 37 | 8.4 | 100 | 0 | 96.3 | 1.1 | 86.6 | 1.9 | 87.1 | 1.1 | 96.7 | 0.4 | 98.7 | 0.8 | 100 | 0 | |
| Sclerotinia | 83.3 | 0.5 | 74.1 | 2 | 100 | 0 | 98.1 | 2.2 | 89.8 | 0.9 | 99.3 | 0.3 | 98.7 | 0.7 | 100 | 0 | 100 | 0 | |
1 PFS – percent of samples that are pathogen-free (pathogen-free samples)
2 Mean – average infection level of samples with disease
Source: Saskatchewan Pulse Growers
To understand the risks and potential damage associated with these pests, the Ministry of Agriculture and its partners monitor the presence, abundance and impact of important crop pests in Saskatchewan. This information is used to build forecast maps and make recommendations for control. Data from the pest surveys are archived and used as a reference to see historical trends that can be used to guide research initiatives or identify changes in pest pressure. Pest-related research is also supported through pest surveys via the collection of samples used by researchers in studies.
To participate in the survey program enroll your farm today via this online sign-up form.
Acknowledgements
Saskatchewan Pulse Growers would like to thank the many people that helped with the coordination and carrying out of the surveys including: Saskatchewan Ministry of Agriculture, Saskatchewan Crop Insurance Corporation, Saskatchewan Association of Rural Municipalities Plant Health Officers, Agriculture and Agri-Food Canada, University of Saskatchewan, and the many industry partners and agronomists. Thank you to those growers who signed up their fields to allow the surveys to be completed.
Contributors/Authors:
- 20/20 Seed Labs Inc. (Nisku, AB)
- Alireza Akhavan, Provincial Specialist, Plant Disease, Saskatchewan Ministry of Agriculture
- Brian Olson, contractor for seed quality survey
- Carter Peru, Integrated Pest Management Agrologist, Saskatchewan Ministry of Agriculture
- Discovery Seed Labs Ltd. (Saskatoon, SK)
- Dr. James Tansey, Provincial Specialist, Insect/Pest Management, Saskatchewan Ministry of Agriculture
- Dr. Michelle Hubbard, Research Scientist, Pulse Pathology, Agriculture and Agri-Food Canada
- Prager Lab, University of Saskatchewan
- Mike Brown, Agronomy Manager, Saskatchewan Pulse Growers
- Prairie Diagnostic Seed Lab (Weyburn, SK)

Published February 2024
