Published March 2023
Overview
The chickpea health issue, first reported during the 2019 growing season, was observed for a fourth straight season in 2023. Although a single cause of the chickpea health issue has not been identified to date, field investigations and research initiatives have attempted to rule out a variety of possible contributing factors. Analysis is ongoing and the following report summarizes the 2022 season and recent analysis. Additional information on symptoms, evaluations, and research progress from previous growing seasons can be found in the 2020 and 2021 Saskatchewan Chickpea Health Issue Updates.
2022 Surveillance & Monitoring
Widespread chickpea field monitoring, surveying, and sample collection was conducted again during the 2022 growing season. A survey of 81 chickpea fields across 31 rural municipalities (RMs) was led by Dr. Michelle Hubbard, Research Scientist with Agriculture and Agri-Food Canada (AAFC) in Swift Current. These fields were assessed in late June to early August and, in 29 of the 81 fields, aboveground chickpea growth was rated for severity of symptoms associated with the chickpea health issue on a scale of 0-5. Fields were categorized as either entirely healthy, entirely unhealthy, or a mixture of healthy and unhealthy. The rating excluded symptoms consistent with Ascochyta blight infection or other factors. Many fields were classified as healthy or unhealthy, rather than being rated on the 0–5 scale.
Samples from the associated rating spots within these fields were also collected and submitted to Dr. Hubbard’s research team and colleagues for further analysis, including:
- Nutrient Analysis: Dr. Jeff Schoenau, University of Saskatchewan
- Soil Bioassay: Dr. Anna Szmigielski, University of Saskatchewan
- Nematodes: Dr. Mario Tenuta, University of Manitoba
- Virus: Dr. Sean Prager, University of Saskatchewan
- Root Rot: Dr. Sabine Banniza, University of Saskatchewan
Detailed field histories were also obtained from growers for as many fields as possible as part of the chickpea survey to try to better understand possible connections between the severity and distribution of the chickpea health issue with environmental conditions and management factors.
Survey rating scale (0-5) based percent plant area affected (PAA) by symptoms of chickpea health issue:
| 0 | NONE | no symptoms |
| 1 | LOW | <10% PAA, new growth wilted, some leaf tip chlorosis |
| 2 | MODERATE | 10 to 30% PAA chlorotic/necrotic |
| 3 | HIGH | 30 to 60% PAA chlorotic/necrotic |
| 4 | VERY HIGH | 60 to 90% PAA chlorotic/necrotic |
| 5 | DEAD | >90% PAA necrosis |
Saskatchewan Pulse Growers (SPG) closely monitored five of the fields that were included as part of the larger chickpea health survey throughout the growing season as part of a second season of a collaborative project with Crop Intelligence. These five fields were in the core of Saskatchewan’s chickpea growing region and in areas considered to be the most severely impacted by the chickpea health issue in previous seasons including Coronach, Mossbank, Assiniboia, Ogema, and Gravelbourg. The intent of this project, referred to as The Chickpea Project 2.0, was to better understand how environmental conditions influenced the onset and development of the chickpea health issue. Therefore, weather stations equipped with soil moisture probes were installed at each site and inspected weekly by SPG’s summer field intern. Further details on this initiative have been summarized in The Chickpea Project: 2022 Report.

Environmental Conditions
Environmental conditions in 2022 were generally more favourable to chickpea development and yield compared to the 2021 growing season with less extreme heat. However, in-season precipitation (May– August) accumulated between the two seasons was similar, according to data from Environment Canada weather stations located within the chickpea health survey region data averaged approximately 164 mm and 163 mm during the 2021 and 2022 growing seasons, respectively.
Table 1. In-season precipitation and temperature recorded at Environment Canada weather stations located within the survey region (May 1–August 31, 2022)
| District | RM | Location | Monthly In-Season Precipitation (mm) | Total In-Season Precipitation (mm) | Monthly In-Season Mean Maximum Temperature (°C) | ||||||
| May | June | July | August | May | June | July | August | ||||
| 2B | 161 | Moose Jaw | 61.0 | 24.9 | 68.2 | 26.3 | 180.4 | 11.5 | 16.8 | 19.2 | 20.0 |
| 3AS | 11 | Coronach | 60.7 | 32.2 | 77.6 | 7.5 | 178.0 | 10.1 | 15.9 | 19.7 | 20.9 |
| 12 | Rockglen | 58.6 | 36.7 | 49.3 | 4.7 | 149.3 | 10.2 | 16.1 | 20.4 | 21.4 | |
| 17 | Val Marie | 38.7 | 41.0 | 42.4 | 15.9 | 138.0 | 9.9 | 15.8 | 20.6 | 20.9 | |
| 72 | Assiniboia | 71.5 | 21.5 | 73.6 | 8.7 | 175.3 | 11.0 | 16.6 | 19.9 | 20.5 | |
| 3BN | 137 | Swift Current1 | 37.1 | 31.2 | 27.2 | 6.7 | 102.2 | 10.7 | 15.7 | 19.7 | 20.9 |
| 4A | 111 | Maple Creek | 36.8 | 123.2 | 46.5 | 17.4 | 223.9 | 11.0 | 15.5 | 20.3 | 21.5 |
| 4B | 231 | Leader | 24.9 | 52.5 | 29.7 | 8.3 | 115.4 | 11.3 | 16.0 | 20.4 | 21.3 |
| 6B | 284 | Outlook2 | 32.7 | 75.2 | 53.4 | 6.9 | 168.2 | 11.5 | 16.3 | 19.6 | 20.5 |
| 7A | 290 | Kindersley3 | 10.8 | 102.4 | 58.5 | 12.2 | 183.9 | 10.5 | 15.7 | 18.7 | 19.9 |
| 7B | 380 | Scott4 | 11.0 | 57.1 | 86.5 | 32.1 | 186.7 | 10.0 | 15.0 | 18.3 | 18.9 |
1 Swift Current weather station is not located in an RM that was surveyed but is bordering RMs that were surveyed (106 and 138).
2 Outlook weather station is not located in the surveyed RM in crop district 6B but is in nearby RM (284).
3 Kindersley weather station is not located in an RM that was surveyed but does represent the closest weather station in crop district 7A in nearest proximity to RM 261.
4 Scott weather station is not located in an RM that was surveyed but does represent the closest weather station in crop district 7B in nearest proximity to RM 351.
Moisture events following a dry period have historically been considered as a potential environmental trigger to the onset of symptoms. However, this was once again not the case in 2022. Instead, more fields reported average moisture levels prior to symptom onset or sampling and if the site was dry, it generally stayed at below average moisture levels for remainder of the season. All four seasons (2019– 2022) show drastically different monthly precipitation patterns in key chickpea growing regions compared to the thirty-year historical mean.
Periods of high and extended humidity have also been cited as a potential catalyst of symptom development. If humidity, and not only rainfall, is sufficient moisture to advance wilting symptoms, it offers a partial environmental explanation as to why symptoms are present even during the driest seasons such as 2021.
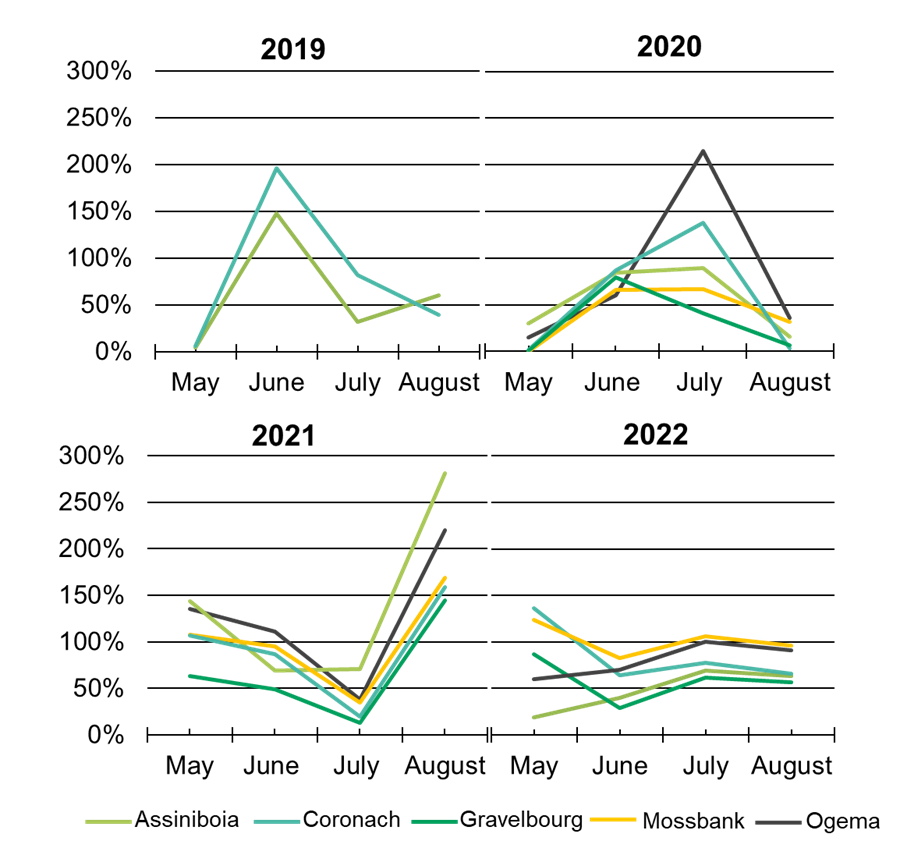
Source: Crop Intelligence
2022 Symptoms & Severity
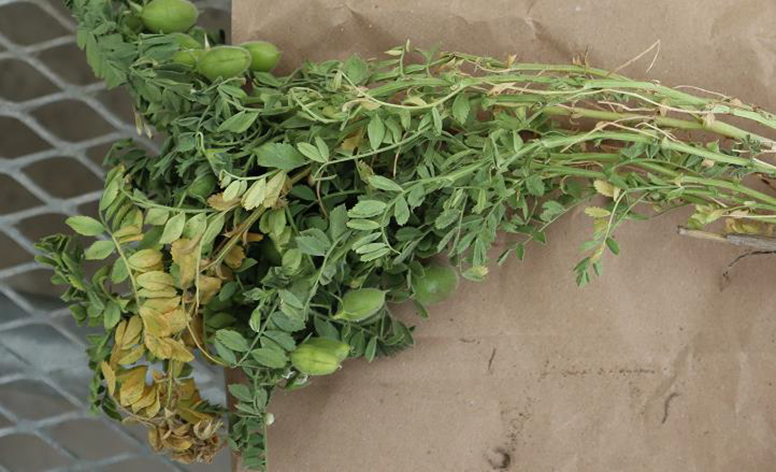
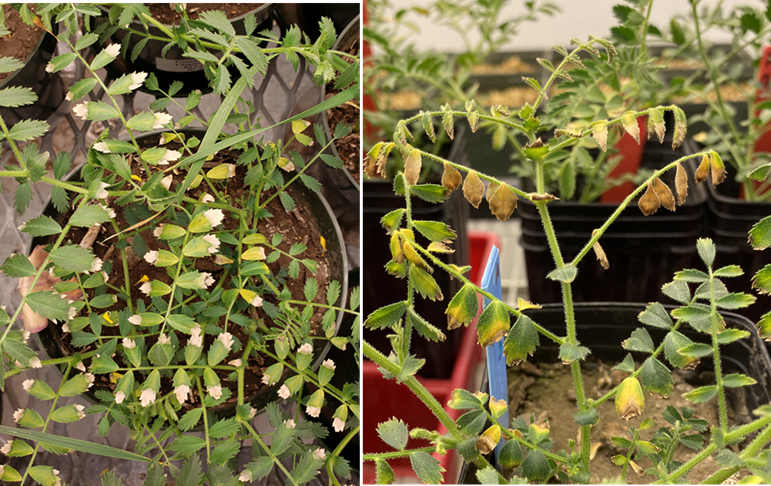
The first chickpea fields exhibiting symptoms of the health issue in the 2022 season were reported to SPG during the last week of June. These fields were both located within the Coronach region (RM of Poplar Valley, No. 12) and had not fully entered their flowering period. In both fields, symptomatic plants were found in patches that could not easily be explained by other landscape factors. Although June marked the start of the chickpea health symptoms, symptoms were also observed in chickpea fields throughout July and August with sampling occurring during late vegetative, flowering, and podding stages.

healthy chickpea plants in same field (right); samples collected near Coronach, SK on June 24, 2022.
Source: Vanessa Bell, Crop Intelligence
Chlorosis and necrosis of leaf margins and wilting, primarily of the mid-to-upper branches and leaflets, continued to be identified at the most common symptoms. The occurrence of symptoms within a field could not consistently be linked to landscape position. However, in many cases, it was observed that plant health decreased in challenging areas of the field such as eroded, rocky knolls or compacted regions (headlands, tracks). While these observations do not likely indicate a direct cause of the chickpea health issue, they may demonstrate an exacerbated stress response in these areas of the field.
Overall, symptom severity was quite low with an average rating of 1.6± 0.13 (0-none, 5-high). Despite these low mean survey ratings, there were examples of fields that were devastated during the 2022 growing season due to the initial onset of chickpea health wilting symptoms followed by aggressive infection of Ascochyta blight.

Source: Christina Franks, SPG
Effect of Field Management
Data collected from the 2022 survey did not provide conclusive evidence of links between chickpea health symptoms and agronomic management decisions. With too few fields rated as completely healthy and having corresponding agronomic information, it was not possible to ascertain management factors that may be influence onset of symptoms. From the field management history that was supplied, the following general patterns of variety selection, crop rotation, herbicide use, and fungicide use in 2022 were observed:
- CDC Leader was the dominate Kabuli chickpea variety and was grown in 88% in the fields reporting variety information. This variety gained popularity over CDC Orion during initial seasons of the chickpea health issue.
- CDC Lancer only recently became commercially available, so was only reported in a small number of fields during the 2022 growing season. More data is required to determine if potential for symptom severity differs from CDC Leader or CDC Orion, but it does not currently appear that there is a direct varietal relationship to the chickpea health issue.
- Crop rotation sequence continues to be highly variable across farms and fields, but majority of chickpea has been grown on cereal stubble during surveys.
- Increased frequency of chickpea in short-term rotation does not appear to be a contributing factor as there was at least four years between chickpea crops reported and there have also been fields in the survey without a direct previous history of chickpea in rotation.
- Reports of health issue symptoms are highest in the core chickpea growing region in South Central Saskatchewan (crop districts 3AS, 3AN); however, it is unclear if that is reflective of probability or linked to an overall increased intensity and frequency of chickpea production in the area during the last decade.
- Group 14 herbicides such as sulfentrazone (Authority®, Authority® Supreme), saflufenacil (Heat®) and carfentrazone (Aim®) were most commonly reported in pre-emergent herbicide applications.
- Metribuzin was reported as a post-emergent herbicide application in 47% of the fields with reported post-emergent herbicide histories in 2022. Although fields with metribuzin application had statistically higher symptom severity in previous survey years, it was not possible to assess symptoms severity in fields with or without metribuzin application because of the low number of fields with severity ratings and post-emergence herbicide information in 2022.
- An average of 2.79 fungicide applications were made in fields reporting fungicide data. The most used fungicides included Miravis® Neo, Delaro®, and chlorothalonil-based fungicides such as Bravo® or Echo®.
Seeding Date and Rate
Seeding date or rate has not been linked to symptom severity to date. However, observations from local agronomists and growers have suggested that fields with an earlier seeding date seem to be affected to a greater extent relative to those that are seeded later, but ahead of the Saskatchewan Crop Insurance deadline (May 21). In 2022, seeding dates ranged from May 1 to May 19, 2022. The average and the most common seeding date was May 10, 2022. Seed used included certified seed (5 fields), bin runs of 1–2, 2.4, 4–6, or 6+ years (4, 4, 8, and 1 fields). Seeding rates ranged from 110 to 195 lbs ac-1, with a mean of 154 lbs ac-1. Target plant populations varied between 3.0 and 4.8 plants ft-2.

Source: Christina Franks, SPG
Although a connection has also not been drawn between chickpea seeding rate and symptom severity, plant population density warrants further investigation in future seasons as there could be a connection to symptom development and increased humidity conditions within the canopy.
A very limited number of plant counts were performed by SPG in 2022 and they generally revealed very little differences between healthy and unhealthy fields or field regions except for one field situation near Assinibioa. At this site the symptoms first appeared, and stayed relatively contained, within a headland region where a seeder issue led to elevated plant stand densities (6.3 plants ft-2) compared to adjacent field regions (4.5 plants ft-2). Additional plant stand counts in affected and unaffected field areas will need to be conducted in future seasons to better understand if this observation is meaningful.
Recent Sample Analysis and Experimentation
Pathogen Analysis in Lentil

Source: Saskatchewan Pulse Growers
Symptoms that were reminiscent of the health issue in chickpea, including wilting and tip chlorosis on the mid and upper leaves, have also been observed in lentil. Fresh lentil samples were collected from various fields in South Central Saskatchewan and submitted to a commercial lab for analysis (Insight Plant Health, Saskatoon). Unhealthy tissue was plated and incubated before being examined unstained by light microscopy. DNA was sequenced from isolated fungi.
Fungal growth from diseased samples was consistent across all samples, with rapid white mycelial growth turning green-grey with age. All isolated fungi were morphologically identical and showed dark conidia that were brown and club-shaped with a distinctly narrow end. Conidia were also growing in chains rather than singly. These features are consistent with Alternaria, as opposed to Stemphylium and confirmed by DNA analysis. Sequencing results indicated an over 99% shared identity with several Alternaria species including A. fasciculata, A. arborescens, and A. alternata. Although the consistent prevalence of Alternaria across all samples suggests it is causative, Alternaria is a common saprophytic fungi and therefore may have infected opportunistically. Causes of these shared visual symptoms in lentil and chickpea require further investigation with additional sampling proposed during the 2023 growing season.
Nutrient Analysis and Responses

Source: Dr. Jeff Schoenau, University of Saskatchewan
Chickpea samples collected during the 2021 field survey and analyzed by Dr. Schoenau’s lab (University of Saskatchewan) for nutrient content have shown no significant differences of total nitrogen (N), phosphorus (P), or potassium (K) concentrations (µg/g) between healthy and unhealthy plant samples. Samples collected in the 2022 survey will also be analysed for differences in nutrient content.
Response to potash (KCl) fertilizer is currently being investigated by Dr. Schoenau and MSc. candidate Tristan Chambers. This study, with field and growth chamber experiments, was initiated in 2022 and intends to evaluate the yield and plant health responses of KCl fertilization on chickpea (CDC Leader), yield, disease resilience, and plant health. Results from the Central Butte field site in 2022 demonstrated a trend towards a small yield response of chickpea to KCl fertilization in the depressional landscape position, but it was not statistically significant. Additions of KCl did not impact chickpea health, Ascochyta blight, or root rot severity as overall health and disease issues at this site were low during the growing season.
Nemotodes

Source: Dr. Mario Tenuta and Fernanda Fouvea Pereira, University of Manitoba
Previous samples collected from Saskatchewan chickpea fields revealed counts of pin nematodes (Paratylenchus spp.) that far exceeded the threshold of when a plant may be impacted (200 per 100 gram of soil). These levels were unexpected and warranted further investigation during the 2022 growing season to understand if pin nematodes were contributing to the development health issue symptoms in chickpea. High numbers of pin nematodes were again extracted in chickpea soil and root samples by Dr. Mario Tenuta’s Soil Ecology Lab at the University of Manitoba. The overall mean number of Paratylenchus spp. extracted across all samples was 395 (± 114 SE) with some samples exceeding 1200 per 100 grams of soil. Samples representing unhealthy symptoms had a higher mean density of Paratylenchus spp. relative to samples corresponding to healthy chickpea. However, these differences were not statistically significant. At this point, it cannot be concluded that pin nematodes are causative to the chickpea health issue.
A concurrent greenhouse experiment was implemented to evaluate pin nematode preference for chickpea relative to alternative crop hosts. Results from this experiment indicate that chickpea is a host to Paratylenchus spp. with relatively consistent reproduction across three growth cycles of screening. Chickpea was considered a preferred host compared to wheat, lentil, and yellow pea in this study. The next phase of this greenhouse experiment is to compare the susceptibility of various chickpea classes and varieties to pin nematodes. Dr. Tenuta also suggests that microplot experiments with nematicides in the field will be necessary to reach conclusions regarding the influence of pin nematodes on chickpea health issue symptomology.
Soil Bioassay
Soil samples from healthy and unhealthy regions of surveyed chickpea fields were submitted to Dr. Szmigielski and Dr. Schoenau at the University of Saskatchewan for a bioassay that examines root and shoot length of sugar beet. Sugar beet, rather than chickpea, was used as a bioindicator species in this experiment due the sensitive response of sugar beet root growth to soil stresses. Sugar beet will demonstrate its sensitivity to soil residual herbicides in the form of root or shoot inhibition and this protocol was initially developed for the detection of soil-applied herbicide residues and potential carryover risk. The sugar beet assay was implemented in the chickpea health investigation to see if there were any patterns indicating a soil residual toxicity. Although there are some herbicide actives, such as sulfentrazone, that would affect sugar beet but not chickpea, a consistent pattern of root and shoot inhibition in unhealthy samples or those collected from the most severely impacted fields could indicate that residues in the soil are a potential driver of the chickpea health symptoms.
Bioassays and subsequent root and shoot measurements were replicated three times per sample and compared to a clean reference soil sample, collected from an upper slope of a Central Butte soil, with a known history. Root and shoot lengths less than 5 cm and 2.5 cm, respectively, would indicate the presence of a soil residual toxicity. Comparatively root lengths longer than 6 cm and shoot lengths exceeding 3 cm are indicative of no herbicides present or suspected risk of soil toxicity. Intermediate root and shoot length measurements are more difficult to conclusively interpret without additional knowledge of the soil properties and substance suspected of the toxicity.
Table 2. Root and shoot length (cm) of sugar beet plants gown for seven days in soil samples representing various chickpea symptoms.
| Description | n | Mean Root Length | Mean Shoot Length |
| (cm) ± SD | |||
| Reference Soil (upper slope Central Butte) | 1 | 7.1±0.43 | 3.8±0.21 |
| Healthy | 11 | 6.3±0.68 | 2.7±0.25 |
| Unhealthy | 32 | 6.6±0.49 | 2.5±0.21 |
| Unknown | 4 | 4.1±0.44 | 1.5±0.34 |
| All 2022 samples (regardless of symptom label) | 47 | 6.3±0.50 | 2.5±0.23 |
Source: Dr. Jeff Schoenau and Dr. Anna Szmigielski, University of Saskatchewan
On average, all samples from chickpea fields had a lower mean root and shoot length compared to the reference sample, but this result was not statistically significant. Nor were differences between samples specifically designated as healthy or unhealthy and some of the samples collected from the most severely impacted fields had among the highest mean shoot lengths and even longer root lengths than the reference soil. Results of this bioassay are inconclusive with no strong relationship to observations of the chickpea health issue.
Metribuzin and Herbicide Layering Experiments

Source: Dr. Shaun M. Sharpe, Saskatoon Research and Development Centre, AAFC.
Greenhouse studies conducted by Dr. Shaun Sharpe, Research Scientist with AAFC in Saskatoon, were initiated in 2021 and continued into 2022. These experiments were designed to try to induce chickpea health symptoms through various watering regimes, herbicide stress, and soil sources. The most recently completed experiment examined the interaction between water regime and metribuzin dose and found a statistically significant effect (P<0.01) on the percent of accumulated chlorosis on the plants and on pod production. Chickpea plants that received the labeled metribuzin dose had 42% accumulated chlorosis after 2 weeks and 40 to 56% chlorosis by 6 weeks for the water stress and well-watered treatments, respectively (Table 3). Pod production was negatively impacted by the labeled dose of metribuzin, comparable to 3 weeks of water stress (Figure 9).
Table 3. Impact of metribuzin dose and irrigation regime on chickpea accumulated chlorosis and necrosis at two measurement timings when grow in a greenhouse in Saskatoon, SK in 2021 to 2022.
| Metribuzin dose | Accumulated Chlorosis and Necrosis | |||
| g ai ha-1 | g ai ac-1 | 2 WAT* | 6 WAT* | |
| Water Stress | Well-Watered | |||
| % of plant | ||||
| 0 | 0 | 2 c | 24 abc | 2 c |
| 103 | 41.7 | 16 b | 22 bc | 1 c |
| 206 | 83.4 | 42 a | 40 ab | 56 ab |
| 413 | 167.1 | 63 a | 56 ab | 91 a |
* WAT = weeks after metribuzin treatment.
Source: Dr. Shaun M. Sharpe, Saskatoon Research and Development Centre, AAFC.
Given that chlorosis was induced by metribuzin, but wilt symptoms were not, these results may be representative of general metribuzin injury and not necessarily linked directly to chickpea health symptoms. These experiments were conducted in the greenhouse so the degree of injury may not be as high in field settings.
Small plot trials investigating if chickpea health symptoms could be induced by herbicide layering were in initiated by Wheatland Conservation Area and SPG at two site locations (Swift Current and Hodgeville) during the 2022 growing season. Pre-emergent herbicide treatments of Edge® or Authority® were treated with or without metribuzin as a post-emergent herbicide application. These treatment combinations were also fertilized with 0 or 35 lbs ac-1 of potash fertilizer to complement on-going potash studies fromDr. Schoenau’s research team.
Preliminary results of the herbicide layering study at Swift Current and Hodgeville indicated that there was no serious injury from metribuzin application and that combinations of pre-emergent Authority® and post-emergent metribuzin generally resulted in the highest weed control followed by Edge® and metribuzin. The impact of potash fertilization was minor on any herbicide combination; although potash treatments appeared to be more vigorous this did not have an impact on in-season biomass or offer a consistent benefit to yield. Symptoms of the chickpea health issue were not observed at either site location in 2022.
Drought and Disease Experiments

Source: Dr. Michelle Hubbard, AAFC
In recent greenhouse experiments conducted by Dr. Hubbard, chickpea (CDC Leader) appeared to be more susceptible to Ascochyta blight after having been subjected to drought stress during vegetive growth and well water before being inoculated with Ascochyta. Indoor drought trials performed with both CDC Leader and CDC Orion Kabuli chickpea varieties under three moisture regimes (well watered, mild drought, and severe drought), indicate that CDC Orion was sometimes more tolerant of severe drought compared to CDC Leader; however, CDC Leader was sometimes less negatively impacted by mild drought relative to CDC Orion.
Soil Experiments
The ongoing potash response studies, led by Dr. Schoenau and Tristan Chambers, uncovered an unexpected and rapid inducement of health issue symptoms in chickpea grown in pots with sandy loam (non- autoclaved) soil belonging to the Chaplin association. These symptoms occurred in all fertility treatments (potash, monoammonium phosphate, and copper sulfate fertilizers) including the unfertilized control, so there does not appear to be link between symptoms and plant nutrition.
This Chaplin sandy loam soil was shared with Dr. Hubbard to determine if symptom development could be replicated. In Dr. Hubbard’s experiment, chickpea was grown in Chaplin soil that was either autoclaved (sterilized) or non-autoclaved. Symptoms appeared more quickly in the autoclaved soil treatments but did also eventually appear in non-autoclaved treatments in Dr. Hubbard’s experiment. Further investigations using this Chaplin soil will be initiated.
In a separate KCl pot study with a Swinton loam, soil health issue symptoms were again observed in chickpea plants by Dr. Schoenau’s lab. Mustard and durum crops were also planted in this soil with no observable plant health impact.
The chickpea seeds were treated with fungicide before seeding but no herbicide or foliar fungicide applications were made in the chamber. The chamber was baked and cleaned prior to the chamber experiment with each soil.
Source: Tristen Chambers (left), Maria Erika Pamisaran (right)
Next Steps
Areas of Further Investigation and Experimentation
- Verticillium dahlia (causative pathogen of Verticillium wilt) inoculation in controlled environment
- Additional interactions of drought, Ascochyta, and variety
- Interactions of drought, herbicide, and Ascochyta
- Possible analysis of herbicide residues in plant tissues
- Further virus testing with next generation sequencing techniques
- Potential genetic testing of chickpea seed lot
- Field analysis with hyperspectral radiometer technology
- Complete elemental analysis of chickpea plant material
2023 Field-Scale Monitoring and Surveillance
The chickpea plant health survey is proposed to continue for another season in 2023 with a similar protocol plan as in 2022. If you are a grower who would like to participate 2023 chickpea health surveys, please consider enrollment through the online sign-up form. For additional information on the chickpea health issue, please contact Dr. Hubbard.
Saskatchewan Pulse Growers will again have a summer field intern on staff for the 2023 growing season. Located in Southern Saskatchewan, this intern will have a primary role in monitoring and surveillance of chickpea fields including five key sites that will be established for a third year of the collaborative field project with Crop Intelligence.
Acknowledgements
Thank you to all the growers who supported the surveys by providing access to their fields and contributing field history information.
Funding support contributed towards various aspects of these research projects and field investigations has been provided by the Agriculture Development Fund (Saskatchewan Ministry of Agriculture), Crop Intelligence, Saskatchewan Pulse Growers, and Western Grains Research Foundation. Saskatchewan Pulse Growers would like to thank the many individuals who have contributed their time and expertise to understanding the chickpea health issue in the past seasons.
Special appreciation is extended to the many surveyors and agronomists who collected samples during the 2022 season including and who engaged with the survey through notification of symptoms: Angie Berner and Andrea Setrum (Richardson Pioneer), Alysa Thompson (AA Agronomy Consulting), Carolyn Wilson and Paige MacMillan (Syngenta), Jennifer Bingham (Pioneer Co-op), Kelsey Godson (JMAS), Melanie Leppa (Soils and Such), Vanessa Bell (Crop Intelligence), and survey teams with Saskatchewan Ministry of Agriculture, Saskatchewan Crop Insurance, Saskatchewan Association of Rural Municipalities.
Contributors/Authors:
- Dr. Anna Szmigielski, Research Scientist (Soil Science), University of Saskatchewan
- Dr. Jeff Schoenau, Professor (Soil Science), University of Saskatchewan
- Dr. Mario Tenuta, Professor (Soil Ecology), University of Manitoba
- Dr. Michelle Hubbard, Research Scientist (Pulse Pathology), Agriculture and Agri-Food Canada
- Dr. Ryan Hangs, Research Associate (Soil Science), University of Saskatchewan
- Dr. Shaun Sharpe, Research Scientist (Weeds), Agriculture and Agri- Food Canada
- Amber Wall, Research Technician, Wheatland Conservation Area
- Christina Franks, Summer Field Intern (2022), Saskatchewan Pulse Growers
- Fernanda Fouvea Pereira, Biology Program Director (Soil Ecology), University of Manitoba
- Maria Erika Pamisaran, Student, Agriculture and Agri-Food Canada
- Sarah Anderson, Agronomy Manager, Saskatchewan Pulse Growers
- Tristan Chambers, MSc. Candidate (Soil Science), University of Saskatchewan
- Vanessa Bell, Agronomist, Crop Intelligence