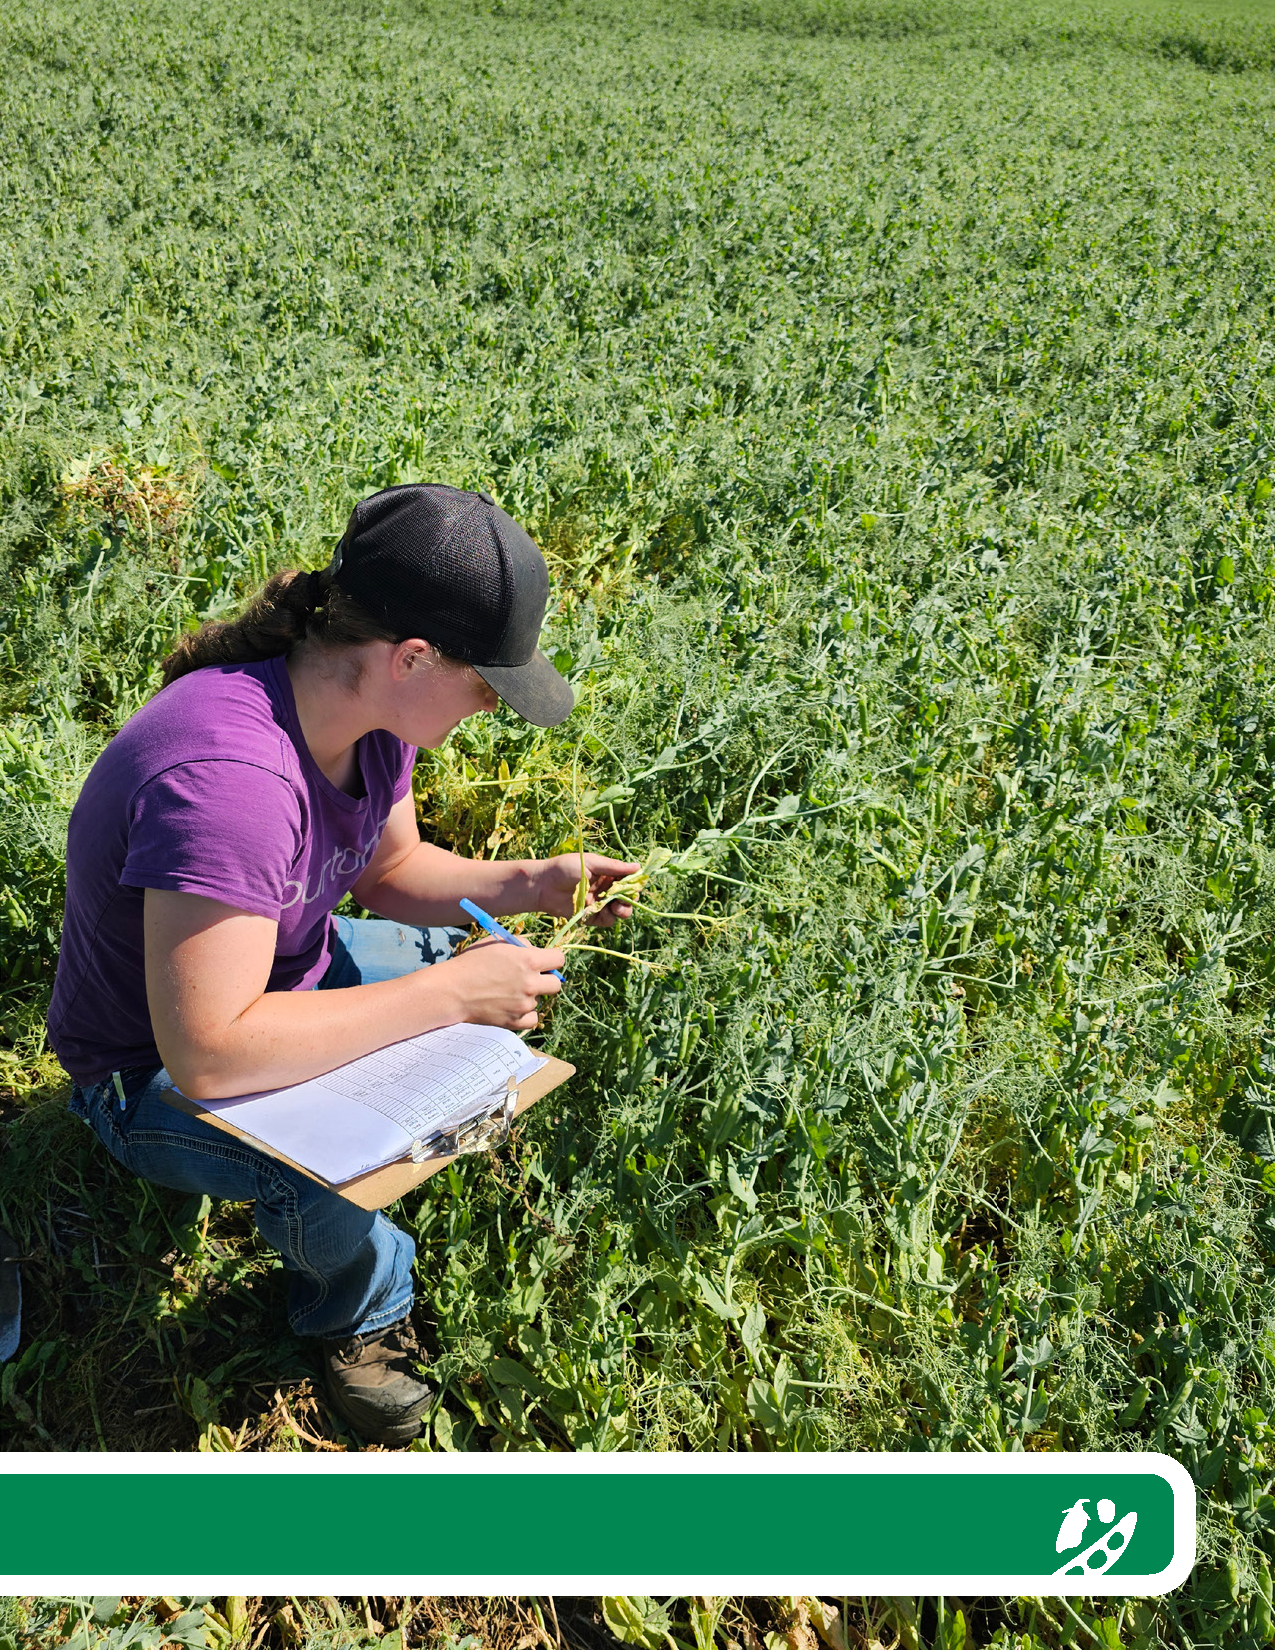
Each year, the Saskatchewan pulse and cereal commissions partner with commercial seed testing laboratories to complete an annual survey of seed-borne pathogens measured on seeds grown in Saskatchewan during the previous season. All labs that offer seed testing services to Saskatchewan growers are invited to participate in the annual survey with anonymous reporting of results amalgamated by crop district from all participating labs.
Interim seed quality data, collected from the time of harvest to the end of December, are summarized and communicated to growers, agronomists, researchers, and industry during the winter months, ahead of the next crop season. These interim results provide insights into seed quality trends and identify potential hotspots for seed-borne pathogens across the province. A final summary of results, including data from seed samples analyzed after the interim results, is reported at the end of May. This final summary is submitted for publication in the Canadian Phytopathological Society Canadian Plant Disease Surveys. This publication of the provincial survey provides a record of seed-borne pathogen trends in pulse and cereal crops and allows for continued tracking of diseases over time. This document is intended to summarize the results to provide trends in the province and crop districts. These results should not be used in the absence of testing and extra caution should be used when interpreting results with very few samples. Sample size is indicated for each crop district on the maps. For the 2024 interim report, data from 2,013 harvested seed samples were submitted of which 760 were from pulses and 1,253 from cereals.
Acknowledgments
The provincial seed survey would not be possible without the participation of 20/20 Seed Labs Inc., Discovery Seed Labs, Prairie Diagnostic Seed Labs, and SGS Canada. Lendon Seed Labs also participates in the survey but shares final results only. Thank you to all lab partners for their continued effort and support of this project. Brian Olson, independent contractor, is also gratefully acknowledged for his coordination of the seed quality survey and summarization of results. A special thanks is also extended to Dr. Randy Kutcher and Dr. Sabine Banniza from the University of Saskatchewan for their external review and pathology expertise. External review efforts of Dr. Alireza Akhavan, Provincial Plant Disease Specialist and Dale Risula, Provincial Pulses, Forages, and Specialty Crops Specialist, of the Saskatchewan Ministry of Agriculture (SMA) are also recognized with an extra note of appreciation to Dr. Alireza Akhavan and the SMA Geomatics team for creating the seed-borne pathogen maps by crop district.
Thank You to our 2024 Interim Results Lab Partners
20/20 Seed Labs
507 – 11 Avenue
Nisku, AB T9E 7N5
Phone: 1-877-420-2099
Discovery Seed Labs
450 Melville Street
Saskatoon, SK S7J 4M2
Phone: 1-306-249-4484
SGS
310 – 280 Portage Close
Sherwood Park, AB T8H 2R6
Phone: 1-800-952-5407
Prairie Diagnostic Seed Lab
140 1st Street
Weyburn, SK S4H 0T2
Phone: 1-306-842-7375
Germination Results
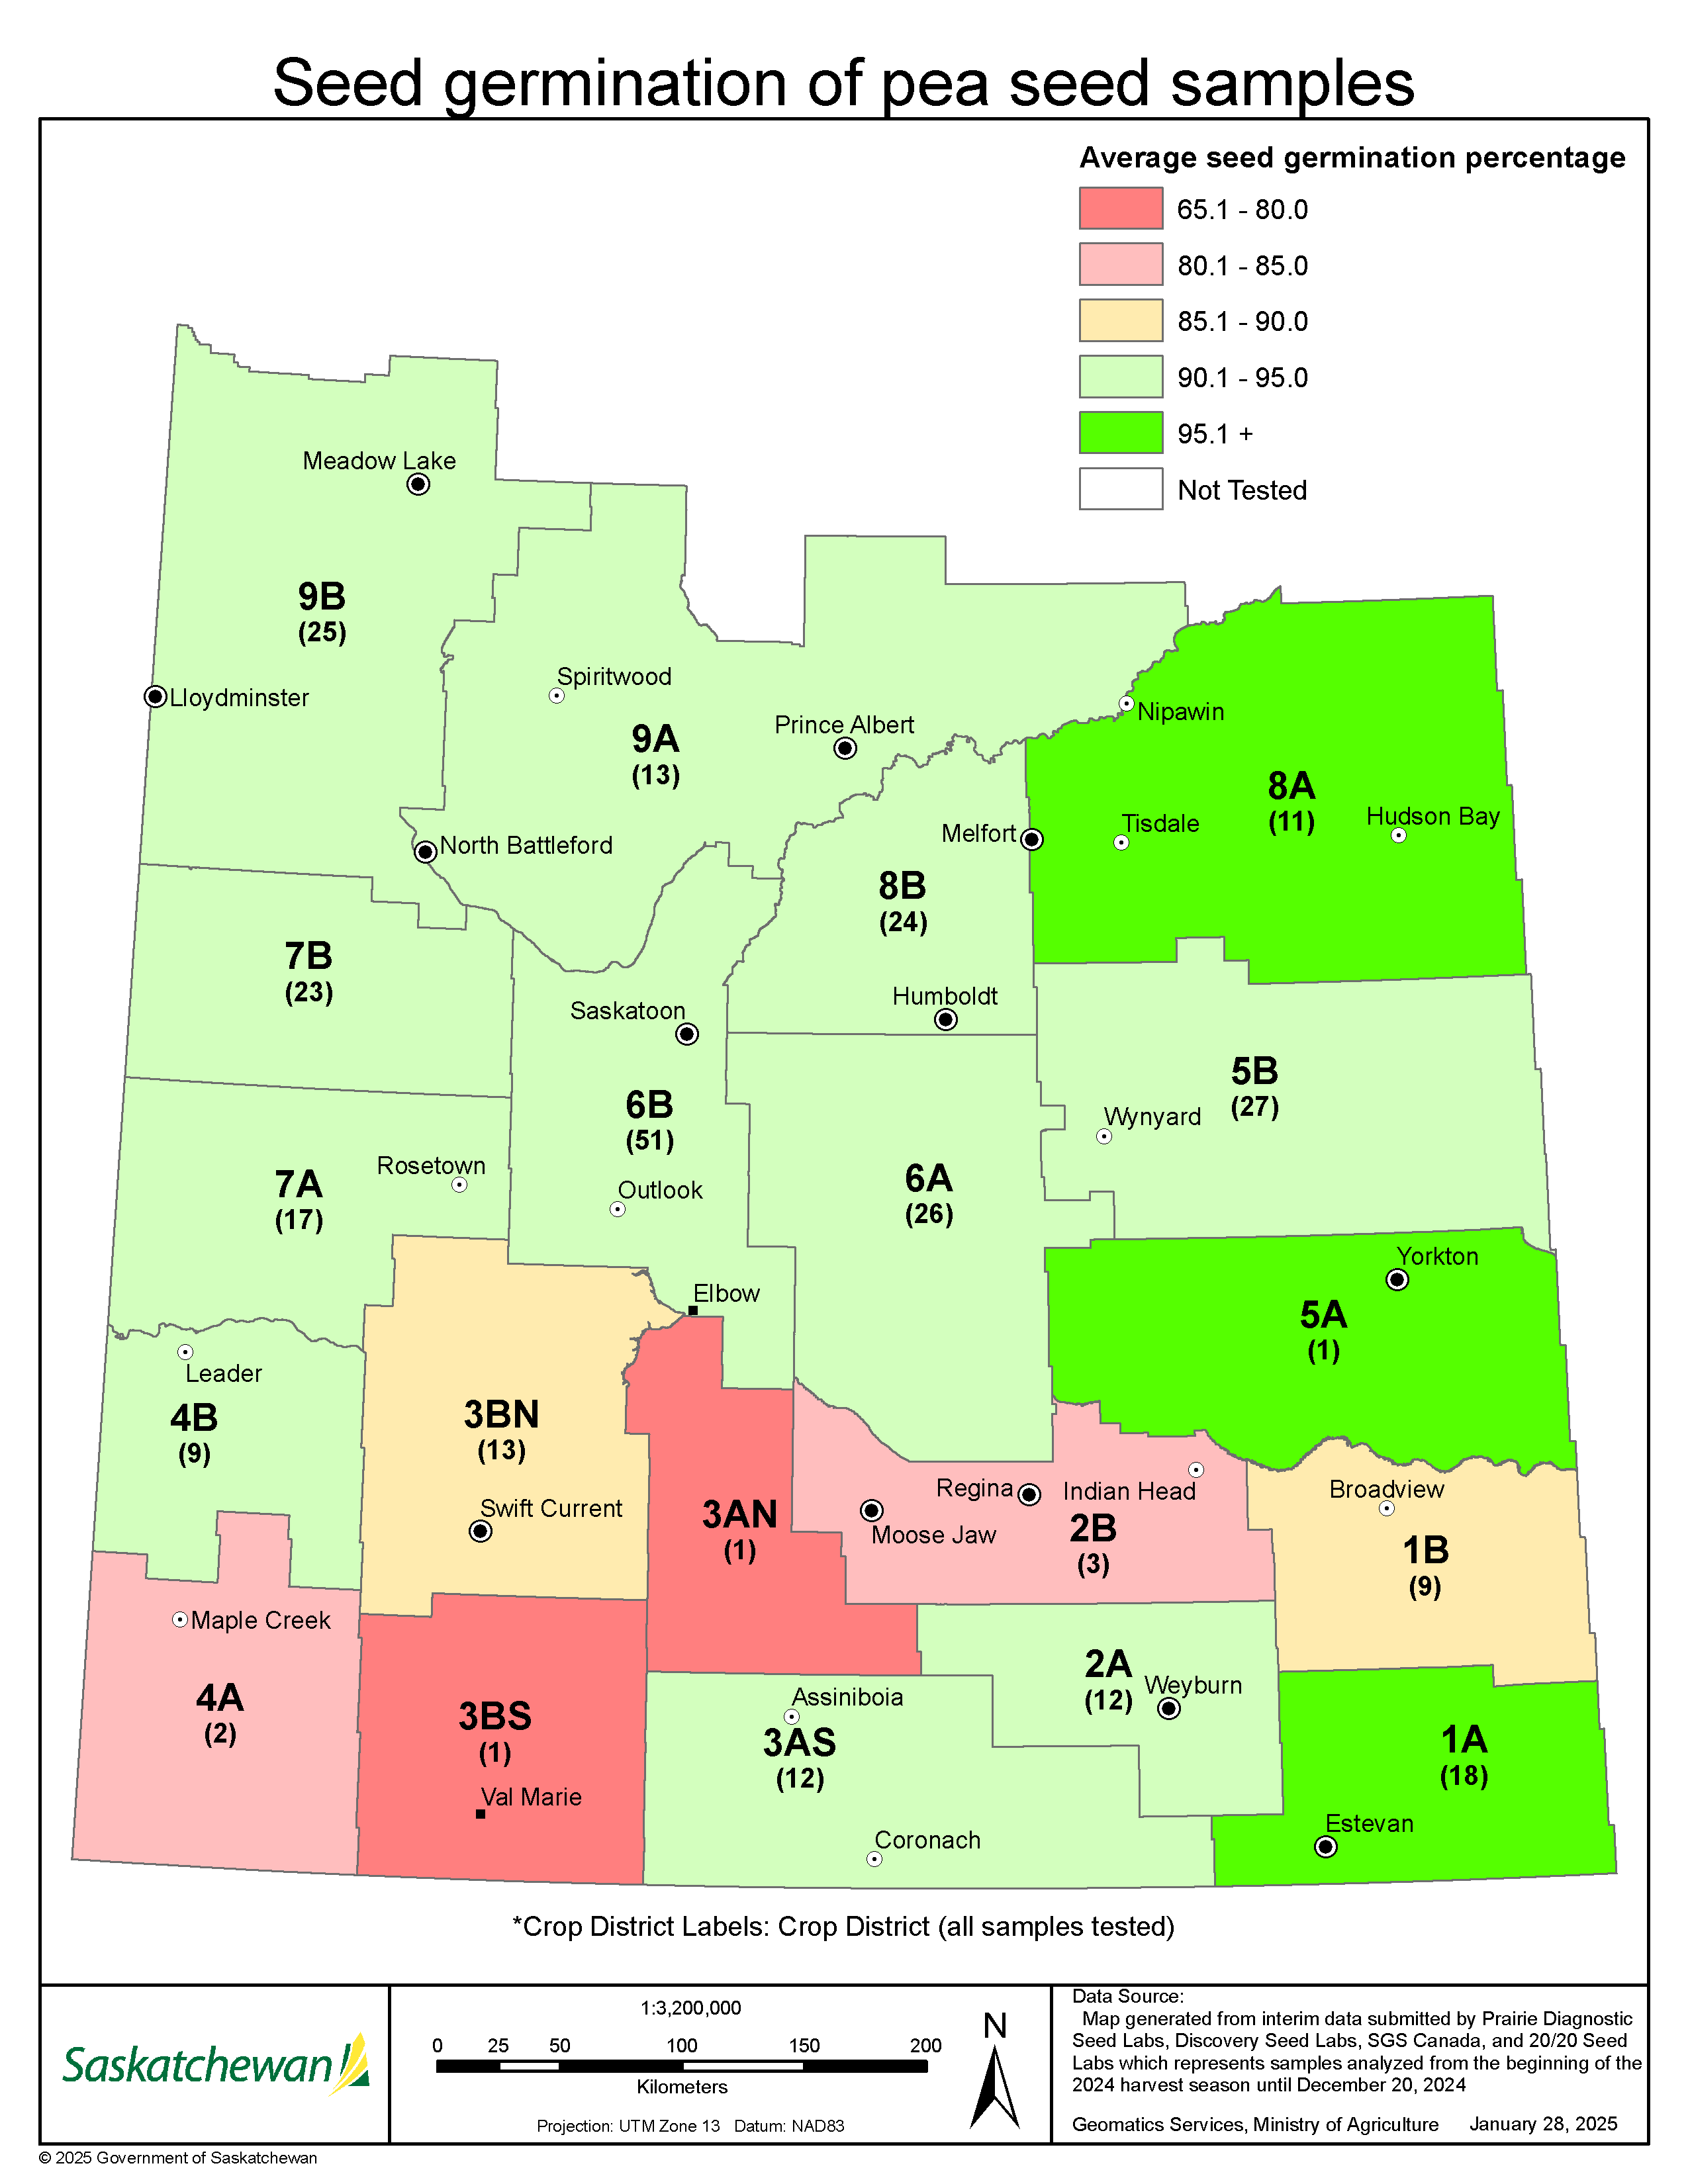
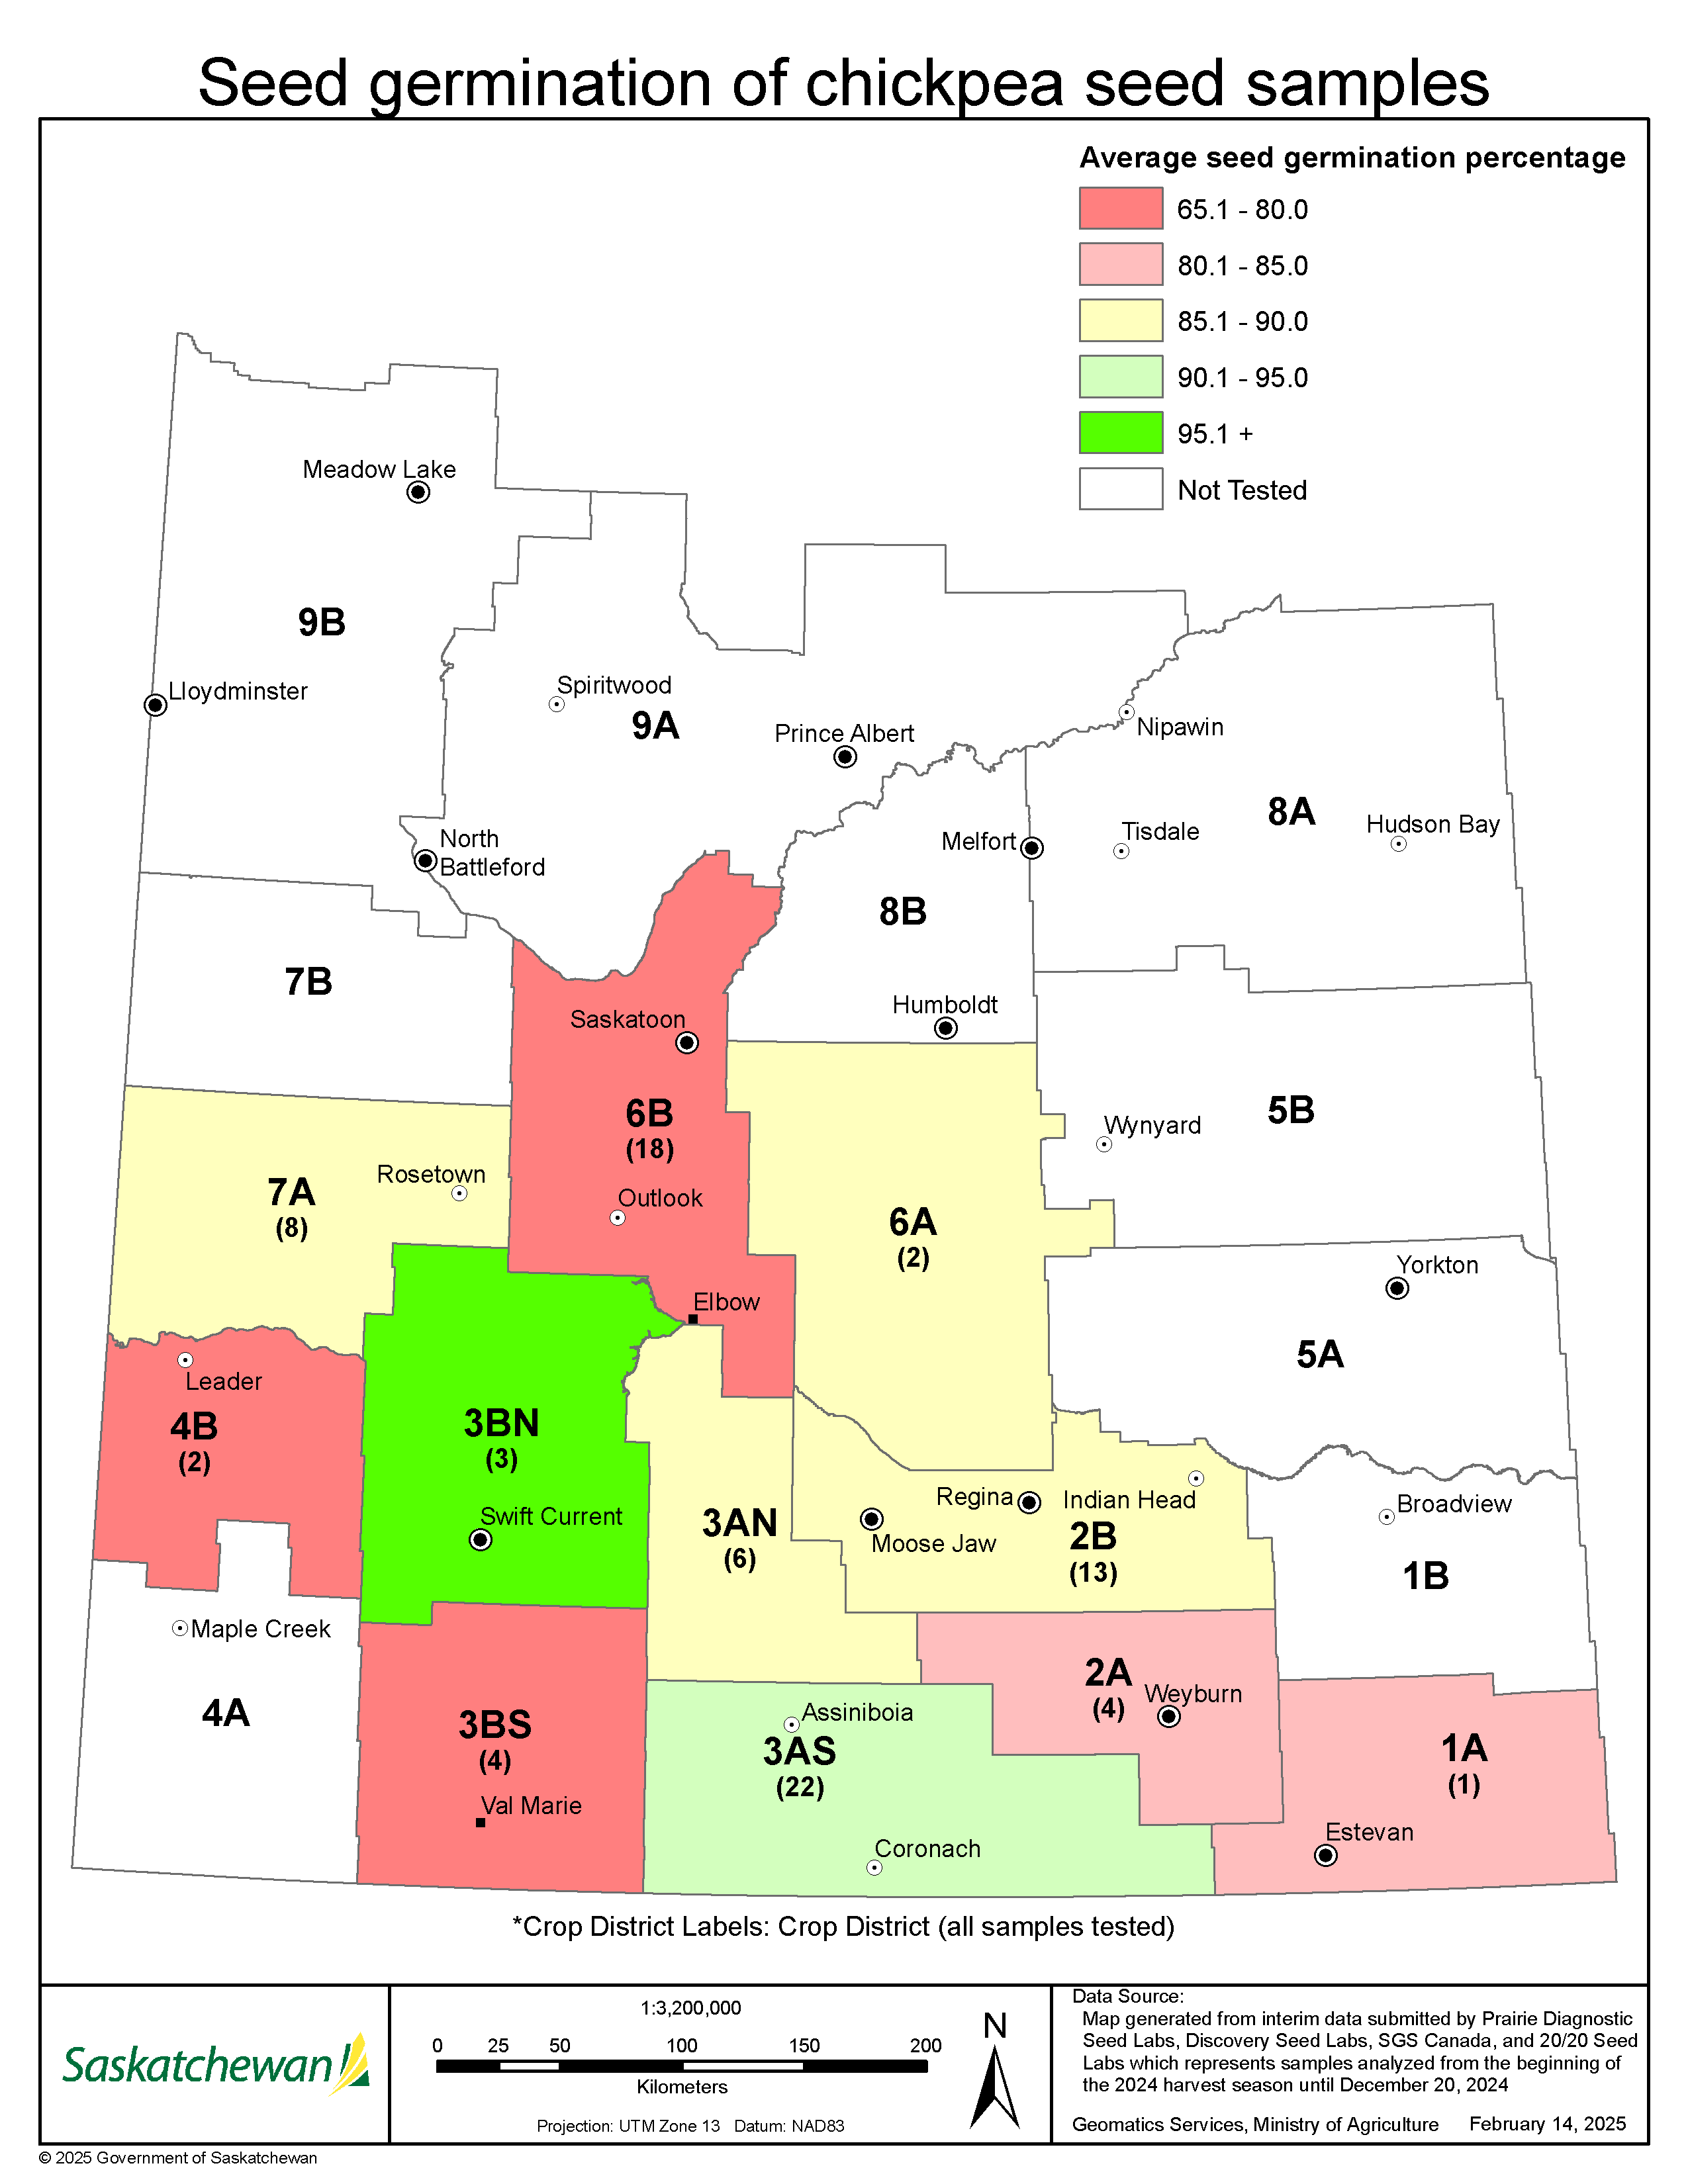
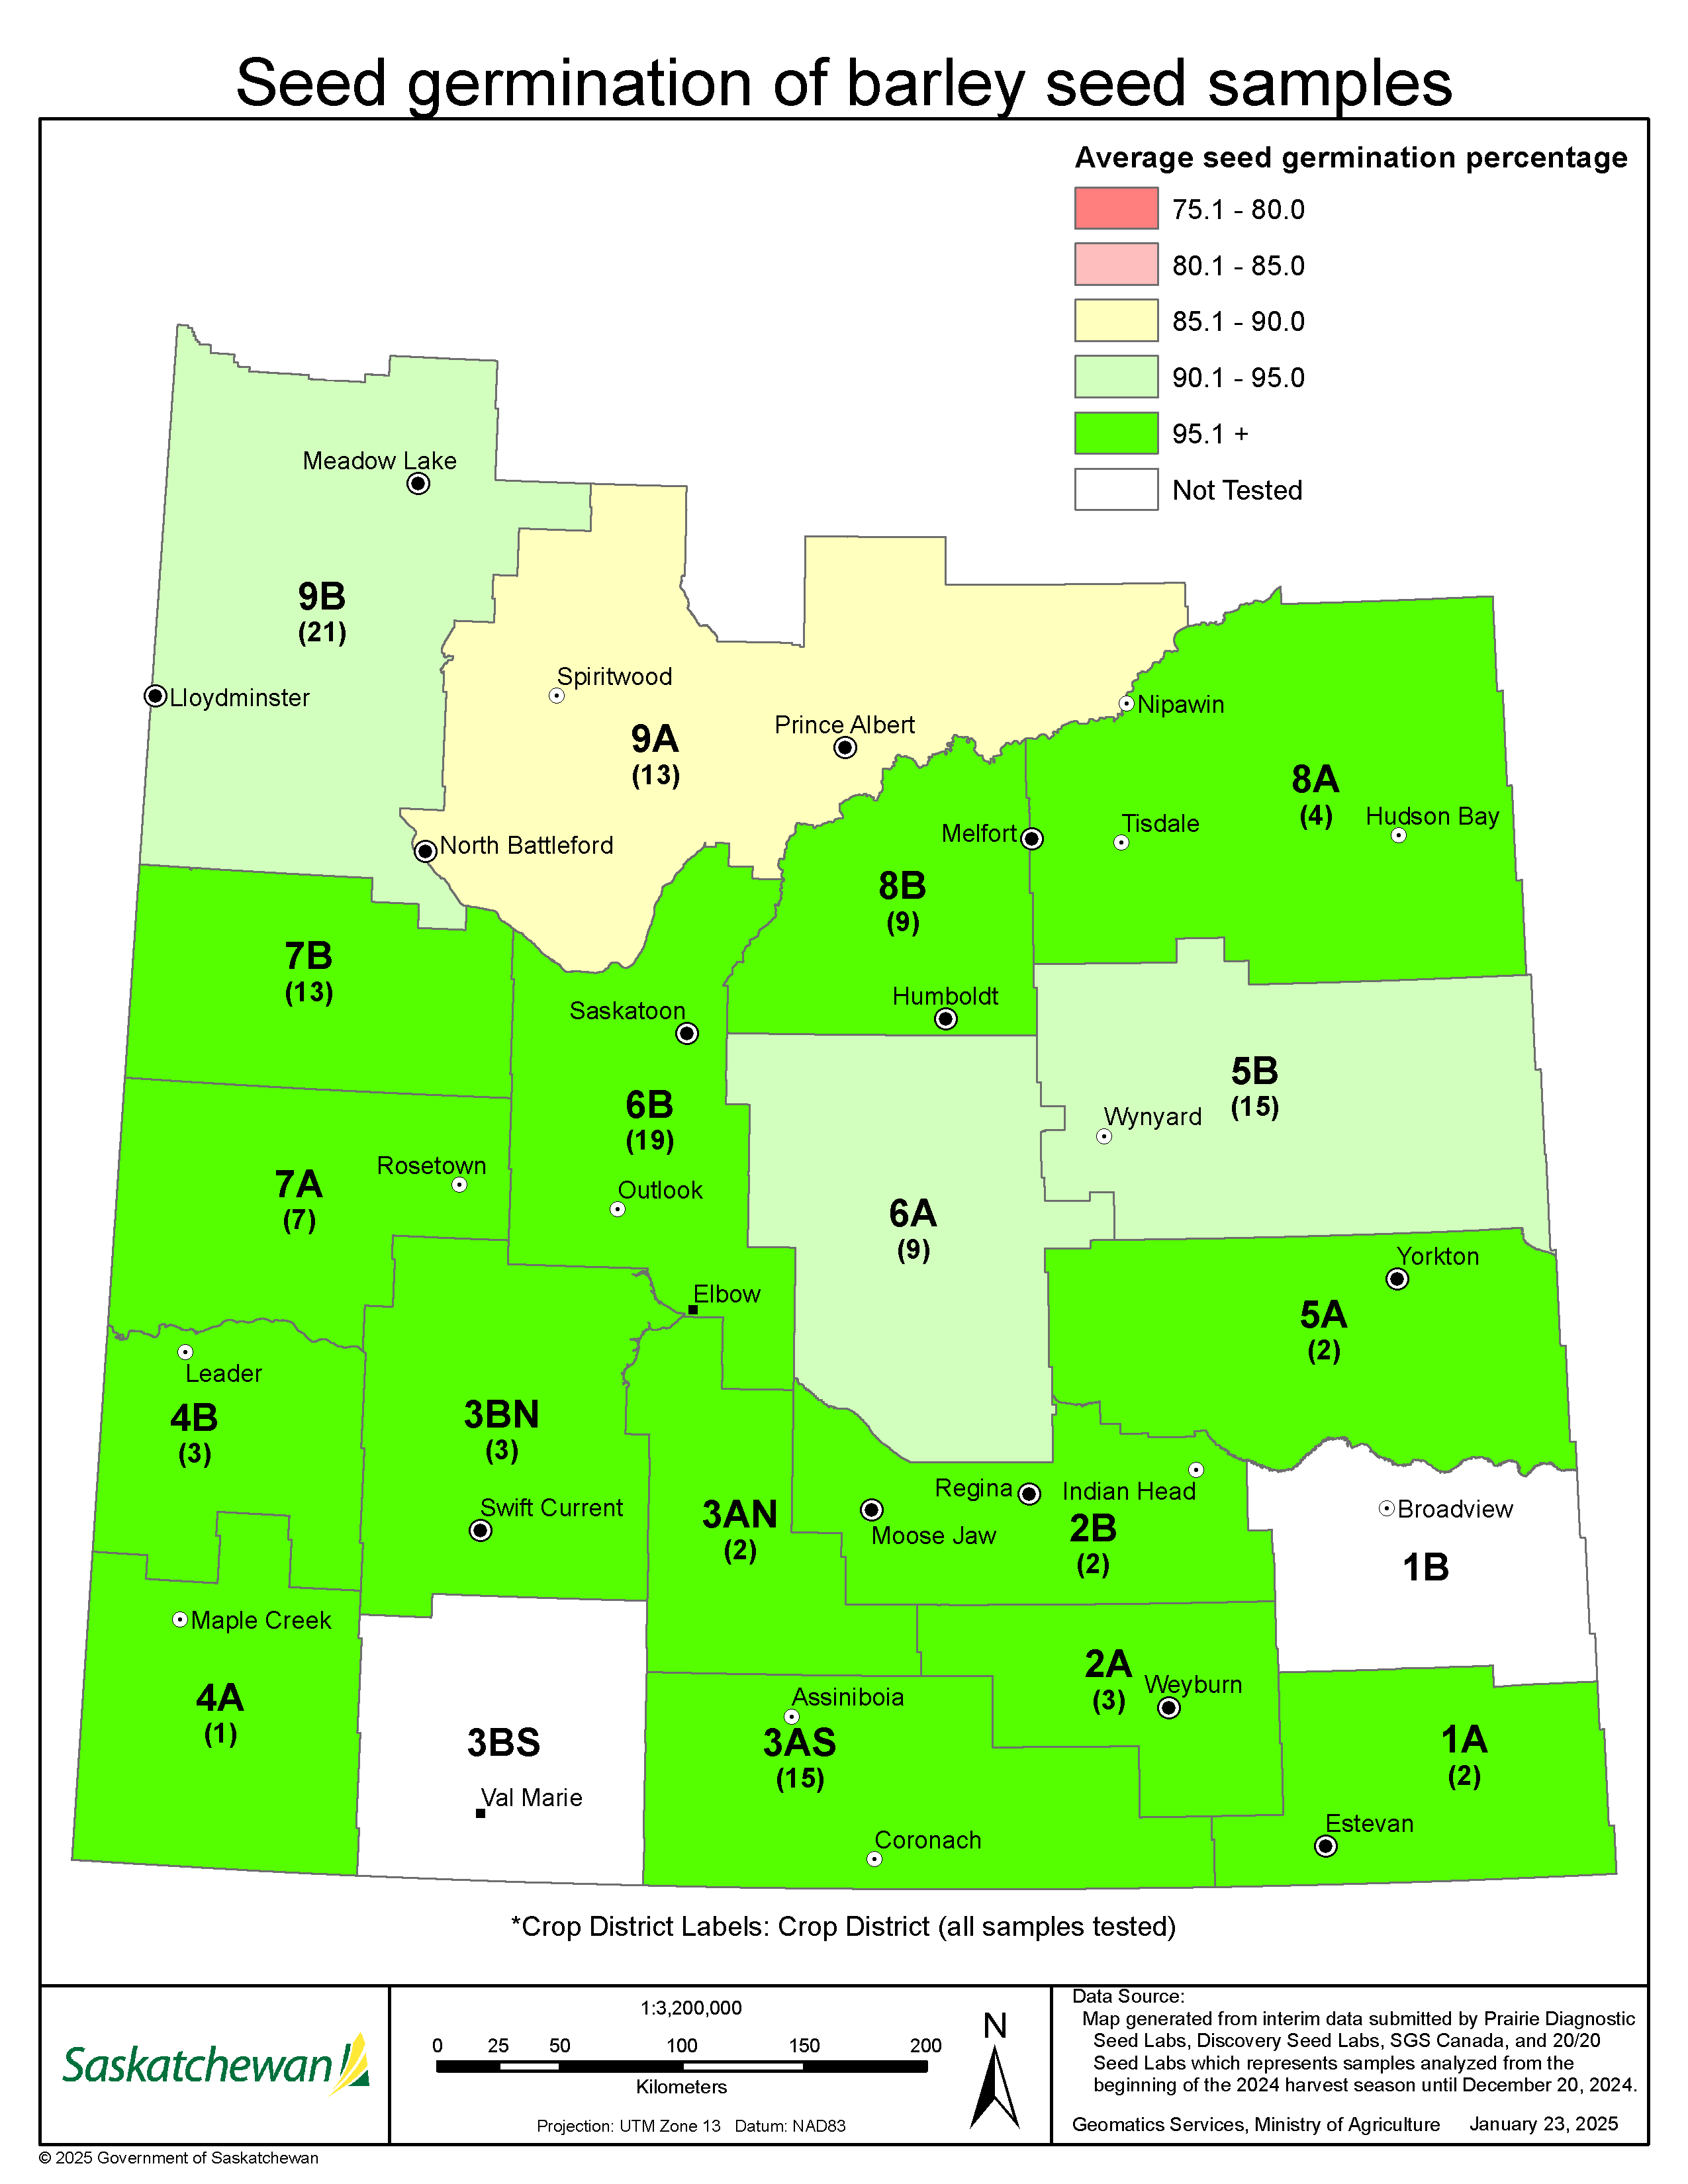
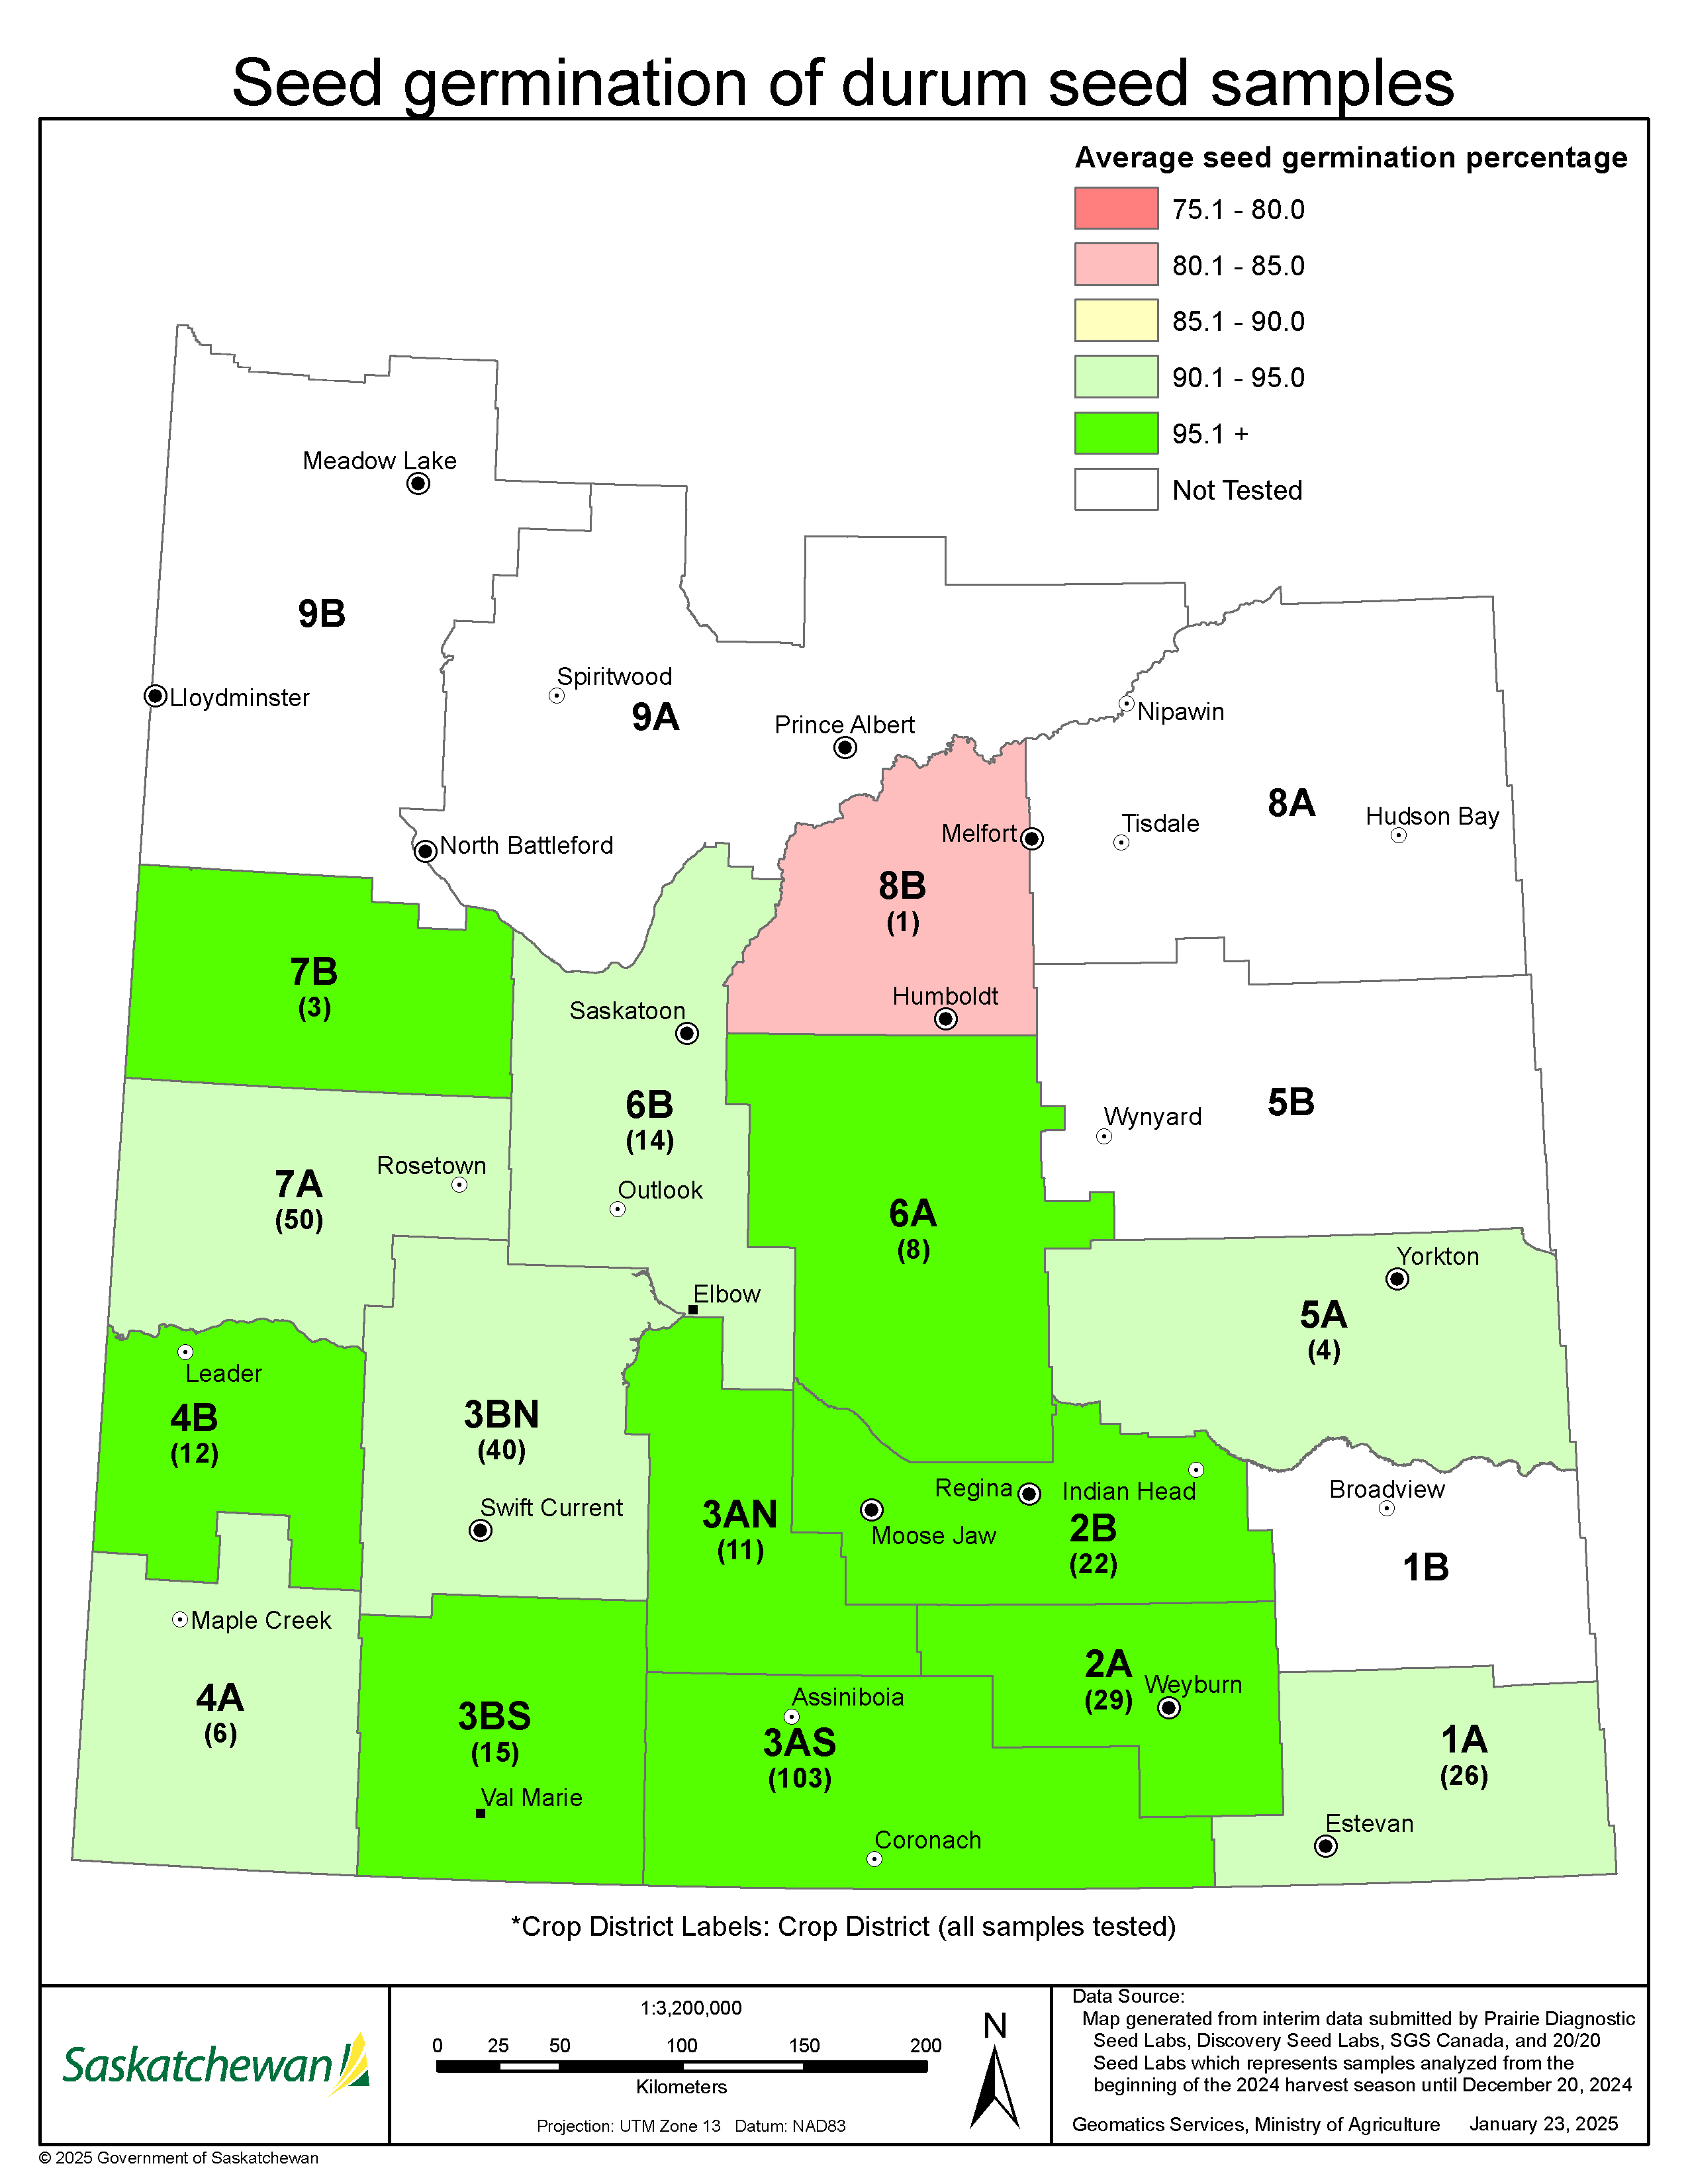
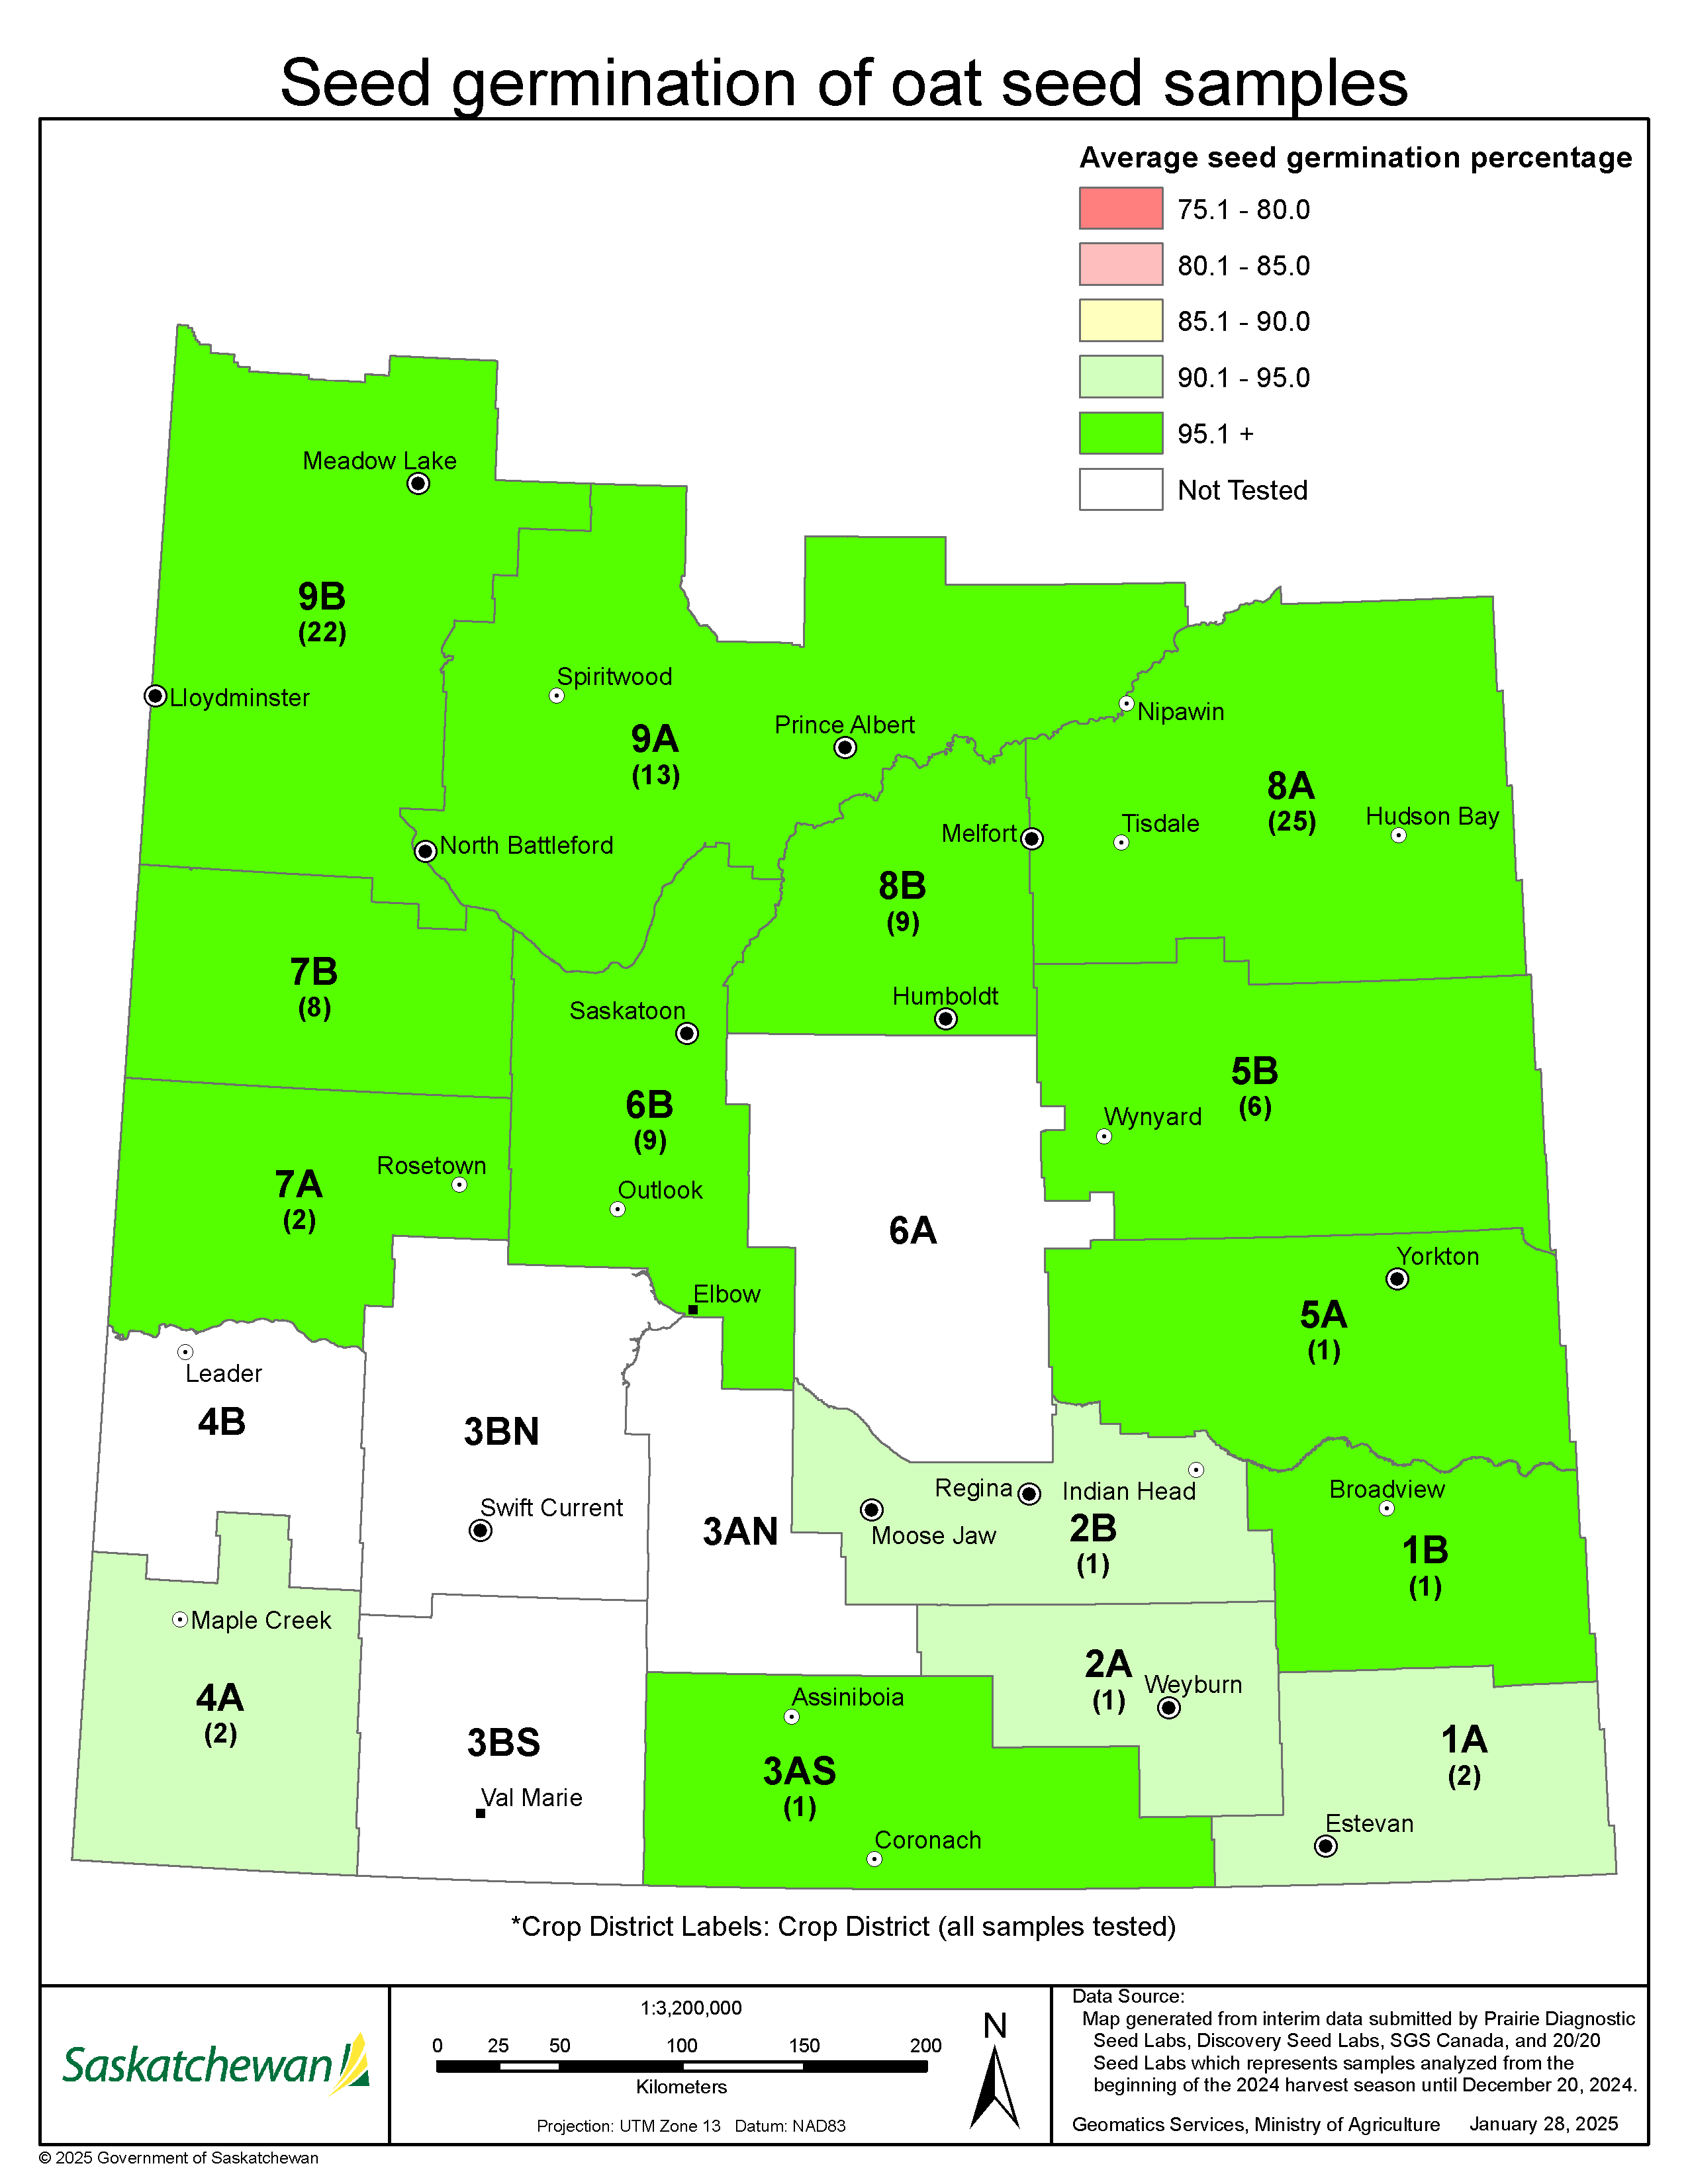
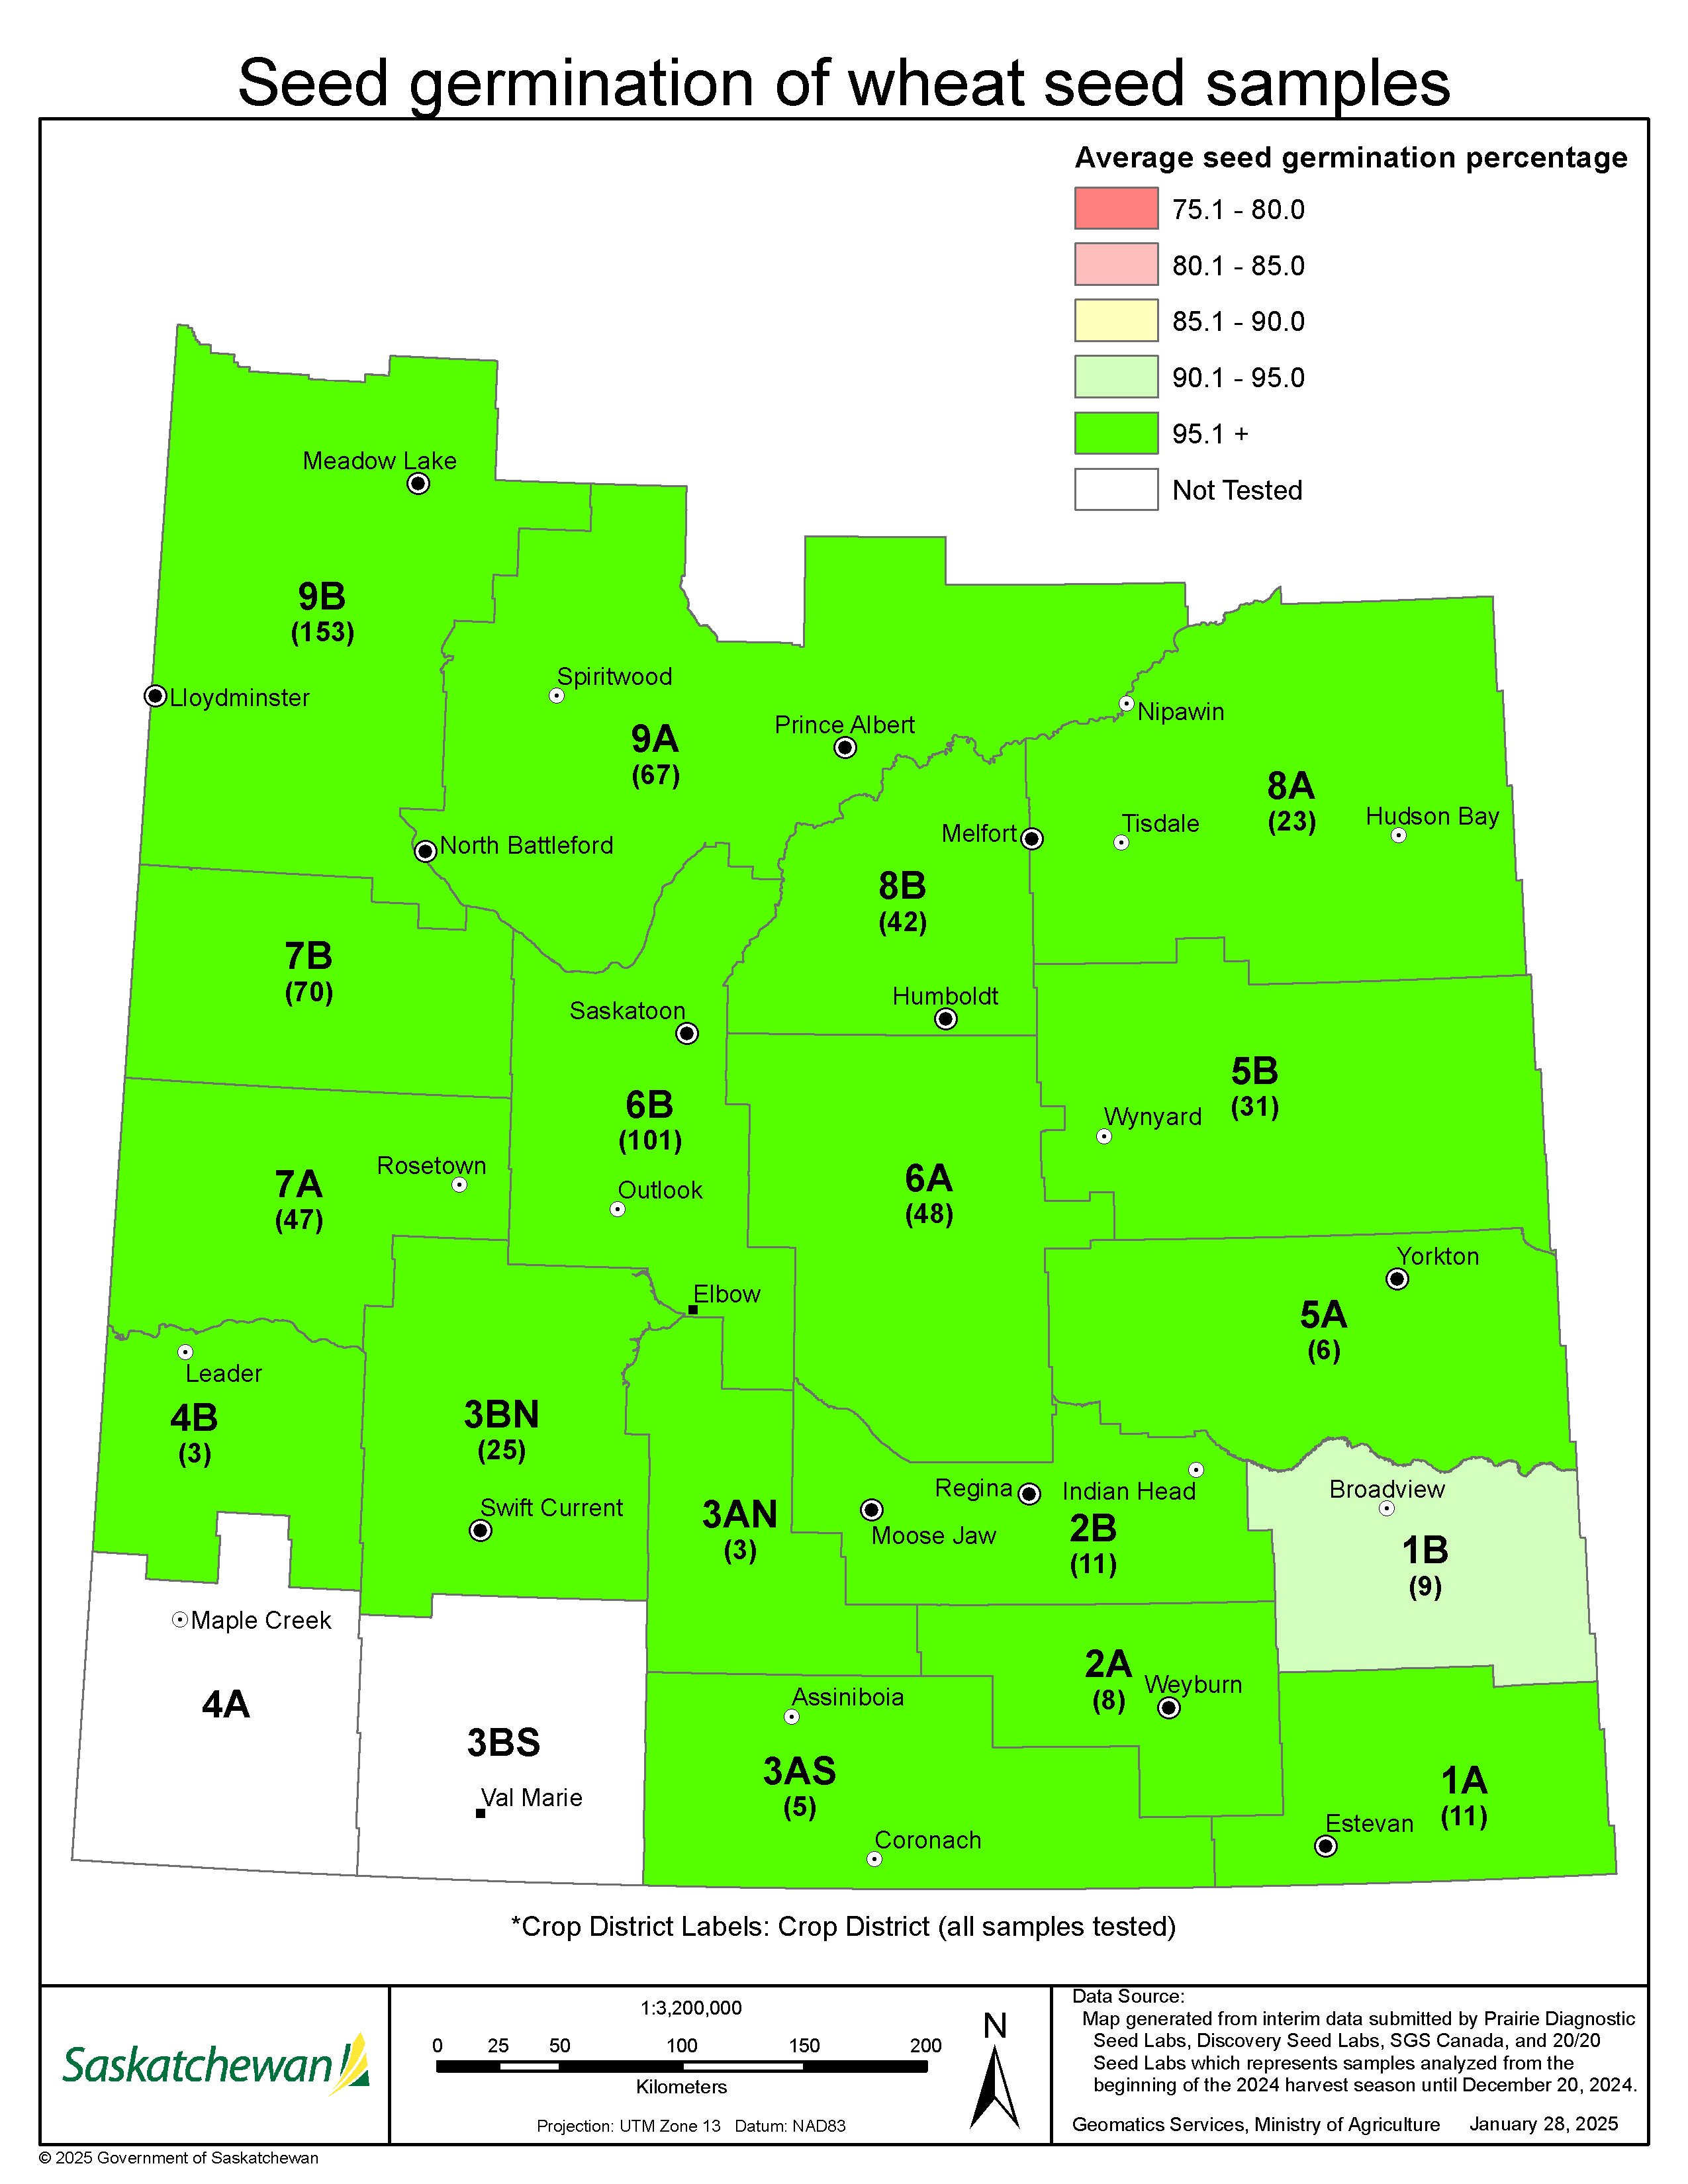
Per cent germination levels were documented during the 2024 provincial seed survey with interim results showing similar results to 2023, with wheat and oats slightly increasing and chickpeas decreasing. High numbers of seed lots harvested in 2021, particularly field pea, were reported to have below acceptable levels of germination and steady increases in germination of seed lots harvested from 2022 to 2024 have been seen. Mean germination of all crop types tested was 94.9%.
Although germination levels look quite favourable across all provincial crop districts and most crop types, testing of individual seed lots is still recommended prior to seeding in the spring of 2025.
Table 1. Average per cent germination of Saskatchewan pulse and cereal seed samples analyzed by commercial labs as of December 20, 2024.
| Type | Crop | Number of Samples | Mean Germination 2024 (%) | Mean Germination 2023 (%) |
| Pulses | Lentils | 379 | 95.8 | 96.1 |
| Peas | 298 | 91.9 | 91.0 | |
| Chickpeas | 83 | 85.6 | 92.6 | |
| Cereals | Barley | 143 | 95.1 | 96.0 |
| Durum | 344 | 95.2 | 93.9 | |
| Oats | 103 | 97.1 | 95.0 | |
| Wheat | 663 | 96.4 | 93.4 |
Source: Saskatchewan Ministry of Agriculture
Source: Saskatchewan Ministry of Agriculture
Source: Saskatchewan Ministry of Agriculture
Source: Saskatchewan Ministry of Agriculture
Source: Saskatchewan Ministry of Agriculture
Source: Saskatchewan Ministry of Agriculture
Source: Saskatchewan Ministry of Agriculture
Pulse Pathogen Results
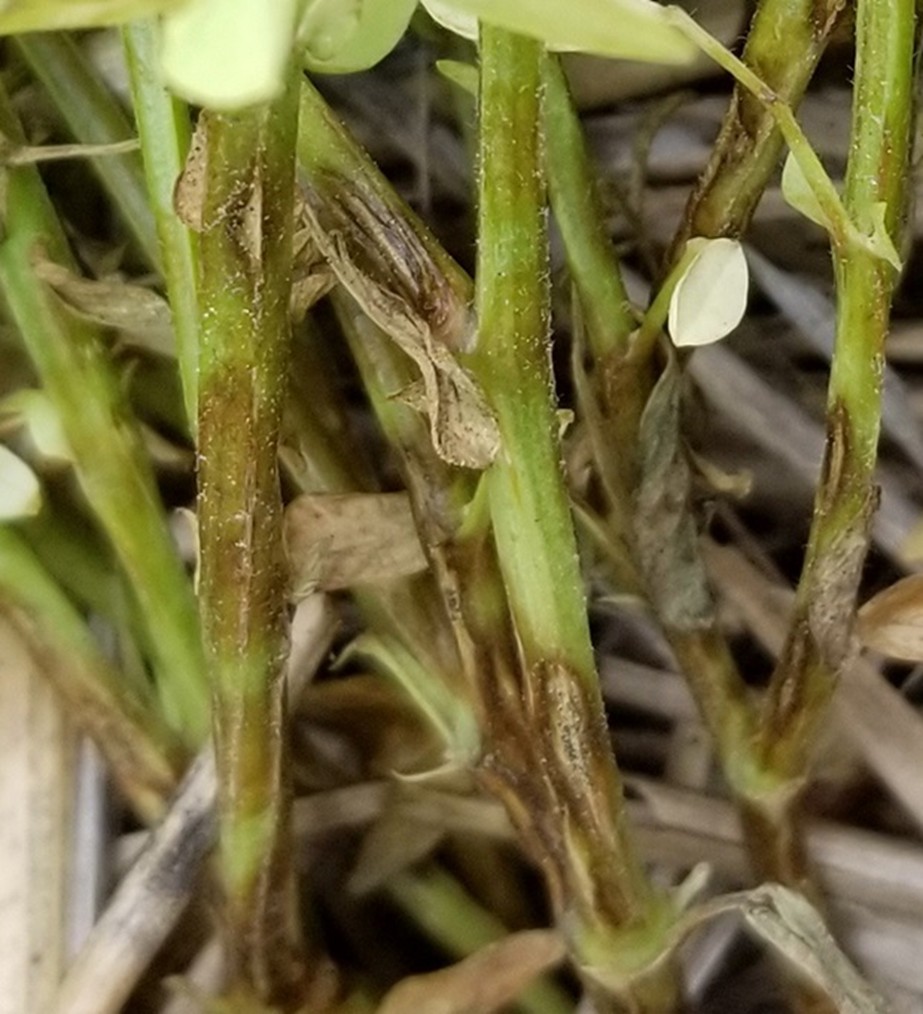
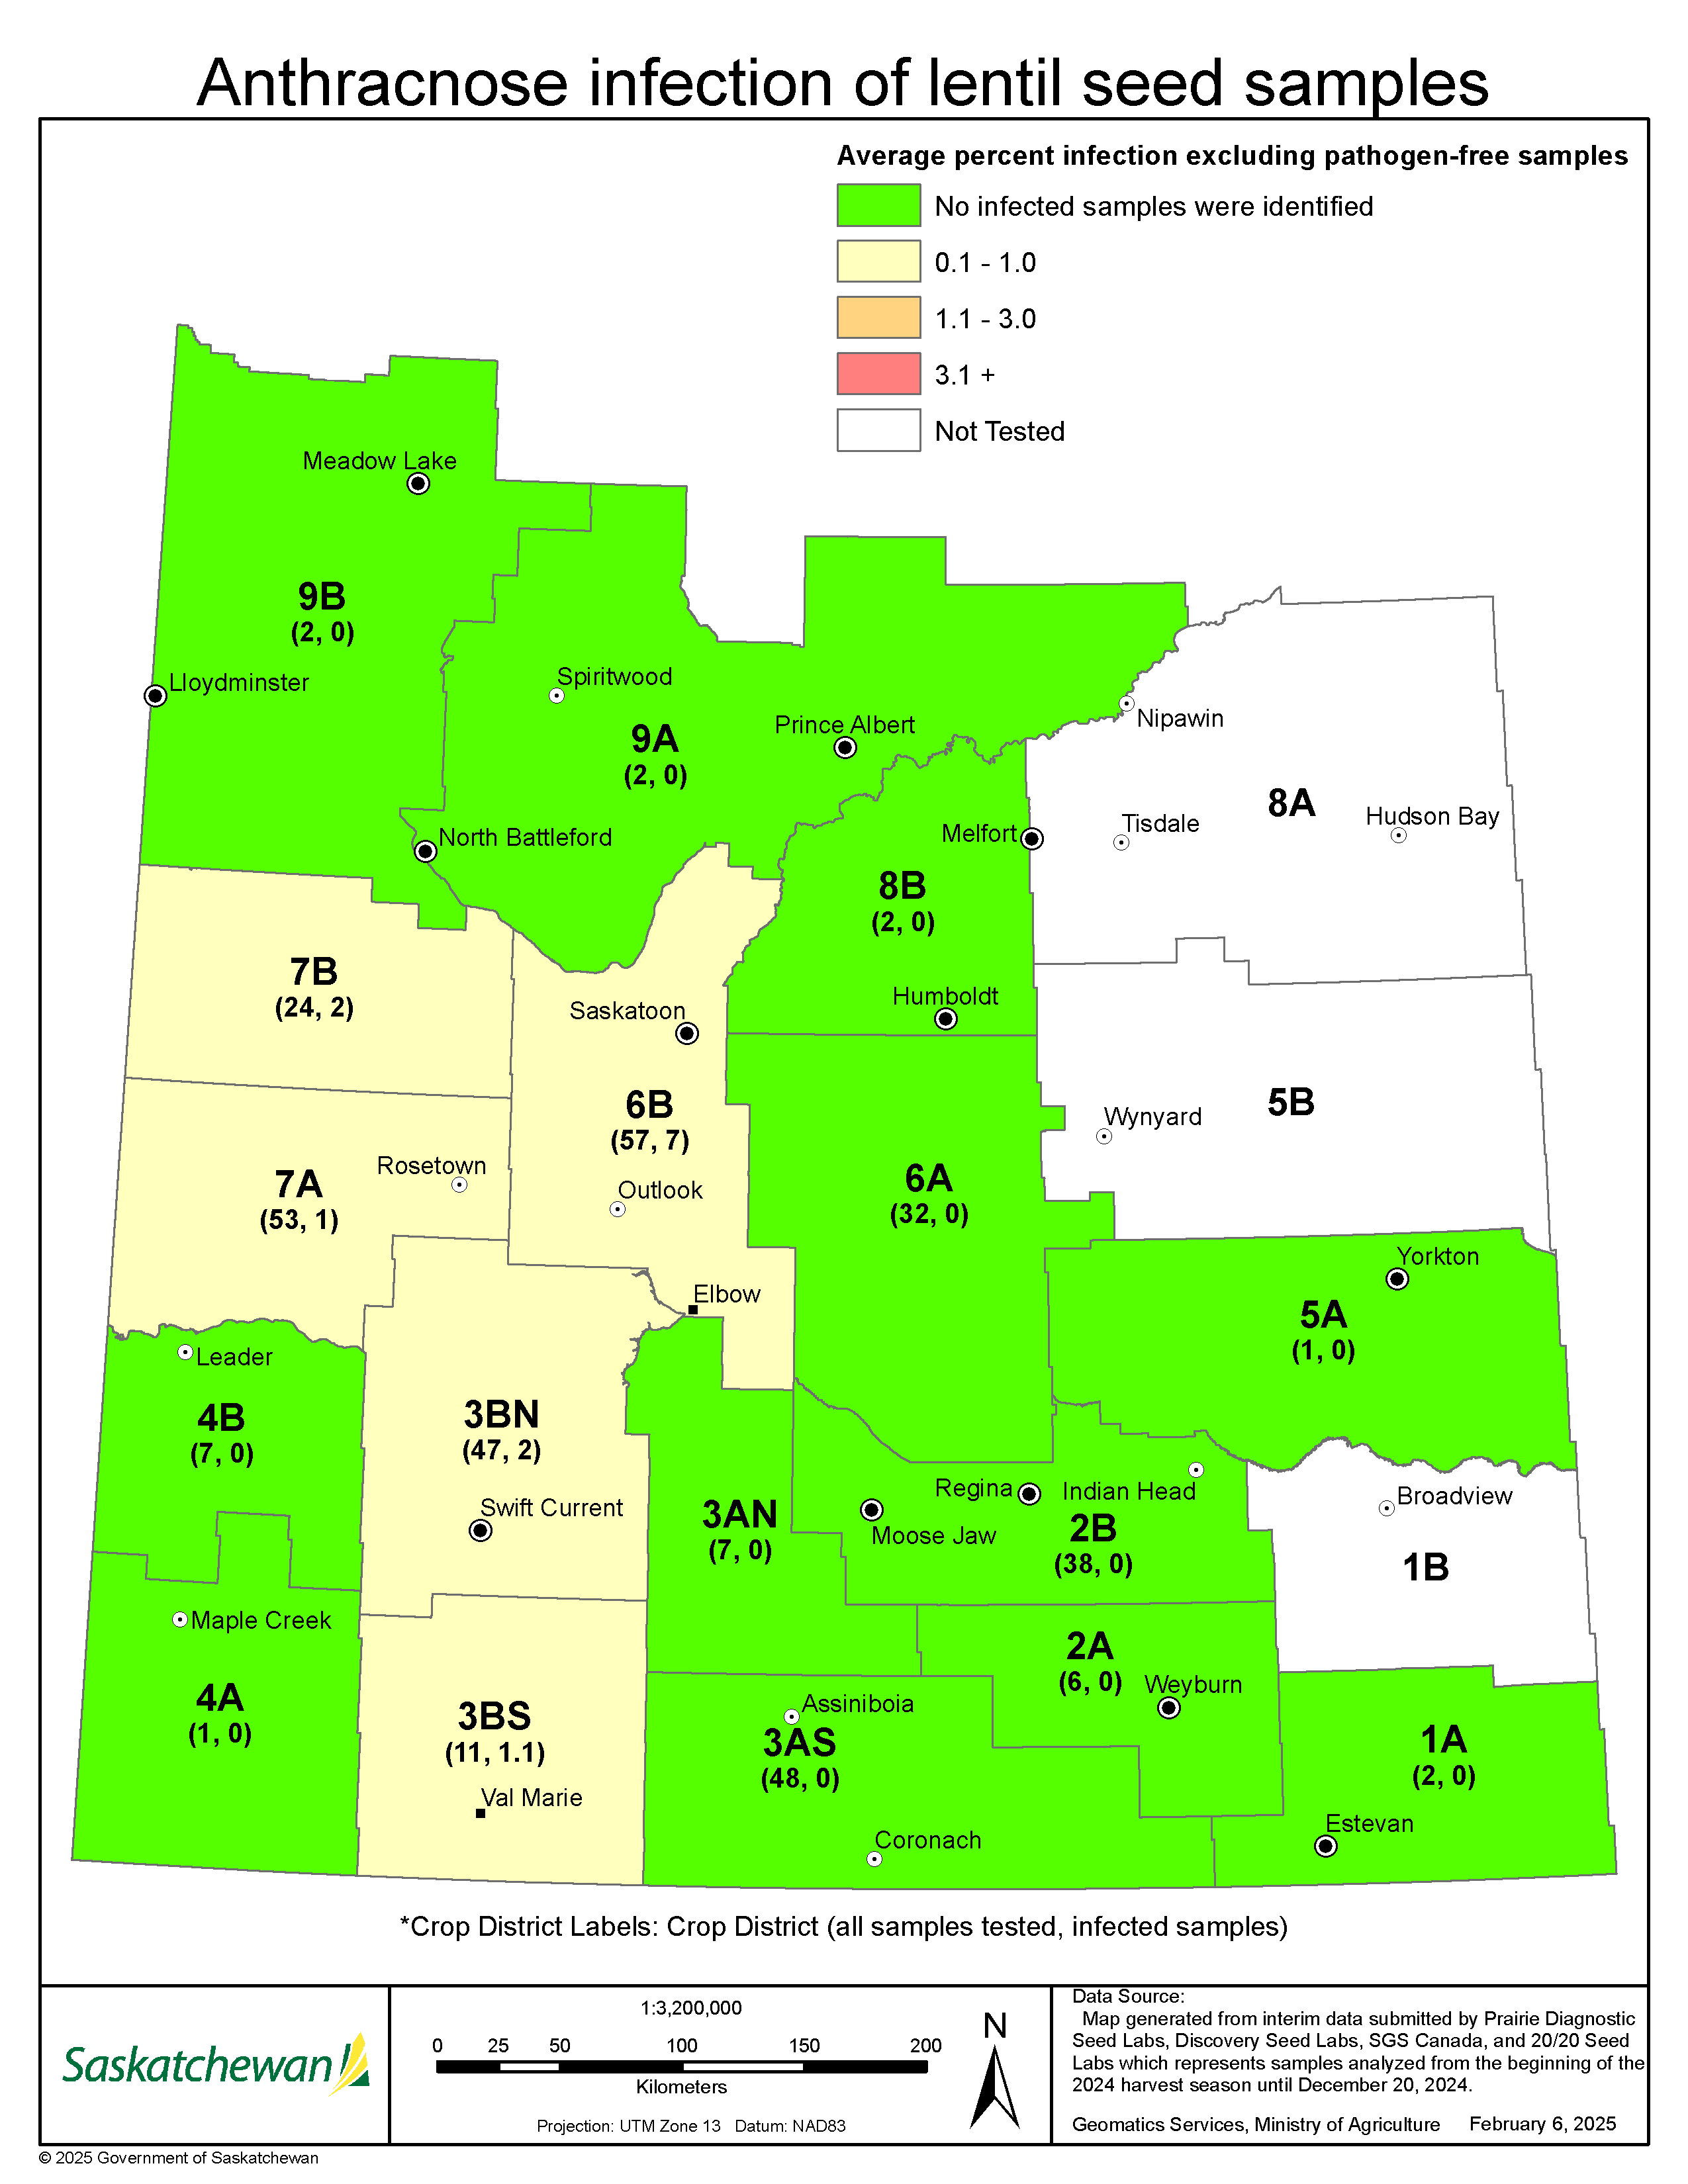
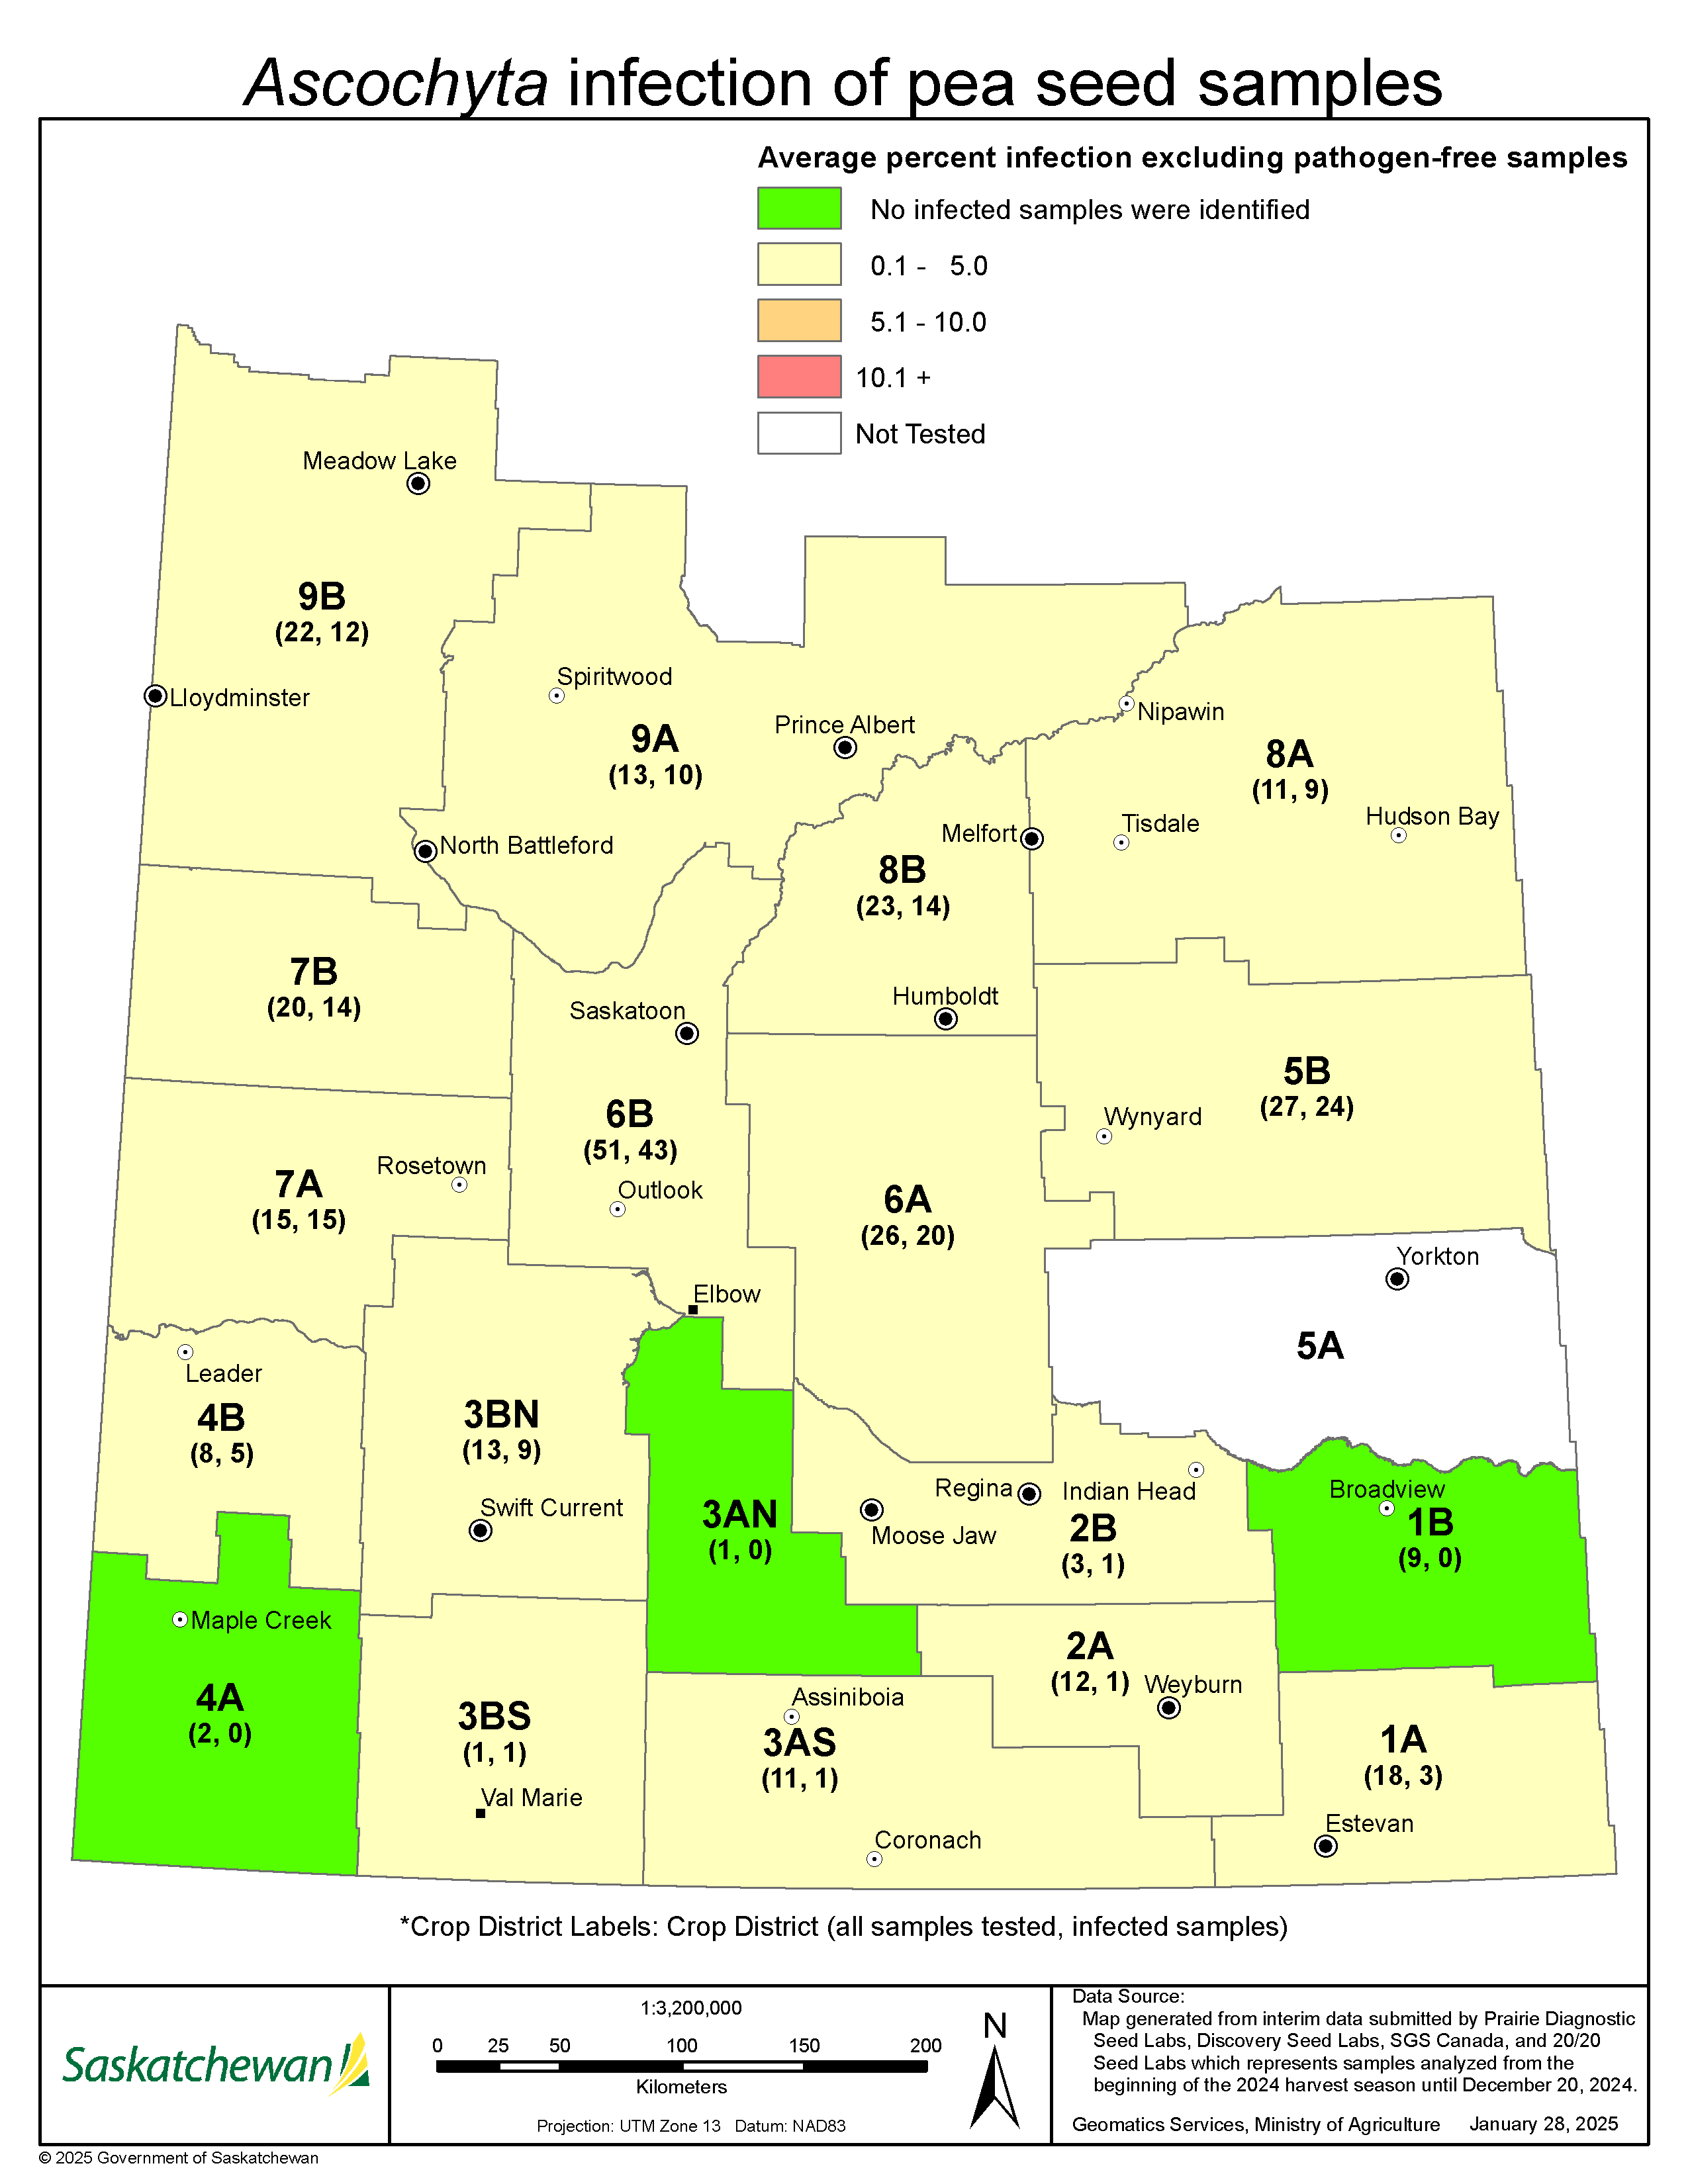
The interim results of commercial plate tests for seed-borne pathogens of lentil, field pea, and chickpea samples reveal a relatively high number of pathogen-free seed samples from across the province with some exceptions from Ascochyta on pea and chickpea. Results to-date suggest similar mean infection levels to 2023 and a strong overall decrease in mean infection levels compared to results from 2022.
- Greater than 96% of lentil samples were free of seed-borne pathogens; samples that did have detectable levels of Ascochyta, Anthracnose, Sclerotinia, or Botrytis had a mean infection level that did not exceed 0.7%.
- Seed-borne Anthracnose levels in lentils increased in 2024 by 1.8% and mean infection increased by 0.6% from 2023 levels.
- Seed-borne Botrytis was detected on 4% of lentil and 8.3% of field pea samples.
- Seed-borne Ascochyta was detected on 63.6% of field pea samples but mean infection levels (1.8%) were well below critical threshold levels.
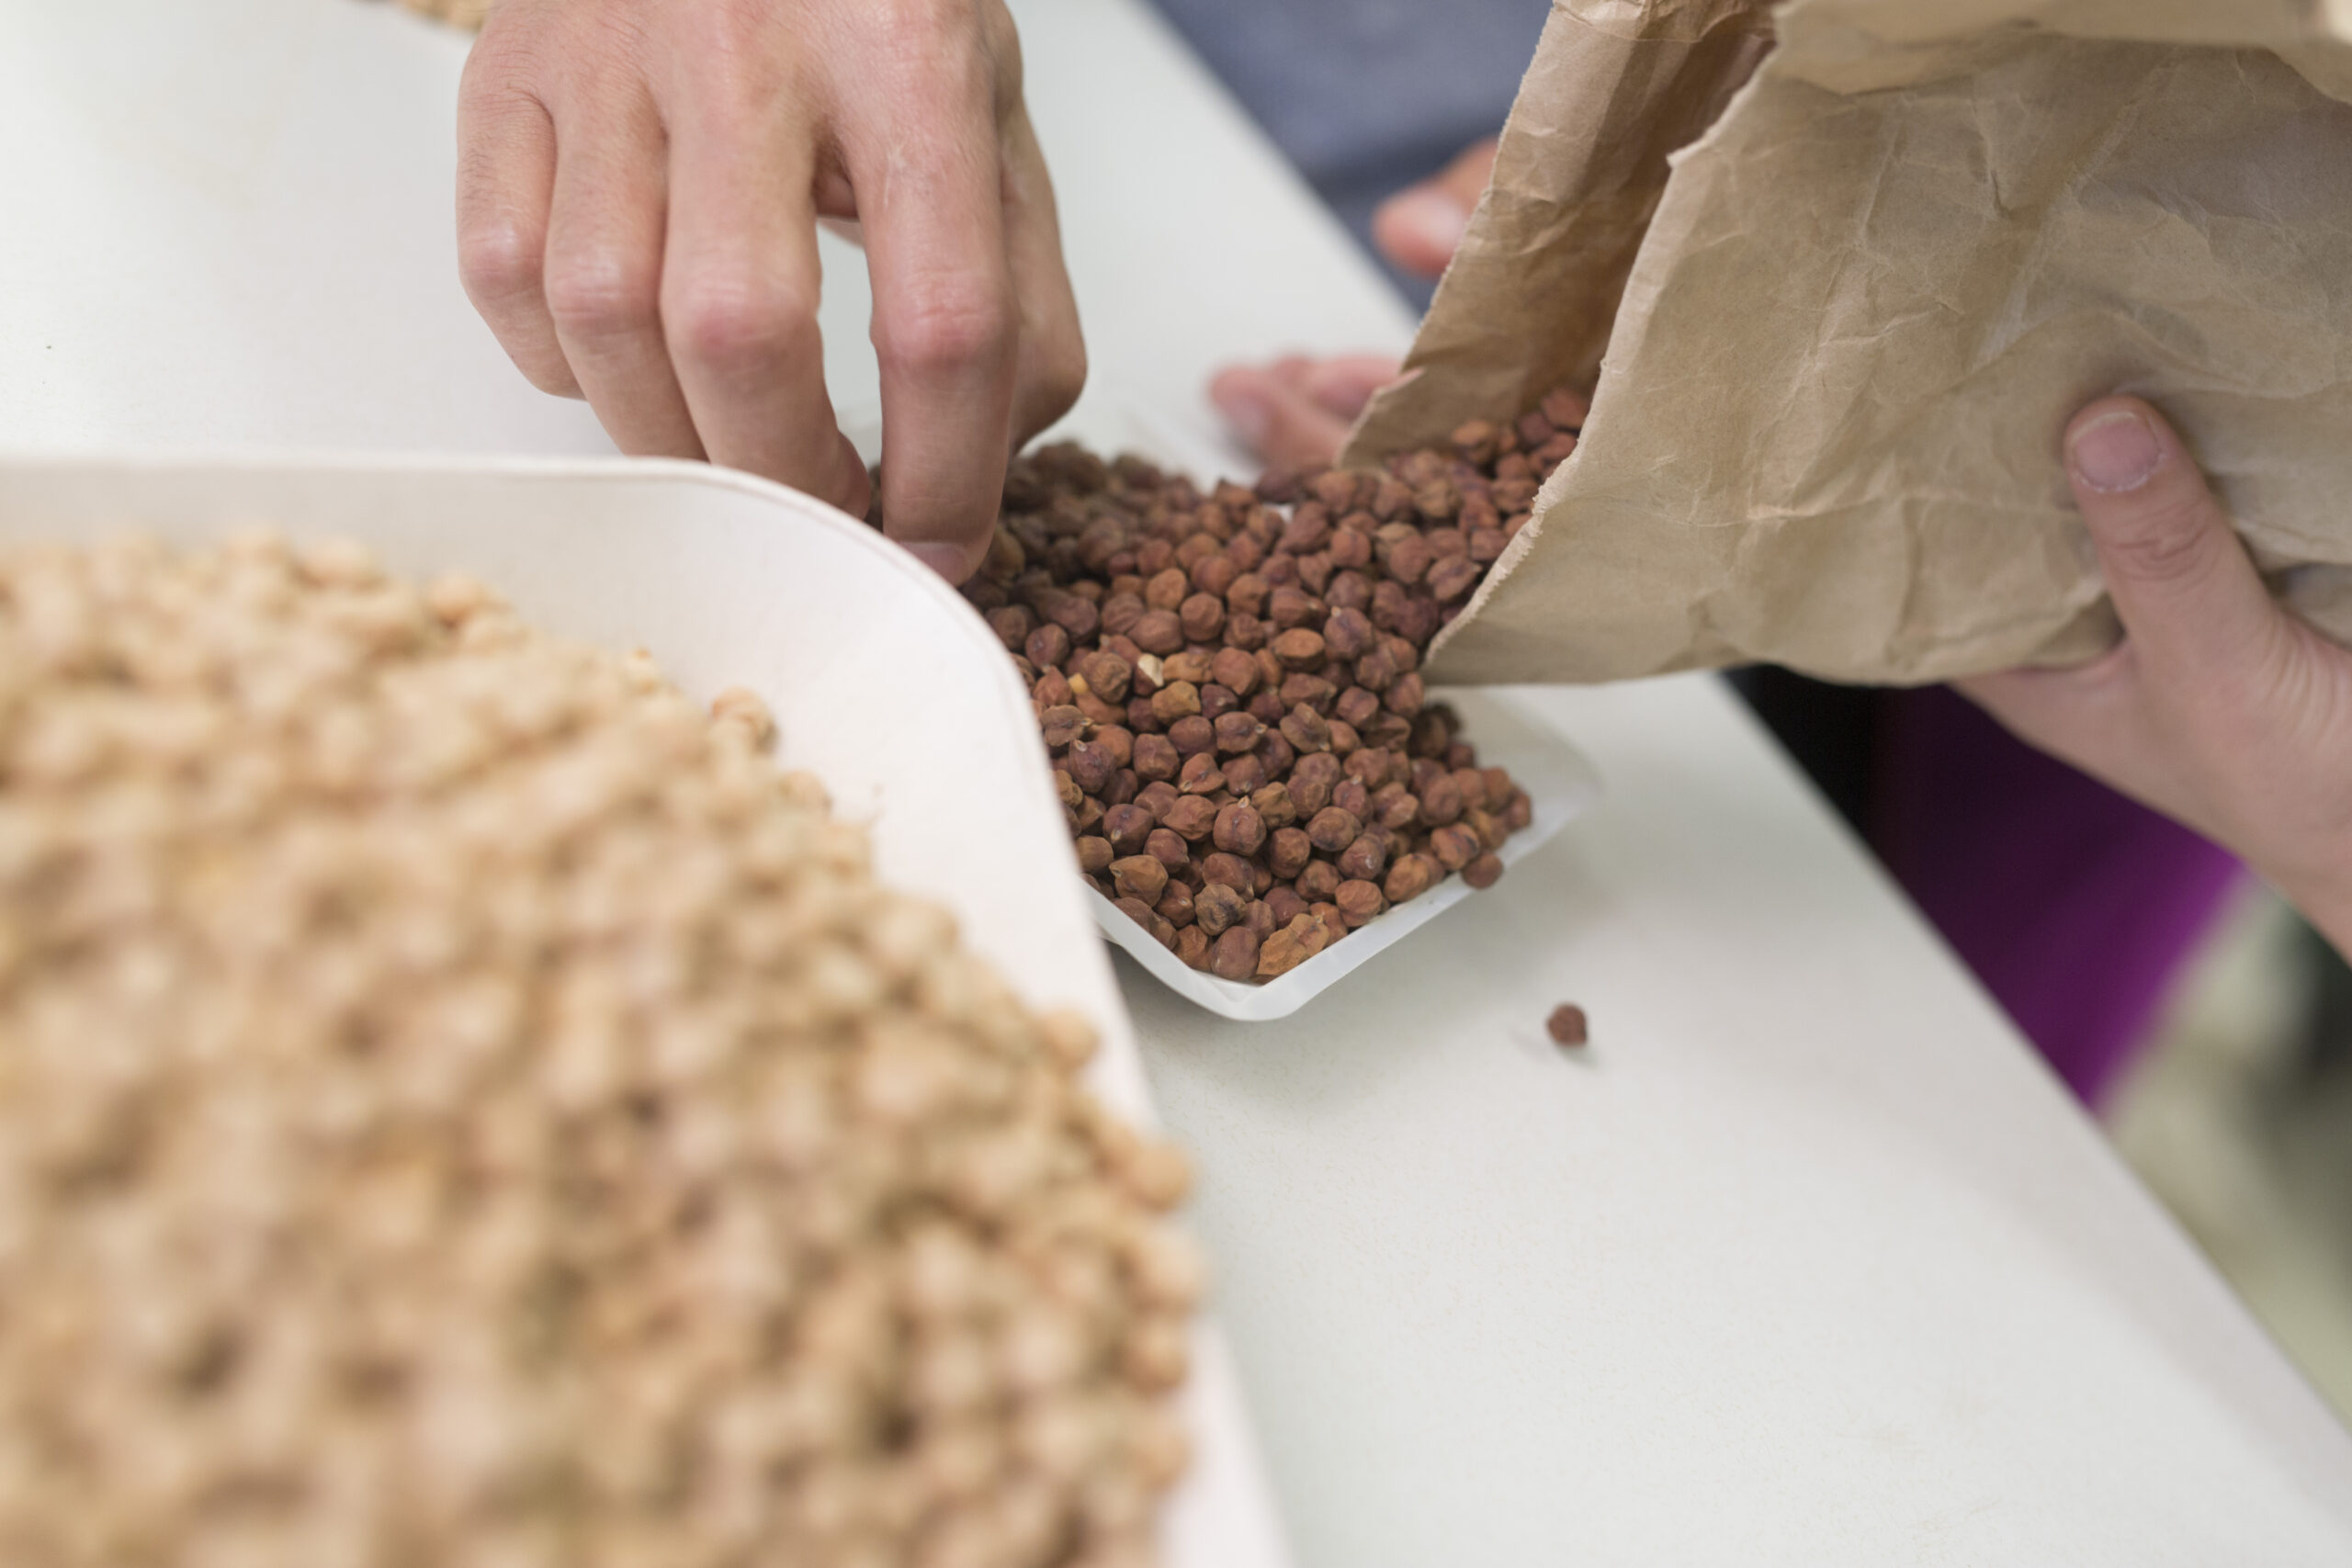
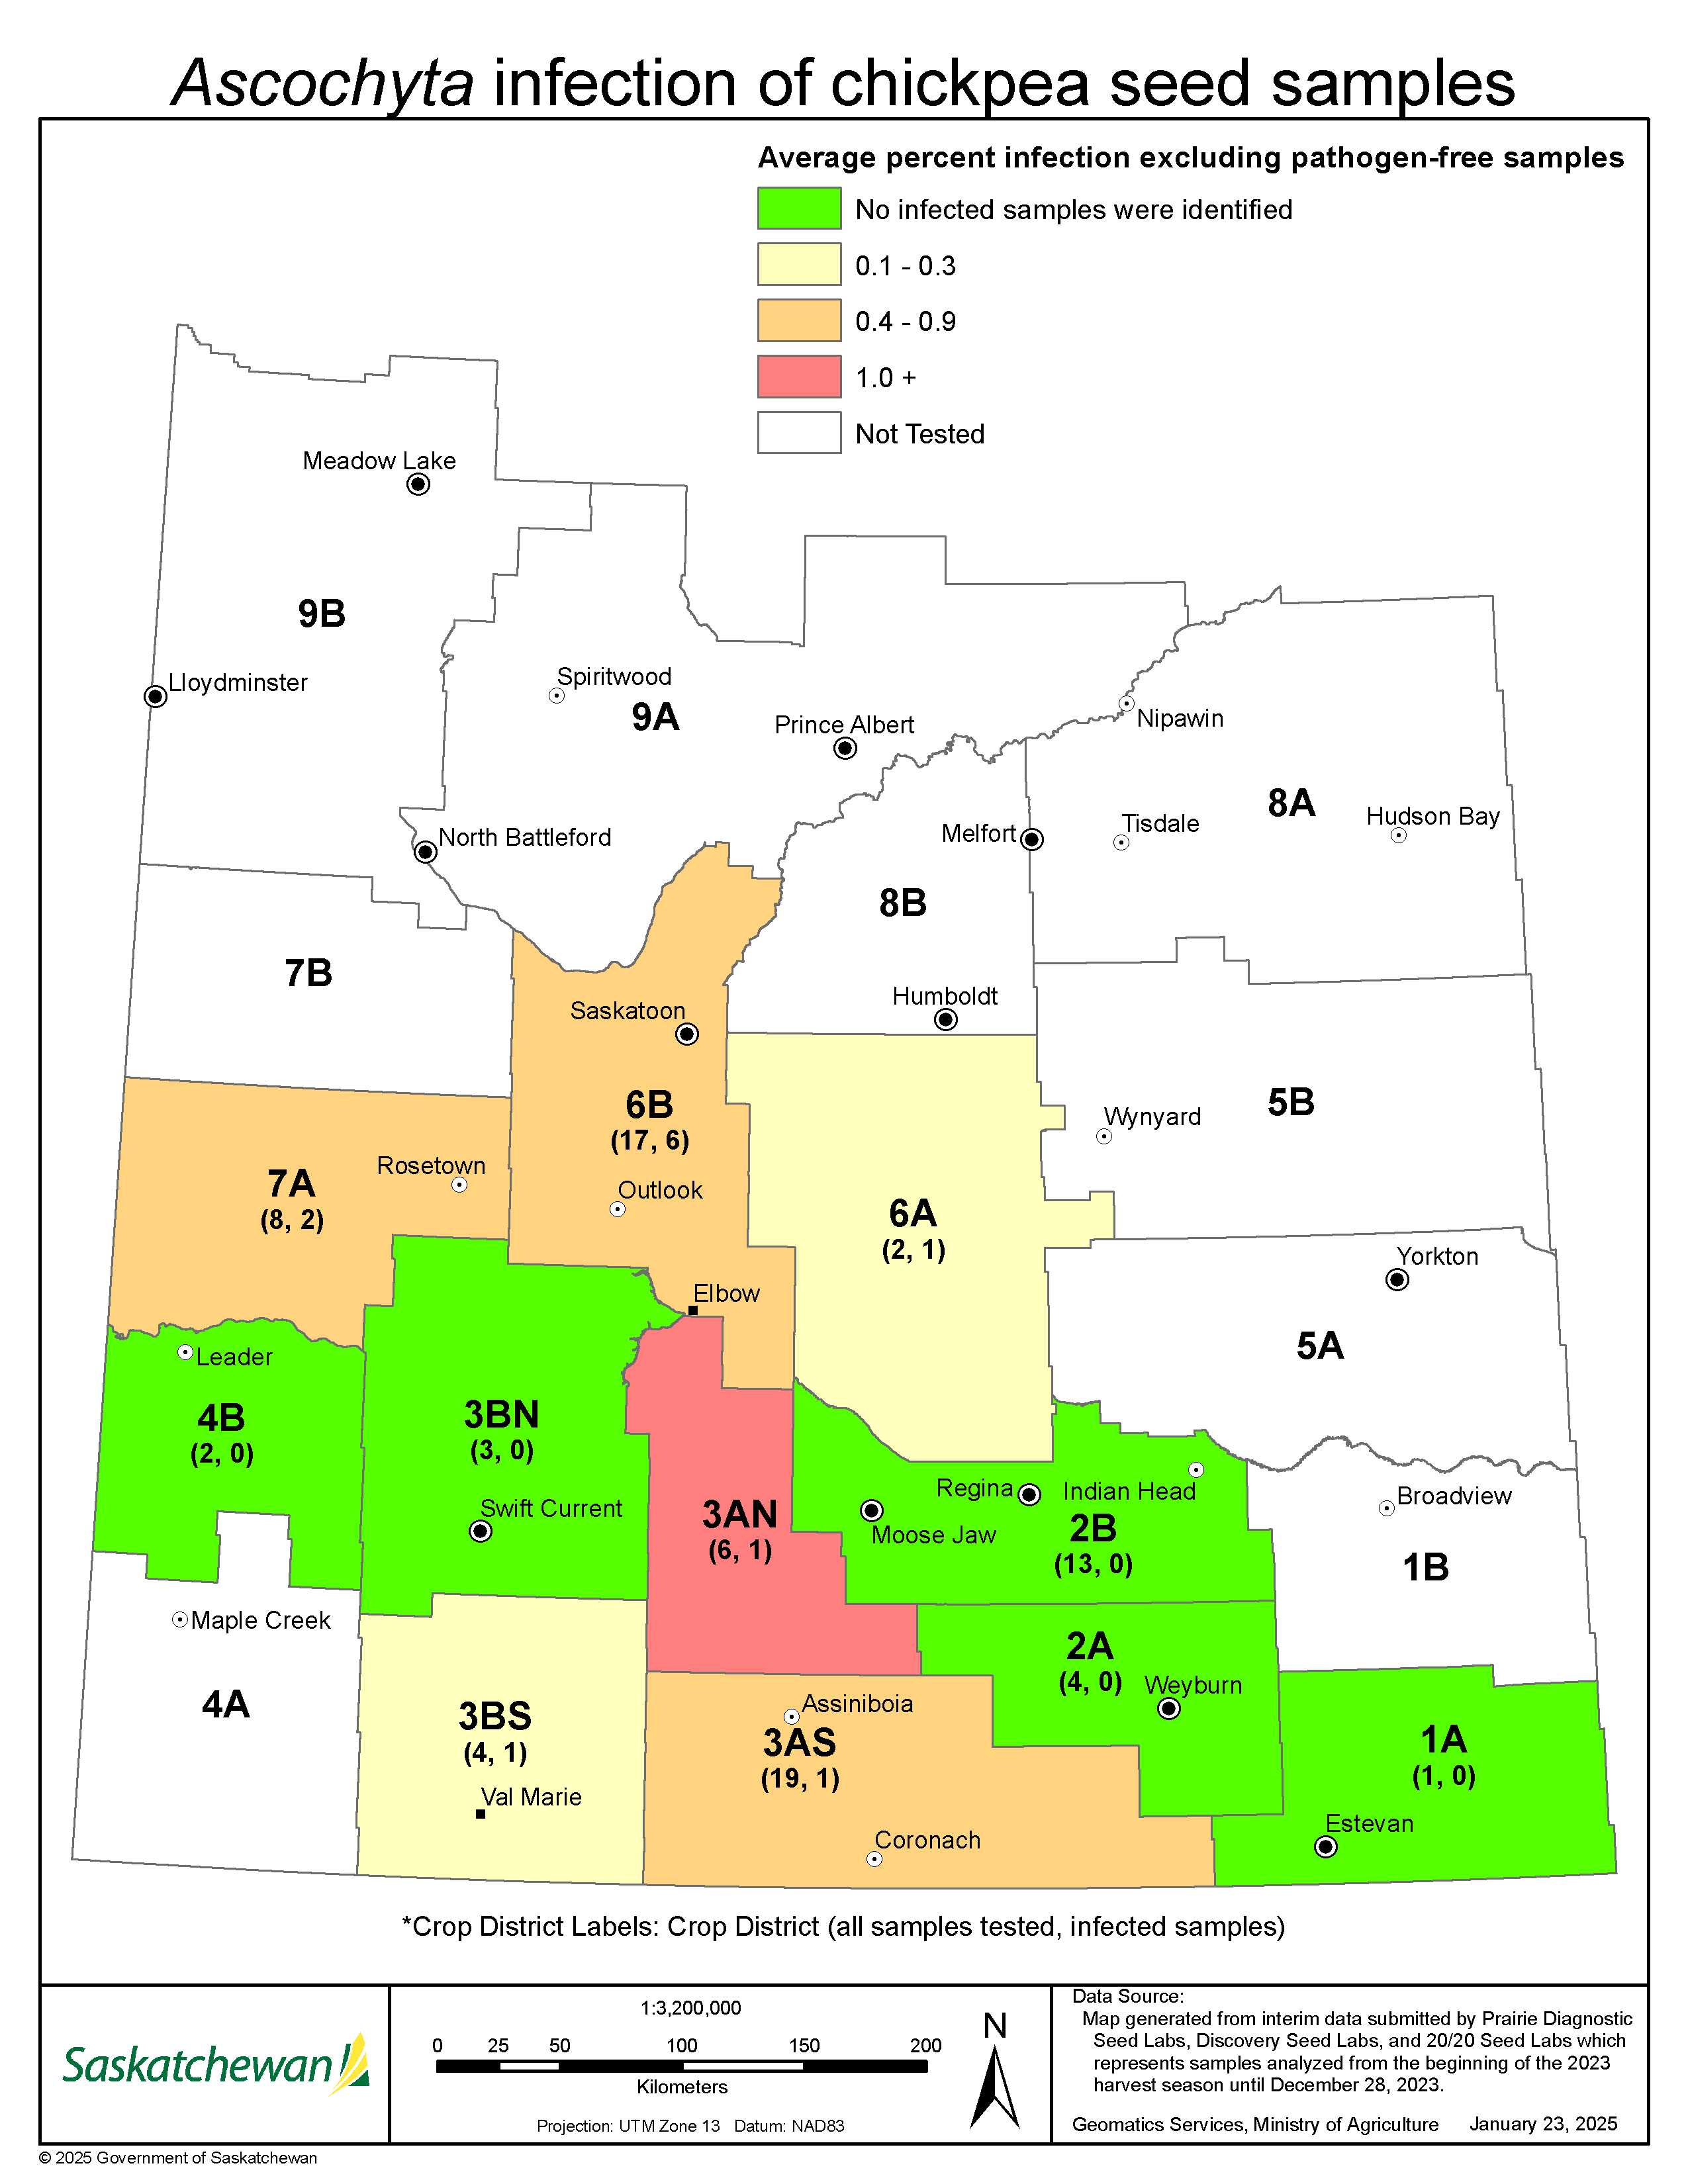
- 15.2% of chickpea samples had detectable levels of seed-borne Ascochyta in 2024, a slight increase from 2023 levels (12.7%). The mean infection level was the same as 2023 at 0.3%, which is the critical threshold for seed-borne chickpea Ascochyta.
- Seed-borne chickpea Sclerotinia and Botrytis were detected at 1.4% and 6.8%, respectively. Both detections were located in crop district 6B.
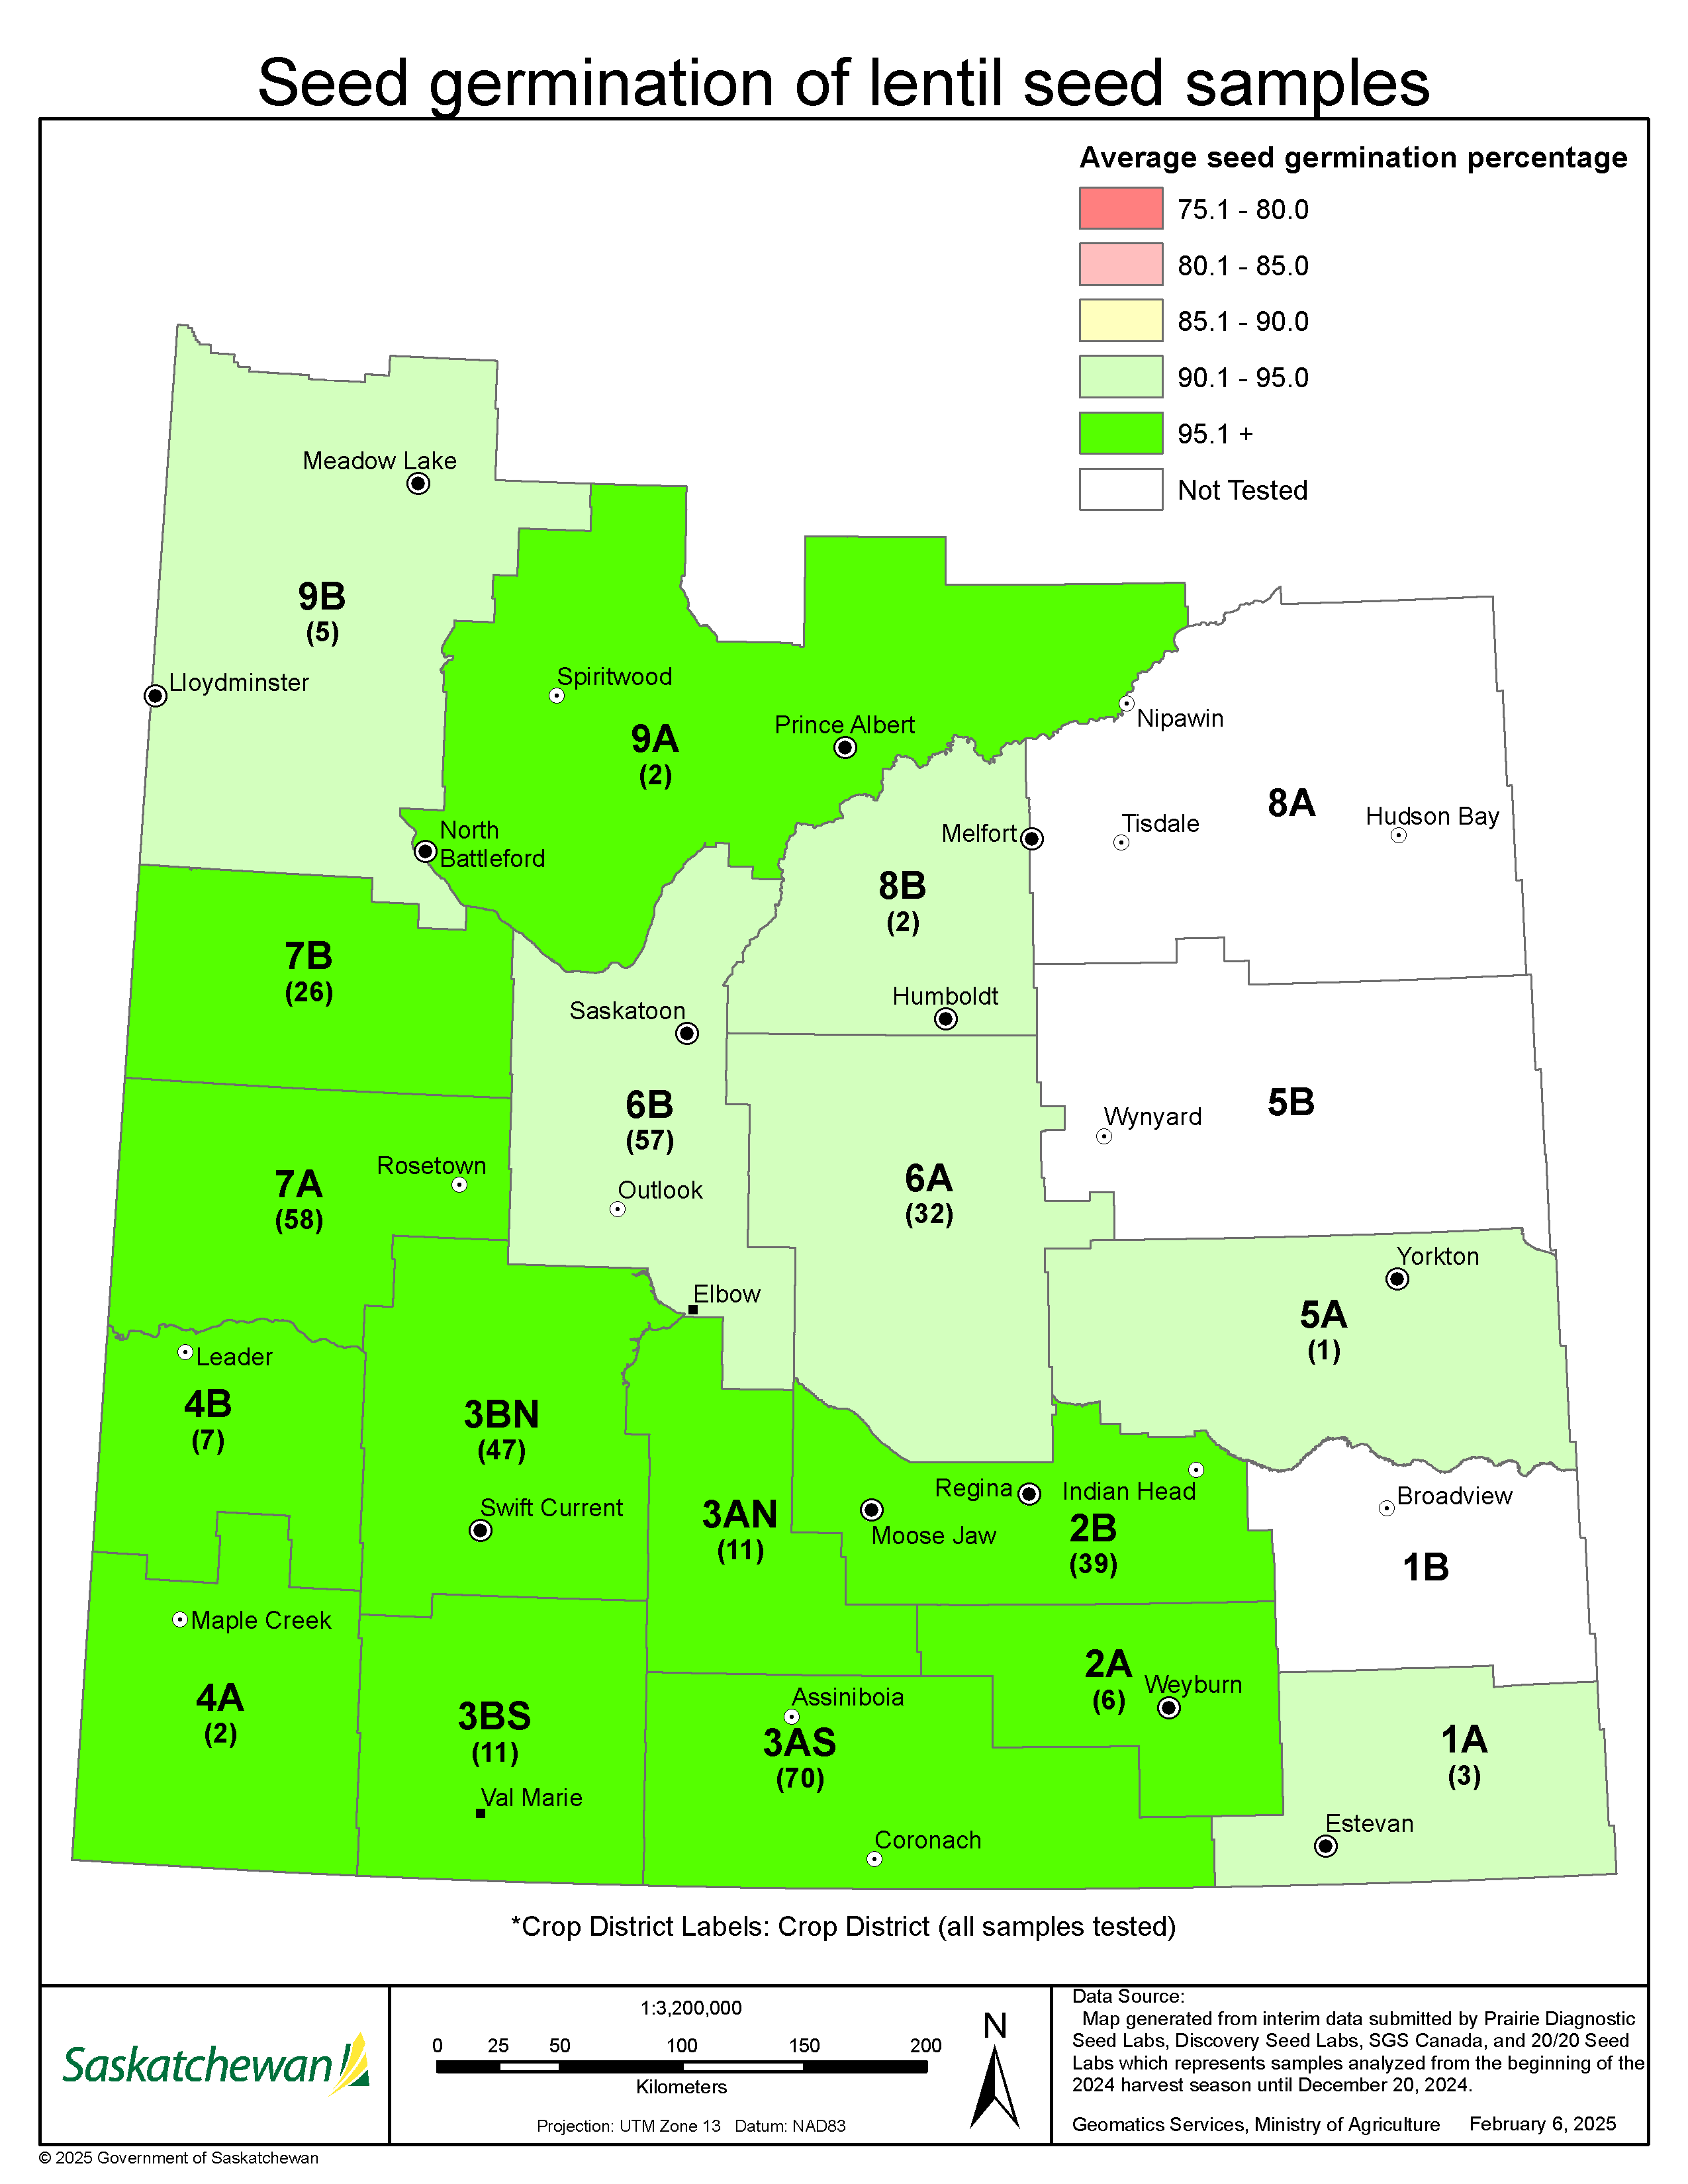
Distribution of submitted samples and crop districts reporting seed-borne pathogens varies across the province. Although the maps created by the Saskatchewan Ministry of Agriculture can help identify areas of lower risk of seed-borne disease, testing of individual seed lots is still recommended.
Table 2. Average per cent of pathogen-free pulse seed samples and average infection levels measured in samples with disease analyzed as of December 20, 2024.
| Crop | Pathogen | Number of Samples | Pathogen-free samples | Mean infection1 |
| (%) | ||||
| Lentils | Ascochyta | 357 | 98.0 | 0.3 |
| Anthracnose | 340 | 96.2 | 0.7 | |
| Botrytis | 353 | 96.0 | 0.5 | |
| Sclerotinia | 354 | 97.5 | 0.5 | |
| Field Peas | Ascochyta | 286 | 36.4 | 1.8 |
| Botrytis | 265 | 91.7 | 0.6 | |
| Sclerotinia | 265 | 94.0 | 0.5 | |
| Chickpeas | Ascochyta | 79 | 84.8 | 0.3 |
| Botrytis | 74 | 93.2 | 3.4 | |
| Sclerotinia | 73 | 98.6 | 0.3 | |
1Mean infection level of samples with disease
Source: Saskatchewan Ministry of Agriculture
Source: Saskatchewan Ministry of Agriculture
Source: Saskatchewan Ministry of Agriculture
Cereal Pathogen Results
The interim results of commercial plate tests for seed-borne fusarium pathogens reveal low mean infection levels in barley, durum, oat, and wheat samples tested as of December 20, 2024, with mean infection levels similar to or slightly higher than 2023. The percentages of total Fusarium spp. and F. graminearum-free samples are similar to or slightly lower than results from 2023.
- F.graminearum was detected on 19.5% of durum, 13.2% of oat, 25.1% of wheat, and 22.2% of barley samples; mean infection levels were 2.0% or lower for all cereal samples.
- The highest percentage of total Fusarium spp.-free samples were in durum (61.5%), followed by wheat and barley (25.8%%); durum and barley had the lowest mean infection levels of total Fusarium spp., 1.6% and 2.3%, respectively.
- Most oat samples (90.9%) had detectable levels of total Fusarium spp. with a mean infection level of 9.8% which is higher than that measured in 2023 (3.7%).
- 74.2% of barley samples reported a detectable level of total Fusarium spp.; however, the mean infection level is 2.3%, which is lower than in 2023 (2.5%).
Table 3. Average per cent of pathogen-free cereal seed samples and average infection levels measured in samples with disease analyzed as of December 20, 2024.
| Crop | Fusarium graminearum | Total Fusarium | ||||
| Number of Samples | Pathogen-free samples | Mean infection1 | Number of Samples | Pathogen-free samples | Mean infection1 | |
| (%) | (%) | |||||
| Barley | 126 | 77.8 | 1.0 | 120 | 25.8 | 2.3 |
| Durum | 236 | 80.5 | 1.3 | 278 | 61.5 | 1.6 |
| Oat | 68 | 86.8 | 1.0 | 66 | 9.1 | 9.8 |
| Wheat | 585 | 74.9 | 2.0 | 516 | 25.8 | 2.9 |
1Mean infection level of samples with disease

Fusarium in Barley.
Source: Saskatchewan Ministry of Agriculture
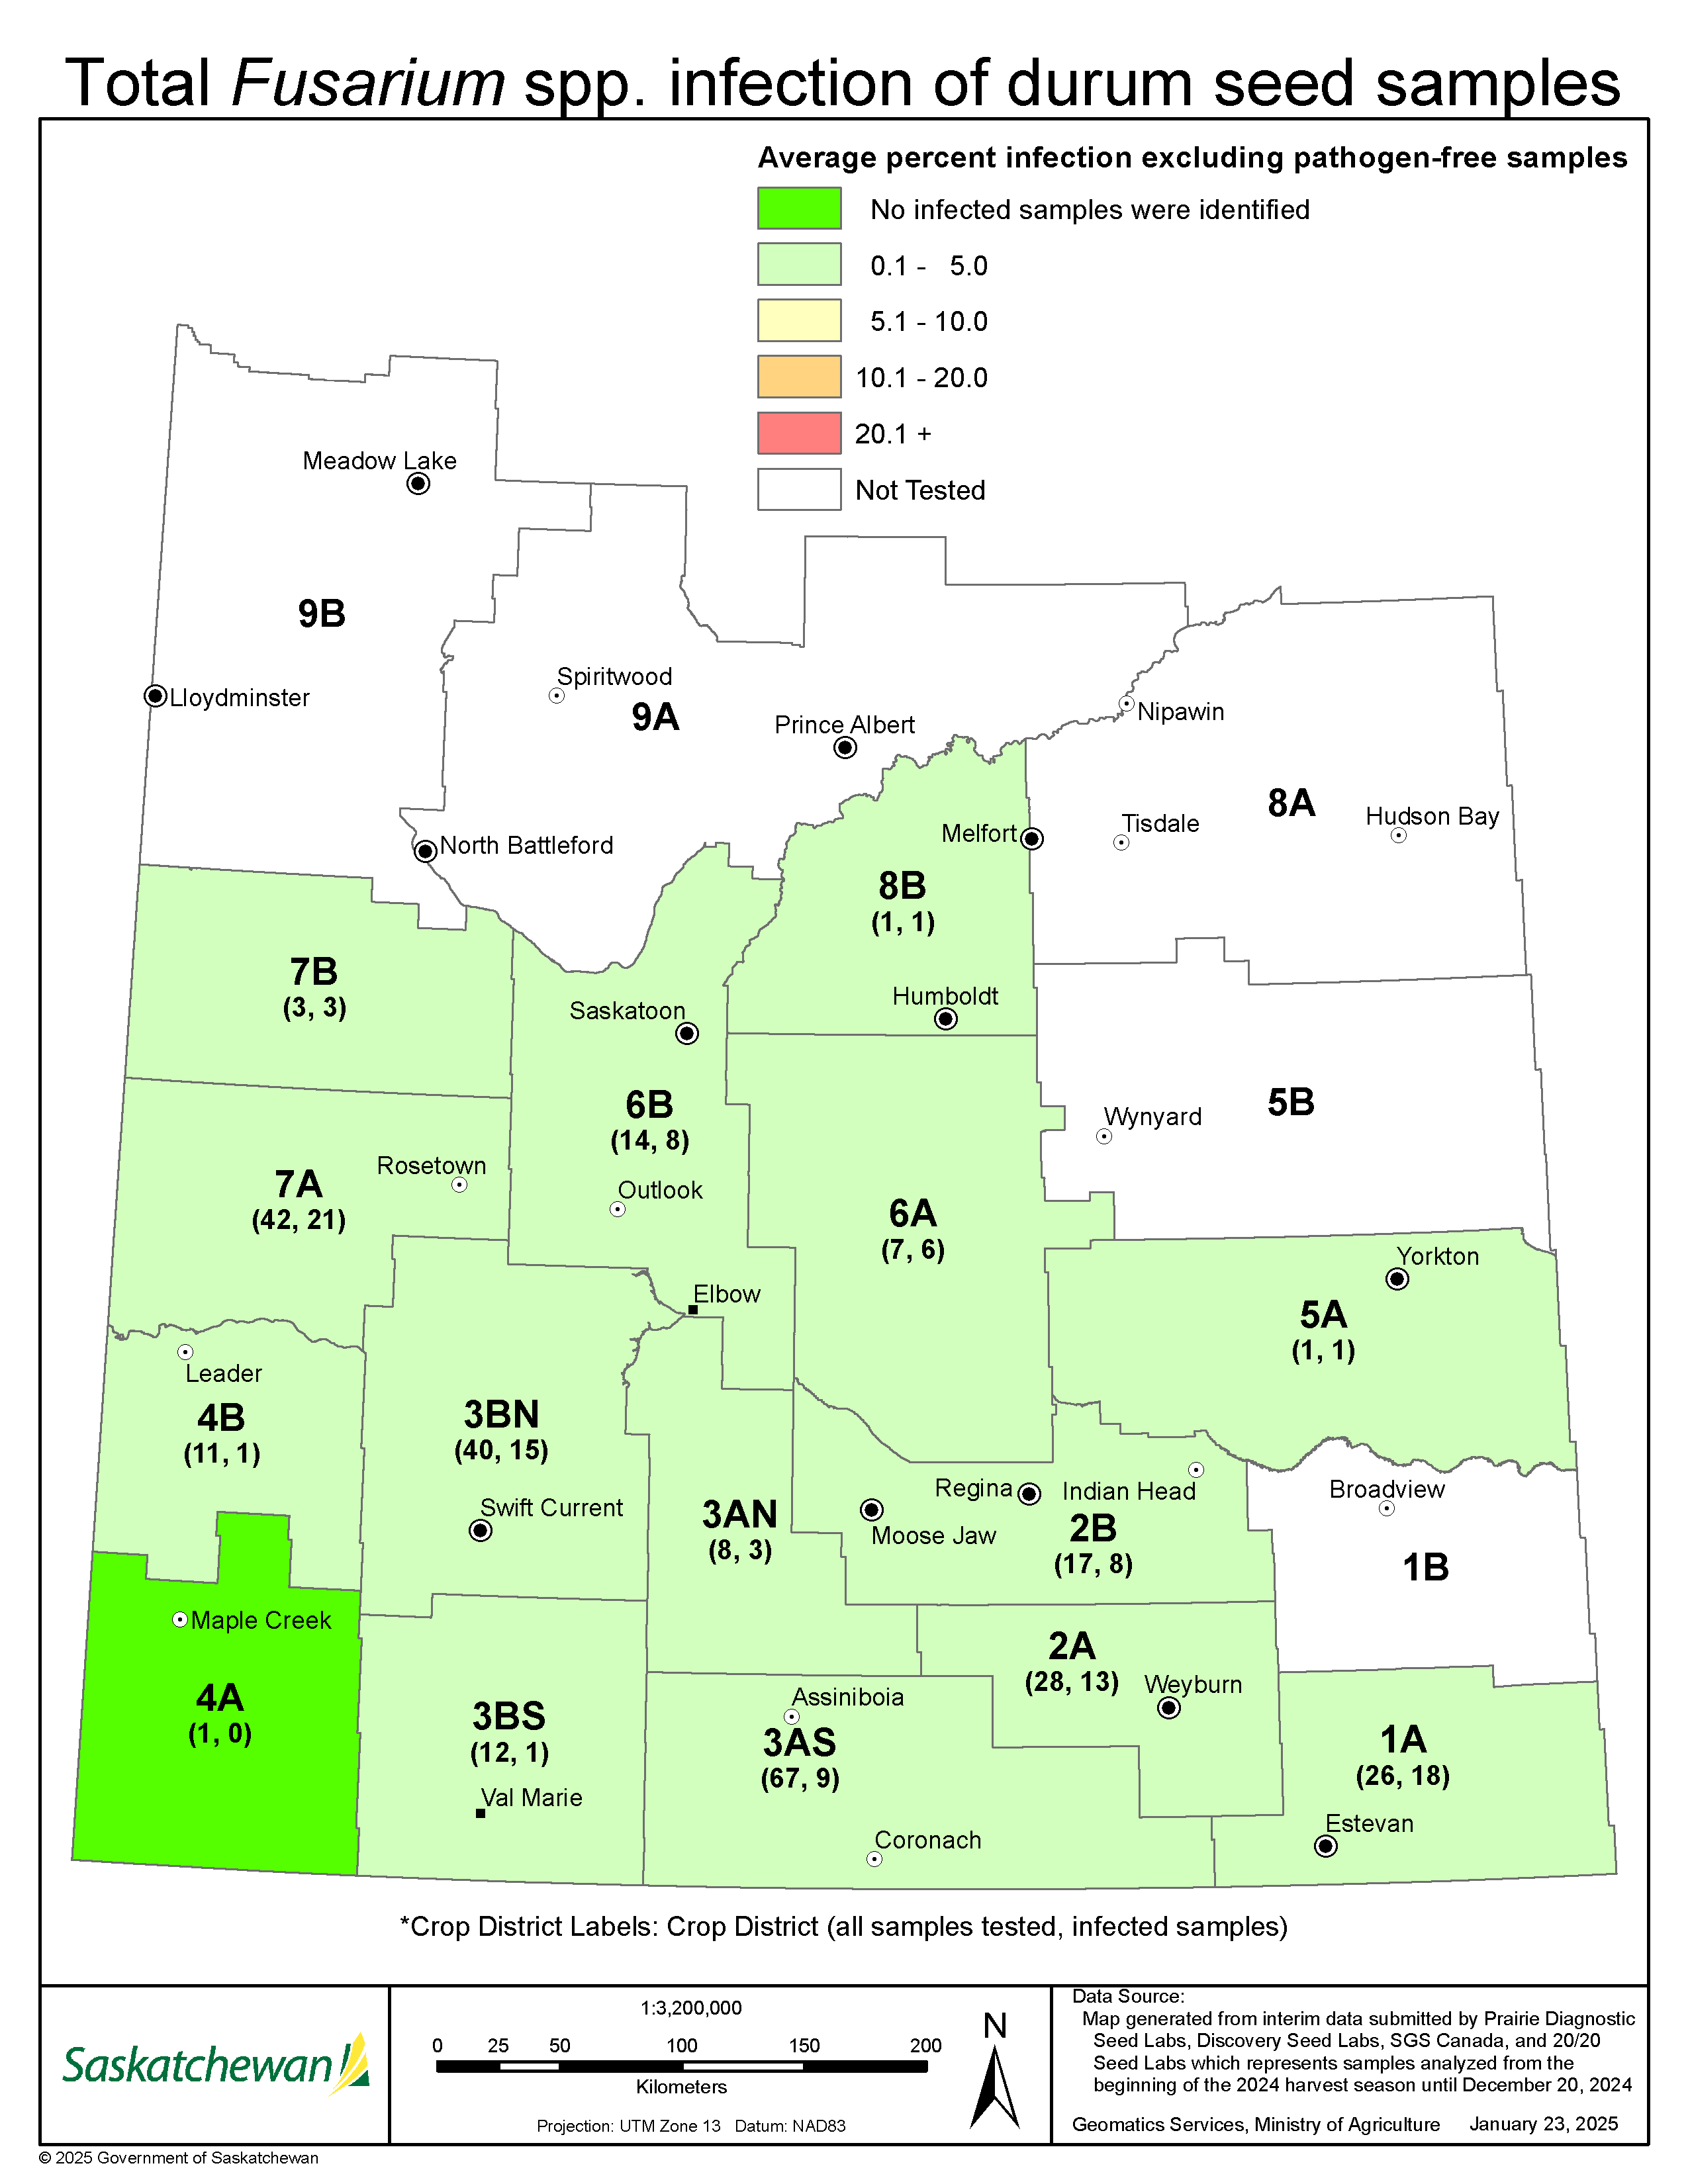
Fusarium in Durum.
Source: Saskatchewan Ministry of Agriculture
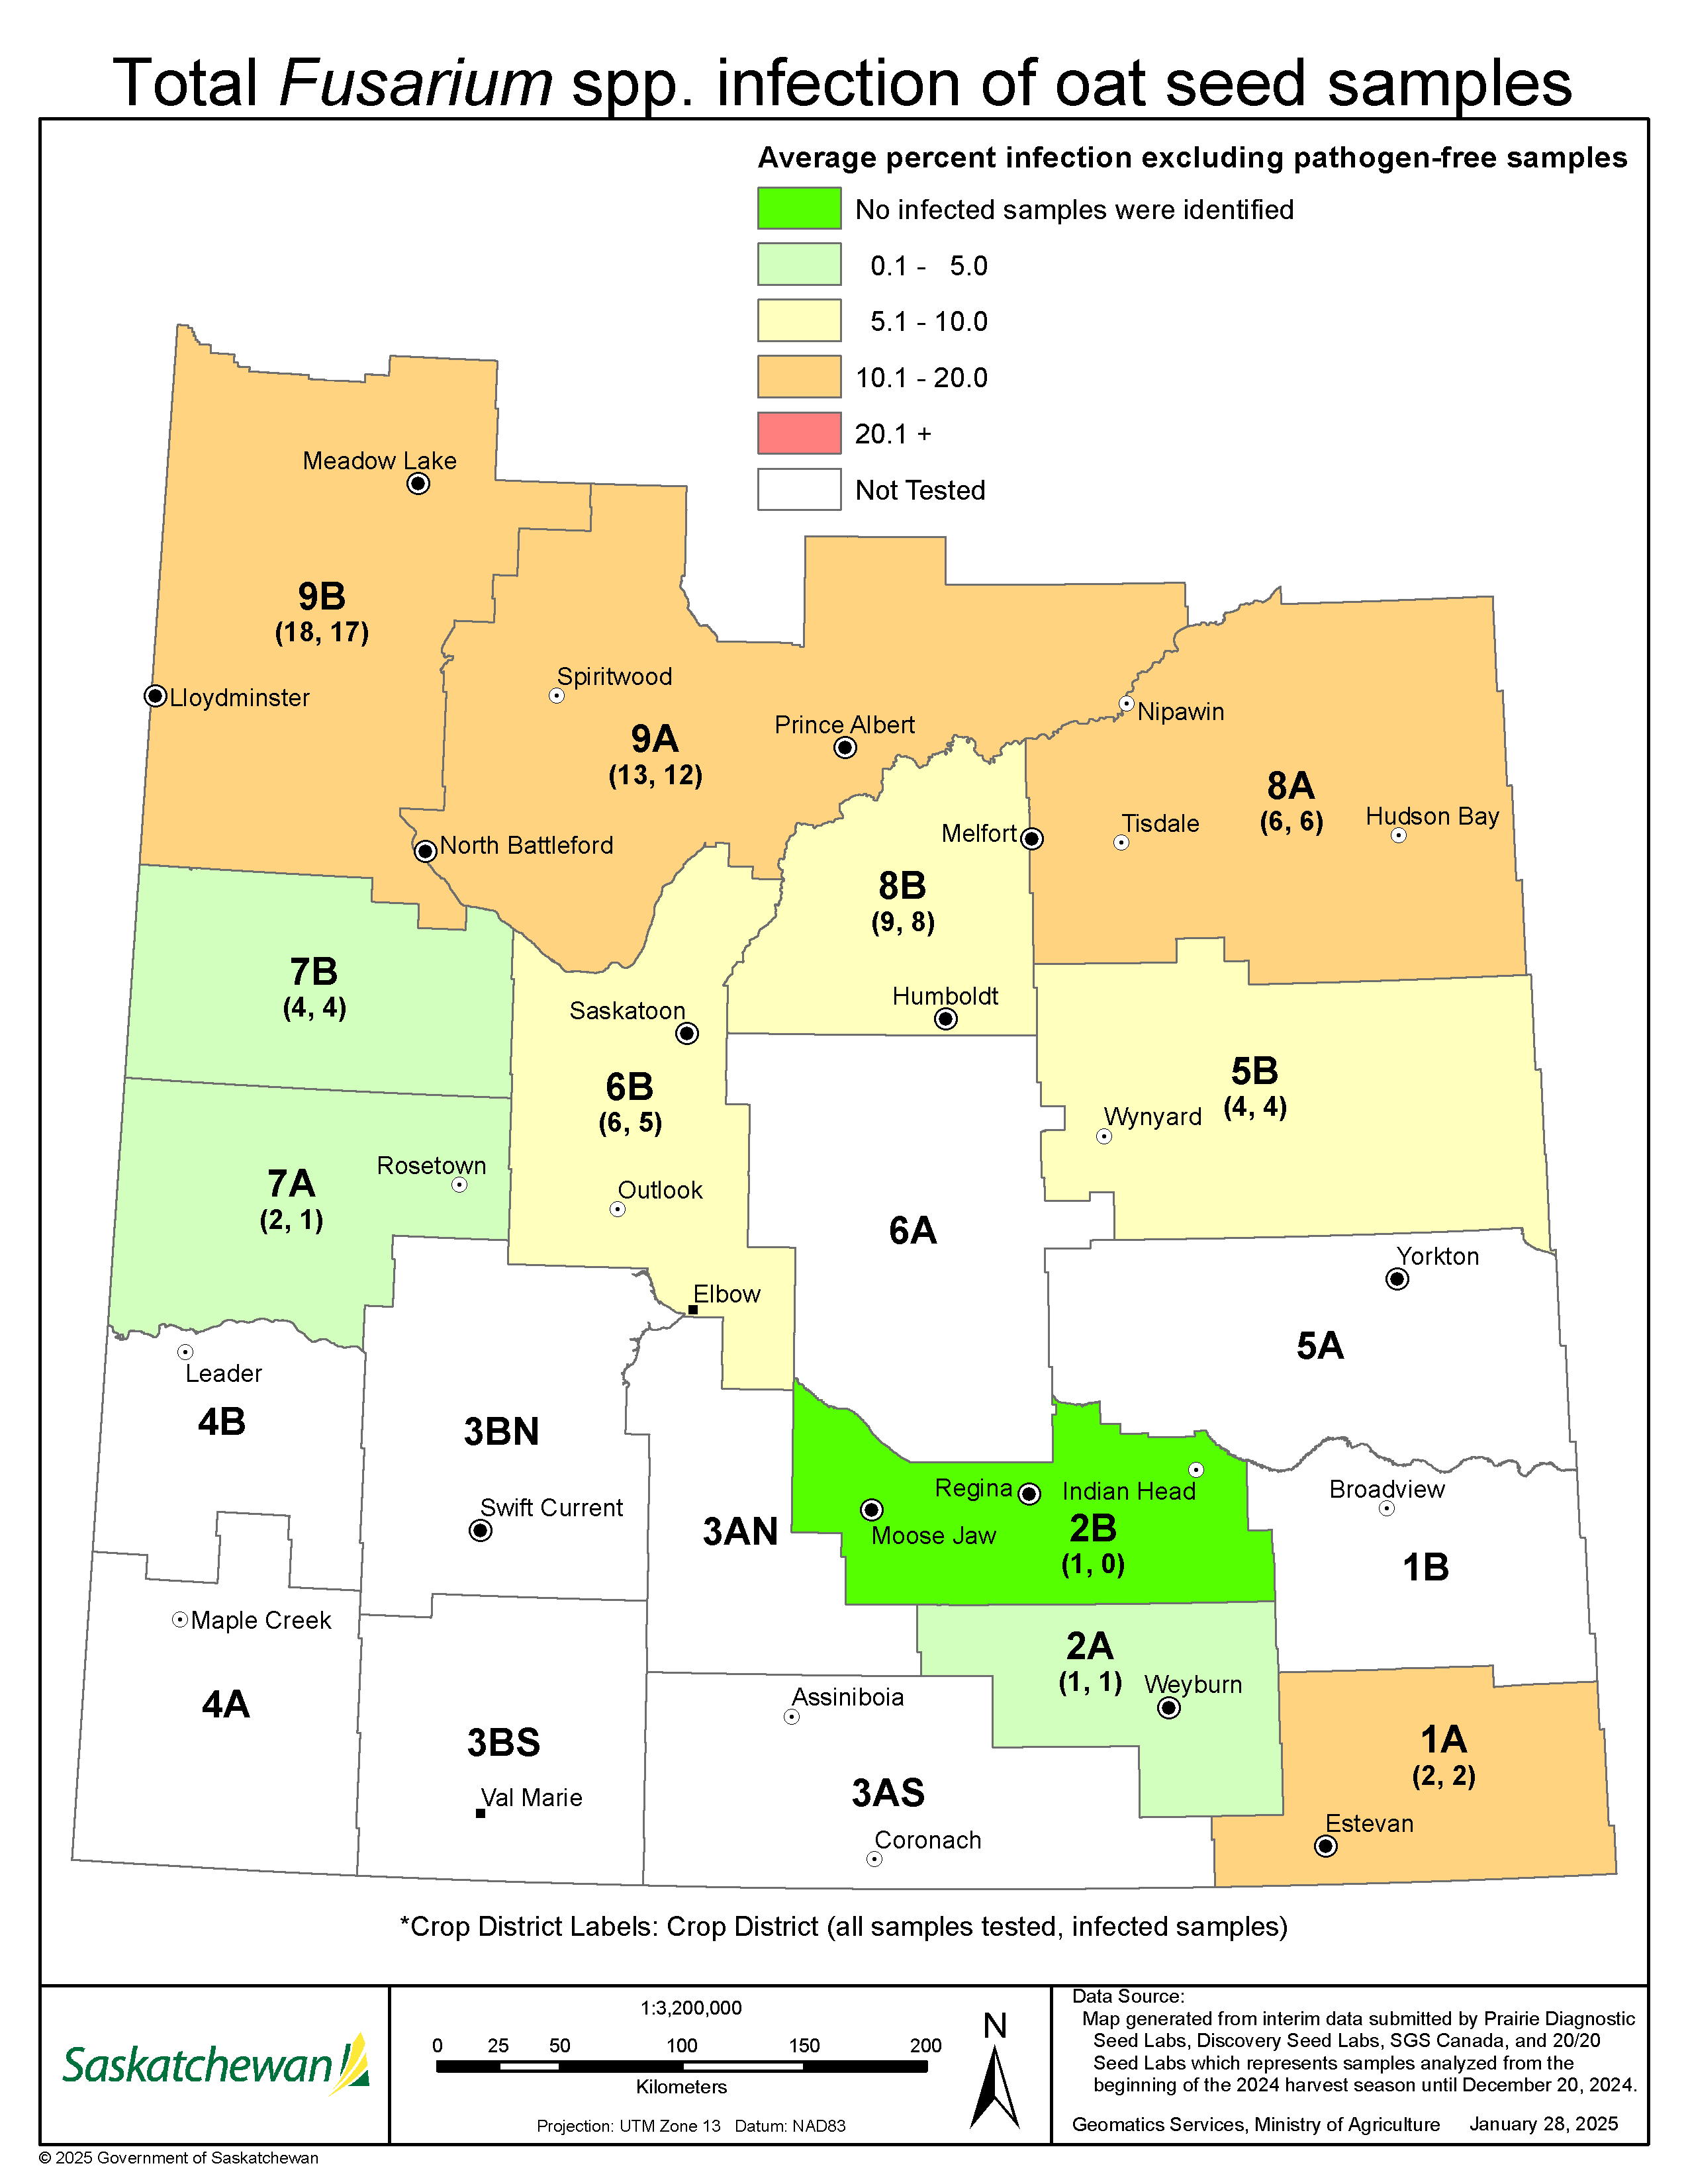
Fusarium in Oat.
Source: Saskatchewan Ministry of Agriculture

Fusarium in Wheat.
Source: Saskatchewan Ministry of Agriculture
Published February 2025