By Marlene Boersch, Mercantile Consulting Venture Inc.
July 2026
The Statistics Canada (StatCan) Estimated Acreage Report for 2026 was published on June 30. The surprise perhaps was that pulse acres were even smaller than in the March StatCan estimate, although most people involved in the trade had been using somewhat smaller numbers than StatCan all along. According to the June report, Canadian farmers seeded almost 1 million fewer pulse acres in 2026 than in 2025.
The question now is if the latest numbers make sense, and what they say about the pulse markets.
StatCan: Estimated Areas of Principal Field Crops [Table 32010-0359-01; June 30, 2026]
| Type of Crop | Acres | % Change | Avg pre-Rep.Trade est. (‘000) | MCV spring est. (‘000) | StatsCan March est. (‘000) | STC Acreage Change ’26 over ’25 | |||||
| 2022 | 2023 | 2024 | 2025 | 2026 | 2024–25 | 2025–26 | 2026 | ||||
| Chickpeas | 233,800 | 315,500 | 480,500 | 541,000 | 532,700 | 12.6% | -1.5% | 475 | 575 | -8,300 | |
| Lentils | 4,321,300 | 3,668,500 | 4,210,100 | 4,379,600 | 3,901,800 | 4.0% | -10.9% | 3,875 | 3,779 | 4,138 | -477,800 |
| Peas, dry | 3,368,100 | 3,047,600 | 3,212,800 | 3,509,700 | 3,029,600 | 9.2% | -13.7% | 3,070 | 2,983 | 3,078 | -480,100 |
| Total Pulse Acres | 7,923,200 | 7,031,600 | 7,903,400 | 8,430,300 | 7,464,100 | -966,200 | |||||
| Change in Acres | -354,800 | -891,600 | 871,800 | 526,900 | -966,200 | ||||||
Acreage decisions: First, it seems that Canadian farmers have been responsive to the market signals that were sent throughout the winter last year: For lentils, the main message was that the 2025 lentil crop was huge (+38% over the previous year), and we would be looking at very big ending stocks this year. In the pea markets the prevailing message was that Canada was blocked from its single biggest market (China had single-handedly imported 2.6 million tonnes in 2021/22), and prices and export shipments pulled back accordingly. Overlay these messages with rotational issues (various disease problems) and a pullback this year does make sense. Especially when considering that at 8.4 million acres in 2025, combined acres of peas, lentils, and chickpeas reached an all-time high. This puts a big 9% pullback to 7.5 million acres in 2026 into better context.
Another important factor not shown above is the 1.82 million acre increase in canola acres this year to a record 23.4 million acres. Price signals for canola were more consistently solid into the spring, and increasing domestic crush capacity and associated domestic market and pricing opportunities swayed farmers to increase their reliance on canola acres. The fact that wheat lost its luster and 1.5 million acres were reallocated away from wheat just made it that much harder to balance this year’s acres amongst crops.
What does this pullback in acres mean within the pulse markets?
Lentils
Importantly, this year’s lentil acreage decrease is already mitigated by significant ending stocks. No matter whose lentil balance sheet you choose to follow, ending stocks calculate anywhere from 1.2 – 1.6 million tonnes for the 2025/26 crop year. Nevertheless, the makeup of the carry-out by lentil type warrants some attention. We expect that roughly only 33% of ending stocks will be comprised of red lentils, with ~42% large greens, and 24% small greens.
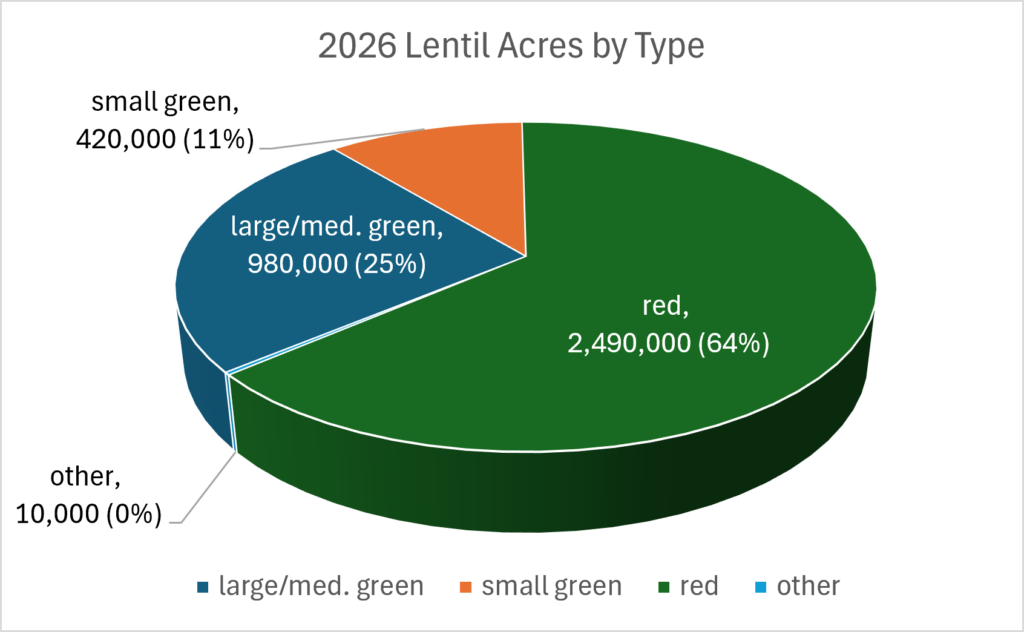
There has also been a significant acreage shift by type of lentil in 2026 away from green lentils back towards more red lentil acres. This is because the premium for new crop greens has mostly disappeared, while reds are easier to produce, tend to have better yields, and can be moved into the export channels more easily. Our current estimate is that the large/medium green lentil acreage has fallen from 35% last year to roughly 23% in 2026, small greens from 16% to 10%, and reds likely increased from 49% last year to about 58% this year.
Even assuming average yields and quality for now and a projected export program of 2.15 million tonnes, this would still leave green lentils more heavily supplied than reds. However, one factor that will impact import demand for Canadian reds is the level of Australian lentil production. Good yields in Australia would heighten Australian competition in the red lentil markets and lower Canadian market share.
Based on above assumptions for the 2026/27 Canadian balance sheet, we calculate the 2026/27 combined lentil ending stocks at just under one million tonnes, which still represents a big 35% stock use ratio. Nevertheless, this would be less severe than the roughly 50% stock use ratio we face this year.
All of this is assuming good average yields for this year’s crop. However, while on one hand, moisture conditions are such that they could support well above-average yields once again this summer, on the other hand (as of July 2), we worry a great deal about disease pressure on pulses. This could easily have devastating effects on both yield and quality this year. Long term weather forecasts allude to the aggressively developing El Niño, with potentially continued difficulties for portions of North America. Flooding has been noted in Canada’s prairies, and there could be more of that during the next few weeks.
International aspects: United States Department of Agriculture (USDA) reported today that the United States(U.S.) lentil area to be harvested has shrunk to around 700,000 acres, down 26% from 2025. In addition, about 75% of the U.S. lentil acreage is located in Montana, which experienced major drought conditions earlier this year. The US production outcome will primarily affect the green lentil balance sheet.
In contrast, the Australian lentil area rose slightly to just above 1 million hectares. In addition, thanks to increased precipitation, their earlier production outlook has improved significantly to around 2 million tonnes. If the crop comes off well, Australian reds will compete into all major red lentil destinations. We are not definitive about the Black Sea lentil outlook, but they could contribute another 400,000 tonnes to the global supply. Regarding India, we are watching the monsoon developments to see if India will be able to maximize their production potential. (The Indian government’s official advance estimate for the 2026 lentil output is at 1.73 and 1.82 million tonnes) As of now, the monsoon progress lags by approximately 5 days, and India’s monsoon precipitation is 41% behind normal. Unless there is a catchup, this could increase the overall demand outlook for lentils.
Peas
For peas, the 13.7% decrease in seeded acreage to around 3 million acres this year will also be cushioned by significant carry-in stocks this crop year. The 2025/26 crop pea ending stocks are estimated at anywhere from 900,000 to 1.2 million tonnes. Despite the significant pickup in yellow pea exports to China as of March, we estimate that roughly 77% of the pea ending stocks will be yellow peas, with the remainder mostly green peas.
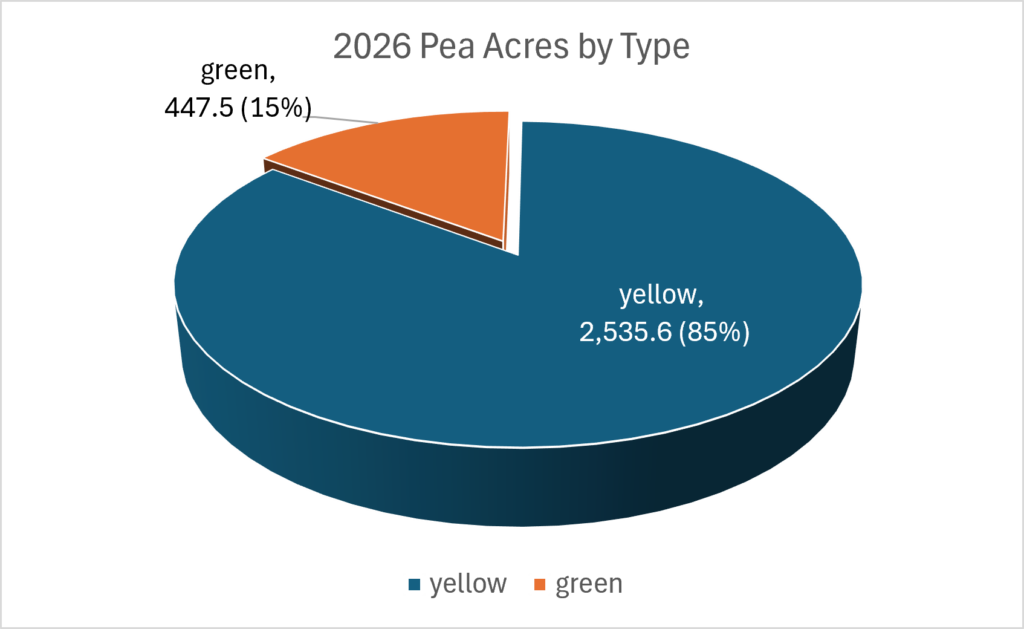
For the 2026/27 crop year, we think that about 85% of the acreage has gone into yellow pea varieties because of the improved export movement into China. Assuming the enhanced commercial relations between Canada and China hold, we expect yellow pea exports to continue doing well in the new crop year. Given our projected 2.5 million tonnes export program, we think that pea stocks will be reduced significantly this coming year, with yellow pea stocks potentially falling to a 14-15% stock use ratio, while the green pea stock-use ratio is likely to remain higher.
The above is assuming average yields of about 35 bushels per acre (bu/ac). Again, looking at the good moisture conditions now, yields might be able to reach the 42 bu/ac harvested last year. However, the elevated moisture and unsettled weather conditions also come with a much higher disease threat, which might still upset yield and quality assumptions.
International aspects: USDA pegged U.S. pea acres at 1.05 million acres, down 11% from the previous year. About 59% of these acres are in Montana, which has had weather problems this spring. Basis average yields, production should reach about 755,000 tonnes (down 12% from last year), but adding carry-in, supply at 1.03 million tonnes would just be 4.5% lower than last year’s.
We currently estimate the Black Sea (Russia & Ukraine) pea production at approximately 4.4 million tonnes, down about 11% from last year’s.
We think that global pea production by the major producers might well be 13% (-2 million tonnes) smaller than last year’s. This should lead to lower ending stocks in exporting countries.
We expect export demand prospects for peas to be positive. High prices for food and especially for meat generally spell increased demand for pulses for human consumption. Regarding demand by India, the world’s single biggest importer of pulses, the outcome of the monsoon in India will influence India’s import tariff scheme and overall import demand for pulses.
However, demand for feed peas might be affected by lower prices for other feed crops, and potentially by lower quality cereal crops. For example, grains downgraded due the effects of the recent heat in the European Union, or grains downgraded by excess rain in North America.
Overall: While Canadian pulse acres are down, the 2026 production outlook for lentils and peas currently is quite good, and given ample carry-in this year, both crops should remain well supplied in the new crop year. Having said this, there are increasing concerns about the effects of excess moisture on the 2026 yield and quality.
Looking beyond Canada, global production (major producers) for both lentils and peas is expected to be down this year compared to last year. While competition for major markets remains brisk, the overall demand outlook for pulses is encouraging.
Marlene Boersch is a managing partner in Mercantile Consulting Venture Inc. More information can be found at www.mercantileventure.com.